Quelle: R. Padovani, Training Course on Radiation Protection Training for Interventional Cardiologists and Radiologists, Dose Quantities and Units (in cache)
zum Vergrößern auf Bild klicken
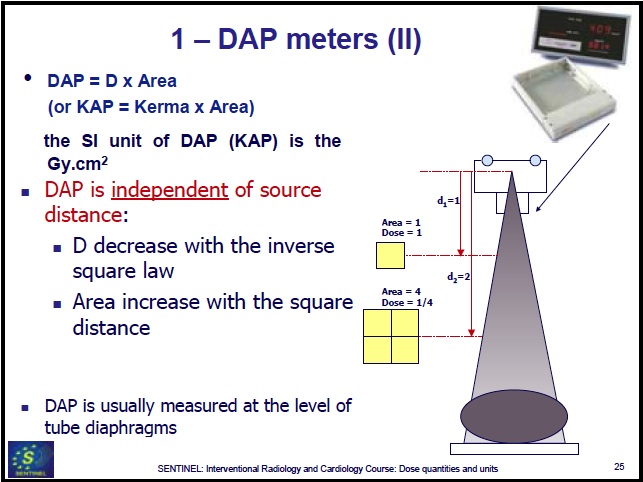
Definition: DAP (Gy cm2) = Dosis x Fläche
Beispiel (BwKh Berlin, 8.8.2019): DAP = 61.3 μGy m2,
mit Fläche der Hüfte: 0.09 m2 ergibt sich eine Strahlenbelastung 61.3 μGy m2/(0.09 m2) = 0.681 mGy = 68.1 mrem
absorbed dose, D
Source: IAEA, Nuclear Installation Safety Net - Tutorials - Regulatory Control, Glossary D (in cache)
The fundamental dosimetric quantity D is defined as:
D = dε/dm
where dε is the mean energy imparted by ionizing radiation to matter in a volume element and dm is the mass of matter in the volume element.
The energy can be averaged over any defined volume, the average dose being equal to the total energy imparted in the volume divided by the mass in the volume.
Absorbed dose is defined at a point; for the average dose in a tissue or organ, see organ dose (in cache).
Unit: J/kg, termed the gray (Gy) (formerly, the rad was used).
1 Gy = 100 Rad
1 Rad = 0.01 Gy = 1 cGy
10 mGy = 1 cGy (analogous to 10 mm = 1 cm = 0.01 m)
1.15 R of gamma radiation exposure results in 1 Rad of
absorbed dose.
Gewebewichtungsfaktor -
Organ Weighting Factor (wT)
Sievert (Sv) = Gy x wR
1 Sv = 100 rem
with 1 year = 365.2422 days follows:
1 μSv/h = 8766 μSv/a = 876600 μrem/a ≈ 1 rem/a
Quelle: IAEA, Nuclear Installation Safety Net - Tutorials - Regulatory Control, Glossary D (in cache)
zum Vergrößern auf Bild klicken Definitionen: Dosis
Quelle: Annex 1.1, Umweltradioaktivität und Strahlenbelastung, Jahresbericht 2009, Bundesamt für Strahlenschutz (im Cache)
zum Vergrößern auf Bild klicken Abbildung: Radiation Weighting Factors wR (deutsch: Strahlungswichtungfaktoren). wR is also called "Quality Factor" Q
Quelle: Annex 1.2, Umweltradioaktivität und Strahlenbelastung, Jahresbericht 2009, Bundesamt für Strahlenschutz, BfS (im Cache)
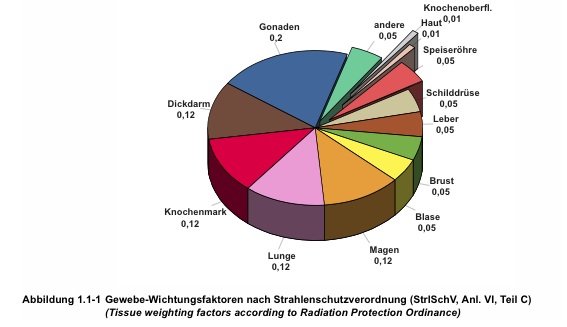
zum Vergrößern auf Bild klicken Abbildung: Organ Weighting Factors wT (deutsch: Gewebewichtungsfaktoren)
"Dadurch, dass die effektive Dosis entsprechend der Strahlenwirkung gewichtet ist und damit einem bestimmten Risiko zugeordnet [worden ist], lassen sich die effektiven Dosen aus verschiedenen [Strahlen]Quellen zu einem Wert für die Gesamtstrahlenbelastung eines Menschen addieren. Auf der Ebene der Dosisbetrachtung [werden auf diese Weise] die Beiträge aus natürlichen, zivilatorisch veränderten und zivilisatorischen Strahlenquellen verglichen." (Quelle BfS)
Dose Equivalent (HT) (deutsch: "Organdosis")
The product of the absorbed dose (DT,R, Gray), the radiation weighting factor (wR), and any other modifying factors (omitted henceforth):
HT = wR DT,R
where DT,R is the absorbed dose delivered by radiation type R averaged over a tissue or organ T and wR is the radiation weighting factor for radiation type R. When the radiation field is composed of different radiation types with different values of wR the equivalent dose is:
HT = ΣR wR DT,R
The SI unit of dose equivalent is the sievert (Sv); the conventional unit is the rem (1 rem = 0.01 Sv).
Committed Dose Equivalent (HT,50)
The dose equivalent (HT) deposited over the 50-year period following the intake of a radionuclide.
Effective Dose Equivalent (HE) (deutsch: "Effektive Dosis")
The sum over specified tissues of the products of the dose equivalent in a tissue or organ (T) and the weighting factor wT for that tissue:
HE = ΣT wT HT
ΣT wT = 1
Committed Effective Dose Equivalent (HE,50)
The weighted sum of committed dose equivalents to specified organs and tissues, in analogy to the effective dose equivalent.
HE,50 = ΣT wT HT,50
HT,50, HE,50 as defined in Title 10, Section 20.1003, of the Code of Federal Regulations (10 CFR 20.1003)
Definitions
HT,50 and HE,50 as defined in Title 10, Section 20.1003, of the Code of Federal Regulations (10 CFR 20.1003 - in cache)
A measure of the hazard of nuclear material is provided by the toxicity and in particular its radiotoxicity arising from its radioactive "quality" rather than the chemical toxicity. The radiotoxicity of a nuclide is determined by its effective dose coefficient e(T), which accounts for radiation and tissue weighting factors, metabolic and biokinetic information. The quantity T is the integration time in years following intake [lifetime of the person after intake of the radionuclide]. For adults, integration time T = 50 years.
Committed Effective Dose(50)CED(T)
The radiotoxicity [quantified as] "Committed Effective Dose" CED(T) (unit: Sv) resulting from intake of a particular nuclide is the product of the effective dose coefficient e(T) (unit: Sv/Bq) and the activity (unit: Bq) of that nuclide i.e. for an adult
EPA knew that partial body irradiation was common for ingested radionuclides since they are, like radium, largely deposited in a particular organ.
In such cases, EPA acknowledged that the risk per millirem varies depending on the radiosensitivity of
the organs at risk.
For example (thyroid exposure compared with whole body exposure):
EPA estimated that cancers due to the thyroid gland receiving 4 mrem per year continuously ranged
from about 0.2 to 0.5 per year per million exposed persons (averaged over all age groups).
Fatality due to thyroid cancer varies with age, from nearly zero for children and young adults to about 20 percent of the incidence for persons well past middle age.
EPA noted (therefore) that estimated fatalities from thyroid exposure were at least five times less than that
from whole body exposure.
Äquivalentdosis - eine Zusammenfassung
(Quelle: Annex 1.2, Umweltradioaktivität und Strahlenbelastung, Jahresbericht 2009, Bundesamt für Strahlenschutz (im Cache)
Die Wirkung einer Strahlenart auf ein Organ [(Organdosis, HT) wird] durch Multiplikation der Energiedosis DT, R [Gray] mit dem Strahlungswichtungsfaktor wR und dem Gewebewichtungsfaktor wT in Zahlen gefasst.
Soll die effektive Dosis E ("Äquivalentdosis") für eine Strahlenexposition durch mehrere Strahlungsarten berechnet werden, die mehrere Organe betreffen, so müssen die genannten Formeln zusammengefasst und eine Summierung über alle Komponenten durchgeführt werden:
E = ΣT wT HT = ΣT wT ΣR wR DT, R
Dosisfaktor
Sv/(Bq incorporated)
dose equivalent (Sv) = dose factor
x Bq incorporated
specified in Regulatory Guide 1.109 "Calculation of Annual Doses to Man from Routine Releases of Reactor Effluents for the Purpose of Evaluating Compliance with 10 CFR Part 50, Appendix I", Revision 1, October 1977, US Nuclear Regulatory Commission (in Cache)
Activity (Bq) deposited in an organ
depends on intake pathway. Sv in an organ is a function of Bq deposited
in that organ. Dose factor depends on intake pathway, because Bq deposited
varies with intake pathway.
pathway dose factors, unit: (mrem/hr) / (μCi/ml) ...
... are basically the dose conversion factors (Sv/Bq or mrem/μCi) multiplied by transfer factors relating the radionuclide spill (contamination of released water (μCi/ml), release period (hr)) to radionuclide uptake (μCi) via that pathway:
dose due to spill (mrem) = pathway dose factor x contamination of spilled water (μCi/ml) x duration of spill (hr)
As defined in Title 10, Section 20.1003, of the Code of Federal Regulations (10 CFR 20.1003), ALI is the derived limit for the amount of radioactive material taken into the body of an adult worker by inhalation or ingestion in a year.
ALI is the smaller value of intake of a given radionuclide in a year by the "reference man" that would result in
a committed dose equivalent (CDE) HT.50 = 50 rems (0.5 Sv, in cache) to any individual organ or tissue, or
a committed effective dose equivalent (CEDE) HE.50 = 5 rems (0.05 sievert, in cache).
ALI values for intake by ingestion and inhalation of selected radionuclides are given in Table 1, Columns 1 and 2, of Appendix B to 10 CFR Part 20 (in cache), "Standards for Protection Against Radiation." For additional detail, see Information for Radiation Workers .
Primordial radionuclides are left over
from when the world and the universe was created. They are typically long
lived, with half-lives often on the order of hundreds of millions of years.
Radionuclides that exist for more than 30 half-lives are not measurable.
The progeny or decay products of the long lived radionuclides are also
in this heading. Here is some basic information on some common primordial
radionuclides:
Primordial nuclides
Nuclide
Symbol
Half-life
Natural Activity
Uranium 235
235U
7.04 x 10⁸
yr
0.72% of all natural uranium
Uranium 238
238U
4.47 x 10⁹
yr
99.2745% of all natural uranium;
0.5 to 4.7 ppm total uranium in the common rock types
Thorium 232
232Th
1.41 x 10¹⁰
yr
1.6 to 20 ppm in the common rock
types with a crustal average of 10.7 ppm
Radium 226
226Ra
1.60 x 10³
yr
0.42 pCi/g (16 Bq/kg) in limestone
and 1.3 pCi/g (48 Bq/kg) in igneous rock
Radon 222
222Rn
3.82 days
Noble Gas; annual average air concentrations
range in the US from 0.016 pCi/L (0.6 Bq/m3) to 0.75 pCi/L (28
Bq/m3)
Potassium 40
40K
1.28 x 10⁹
yr
soil - 1-30 pCi/g (0.037-1.1 Bq/g)
Some nuclides like 232Th
have several members of its decay chain. You can roughly follow the chain
starting with 232Th
Russ
Brown:
Potassium-40 content of the body
can be obtained from its natural abundance of 0.0117% of potassium and
calculating the specific activity of natural potassium (30.5 Bg/g) using
the half life (1.28 x 10⁹ y). The potassium content of the body is 0.2%,
so for a 70 kg man the amount of 40-K
will
be about 4.26 kBq.
14C content of the body is based
on the fact that one 14C atom exists in nature for every 1,000,000,000,000
12C atoms in living material. Using a half life of 5730 y, one obtains
a specific activity of 0.19Bq/g of carbon. As carbon is 23 percent of the
body weight, the body content of 14-C for a 70 kg man would be about
3.08
kBq.
Radon as factor for the exposure of the population, Bulgarian Nuclear Regulatory Agency (in cache, 25 November 2011)
dose conversion coefficient for Radon recommended by the ICRP: 0.017 mSv/a per Bq/m3 (valid for an exposure time of 19 hours per day).
Radon in Buildings, Canadian Centre for Occupational Health and Safety, May 26, 2009 (in cache)
zum Vergrößern auf Bild klicken
Abbildung: Verteilung der mittleren Radonkonzentrationen in Gebäudeluft
Quelle: Fig. XIV of UNSCEAR 09-86753 Report 2008 Annex B (im Cache), United Nations Scientific Committee on the Effects of Atomic Radiation (UNSCEAR).
Die Berechnung der Strahlenbelastung (0.017 mSv/a pro Bq/m3) gilt für eine Aufenthaltsdauer im Gebäude von 19 Stunden/Tag.
Radon concentration at the shores of large oceans is typically 1 Bq/m3.
Radon trace concentration above oceans or in Antarctica can be lower than 0.1 Bq/m3.
10
0.27
0.17
Mean continental concentration in the open air: 10 to 30 Bq/m3 = 0.17 to 0.51 mSv/a.
Based on a series of surveys, the global mean indoor radon concentration is estimated to be 39 Bq/m3 = 0.66 mSv/a.
100
2.7
1.7
Typical indoor domestic exposure.
Most countries have adopted a radon concentration of 200 - 400 Bq/m3 = 3.4 - 6.8 mSv/a for indoor air as an Action or Reference Level.
If testing shows levels less than 4 picocuries radon per liter of air (160 Bq/m3), then no action is necessary.
1,000
27
17
Very high radon concentrations (>1000 Bq/m3) have been found in houses built on soils with a high uranium content and/or high permeability of the ground.
If levels are 20 picocuries radon per liter of air (800 Bq/m3) or higher, the home owner should consider some type of procedure to decrease indoor radon levels.
10,000
270
170
The "Working Level" in uranium mines corresponds to a 7000 Bq/m3 concentration.
The concentration in the air at the (unventilated) Gastein Healing Gallery averages 43 kBq/m3 (about 1.2 nCi/L) with maximal value of 160 kBq/m3 (about 4.3 nCi/L).[55]
100,000
2700
1700
About 100,000 Bq/m3 (2.7 nCi/L) was measured in Stanley Watras's basement
1,000,000
27000
17,000
Concentrations reaching 1,000,000 Bq/m3 can be found in unventilated uranium mines.
geschätzter Anteil in %
mit einer Belastung >200 Bq/m3
geschätzter Anteil in %
mit einer Belastung >400 Bq/m3
Baden-Württemberg
1 831,8 a)
38 (0.65)
2,9
0,6
Bayern
2 218,8 a)
41 (0.70)
3,3
1,2
Berlin
265,8 a)b)
27 (0.46)
0,3
0
Brandenburg
472,6 b)
26 (0.44)
0
0
Bremen
121,1 a)
30 (0.51)
0
0
Hamburg
207,2 a)
27 (0.46)
0,2
0
Hessen
1 102,8 a)
40 (0.68)
1
0,2
Mecklenburg-Vorpommern
294,6 b)
39 (0.66)
> 0 1)
> 0 1)
Niedersachsen
1 577,1 a)
32 (0.54)
0,8
0,1
Nordrhein-Westfalen
2 976,9 a)
35 (0.60)
0,6
0,2
Rheinland-Pfalz
884,1 a)
51 (0.87)
2,3
0,4
Saarland
261,5 a)
46 (0.78)
1,8
0,4
Sachsen
692,9 b)
47 (0.80)
6,5
2
Sachsen-Anhalt
502,6 b)
34 (0.58)
0,8
> 0 1)
Schleswig-Holstein
576,5 a)
36 (0.61)
1,1
> 0 1)
Thüringen
462,1 b)
54 (0.92)
3,9
0,7
a) Gebäude- und Wohnungszählung
vom 25. Mai 1987
b) Gebäude- und Wohnungszählung
1995
1)aufgrund der Erfahrungen
über die regionale Verteilung des Radonpotentials im Untergrund ggf.
tatsächlicher Prozentsatz höher als die über den aus Stichproben
ermittelten Ergebnisse.
Quelle:
Bundesamt
für Strahlenschutz [22-6]
Cosmic radiation is really divided into two types, primary and secondary.
Primary cosmic radiation is made up of extremely high energy particles (up to 1018 eV), and are mostly protons, with some larger particles. A large percentage of it comes from outside of our solar system and is found throughout space. Some of the primary cosmic radiation is from our sun, produced during solar flares.
Little of the primary cosmic radiation penetrates to the Earth's surface, the vast majority of it interacts with the atmosphere. When it does interact, it produces the secondary cosmic radiation, or what we actually see here on Earth. These reactions produce other lower energy radiations in the form of photons, electrons, neutrons and muons that make it to the surface.
The atmosphere and the Earth's magnetic fields also act as shields against cosmic radiation, reducing the amount that reaches the Earth's surface. With that in mind, it is easy to see that the annual dose you get from cosmic radiation depends on what altitude you are at. From cosmic radiation the U.S., the average person will receive a dose of 27 mrem per year and this roughly doubles every 6,000 foot increase in elevation.
Cosmic radiation permeates all of space,
the source being primarily outside of our solar system. The radiation is
in many forms, from high speed heavy particles to high energy photons and
muons. The upper atmosphere interacts with many of the cosmic radiations,
and produces radioactive nuclides. They can have long half-lives, but the
majority have shorter half-lives than the primordial nuclides. Here is
an table with some common cosmogenic nuclides:
Cosmogenic Nuclides
Nuclide
Symbol
Half-life
Source
Natural Activity
Carbon 14
14C
5730 yr
Cosmic-ray interactions, 14N(n,p)14C;
6 pCi/g (0.22 Bq/g) in organic material
Tritium 3
3H
12.3 yr
Cosmic-ray interactions with N and
O; spallation from cosmic-rays,
6Li(n,alpha)3H
0.032 pCi/kg (1.2 x 10⁻³
Bq/kg)
Beryllium 7
7Be
53.28 days
Cosmic-ray interactions with N and
O;
0.27 pCi/kg (0.01 Bq/kg)
Some other cosmogenic radionuclides
are 10Be,
26Al,
36Cl,
80Kr,
14C,
32Si,
39Ar,
22Na,
35S,
37Ar,
33P,
32P,
38Mg,
24Na,
38S,
31Si,
18F,
39Cl,
38Cl,
34mCl.
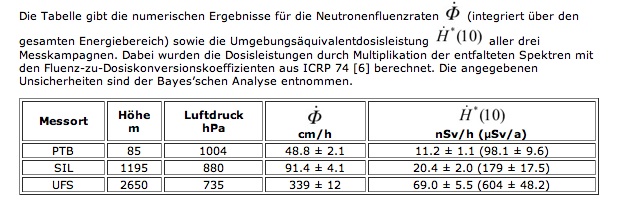
Abbildung: Neutronenhintergrundstrahlung in Abhängigkeit von der Höhe
"Da die Anzahldichte der Neutronen aus der kosmischen Strahlung sehr klein ist, dauern die Messkampagnen in der Regel 6 bis 8 Wochen. Um für den gesamten Zeitraum aus den gesammelten Daten ein gemitteltes Ergebnis zu bekommen, ist es unerlässlich auf den wechselnden Luftdruck und andere Umwelteinflüsse (wie z. B. auf zusätzliche Moderation bei Schneefall) zu korrigieren."
"Die Erde wird fortwährend von hochenergetischen (schnellen), geladenen Teilchen aus den Tiefen des
Alls getroffen. Diese kosmische Strahlung besteht
zu etwa 98% aus Atomkernen:
87% Wasserstoffkerne, d.h. Protonen,
12% Heliumkerne, und
etwa 1% schwere Kerne.
und zu 2% aus Elektronen.
"Ein Teil dieser Atomkerne wechselwirkt mit den Molekülen und Atomkernen der Erdatmosphäre und erzeugt dabei schnelle Neutronen. Während die geladenen Teilchen mit größerer Eindringtiefe in die Atmosphäre stark abgebremst und ihre Anzahl auf dem Weg bis zum Erdboden sehr stark reduziert wird, erreicht ein weitaus größerer Teil der erzeugten Neutronen die Erdoberfläche mit Energien im meV Bereich (thermische Neutronen) bis hin zu einigen hundert MeV."
"Die Neutronenfluenz variiert
mit der Höhe über dem Meeresspiegel - genauer mit der Dicke der durchlaufenen Luftschicht - und folglich auch mit dem Luftdruck,
mit der geografischen Breite und
langfristig mit dem 11-jährigen Sonnenzyklus."
"Diese natürliche Neutronenstrahlung verursacht einen wesentlichen Beitrag der Strahlenbelastung in Flughöhen. Auf dem Erdboden ist ihr Anteil zwar gering; weniger als 10% der Äquivalentdosis wird hier durch Neutronen verursacht."
"Trotzdem sind Verfahren für die Messung dieser geringen Dosisleistung von Interesse, um zum Beispiel in der Umgebung von kerntechnischen Anlagen (Kernkraftwerke, Zwischenlager für Brennelemente) erkennen zu können, ob Neutronenstrahlung von diesen Anlagen ausgeht. Herkömmliche Ortsdosisleistungs-Messgeräte sind für diese Messaufgabe auf Grund ihrer geringen Empfindlichkeiten nicht geeignet."
"Die Eignung des PTB-Spektrometers für die Messung von sehr kleinen Flussdichten und Dosisleistungen wurde mit Hilfe von Messungen auf dem PTB-Gelände (70 m Höhe über dem Meeresspiegel) überprüft."
"Zwischen Dezember 1999 und Januar 2000 ergab sich eine mittlere Neutronenflussdichte von 46 cm-2 h-1. Aus der gemessenen Energieverteilung und den empfohlenen Fluenz-zu-Äquivalentdosis Konversionsfaktoren ergibt sich daraus eine mittlere Äquivalentdosisleistung von 9.3 nSv h-1 (0.081 mSv/a)".
"Es hat sich gezeigt, dass bei sorgfältiger Charakterisierung des Spektrometers und Prüfung der Messergebnisse diese geringen Flussdichten und Dosisleistungen bestimmt werden können. Einzelheiten zu diesen Messungen finden Sie auf der weiterführenden Seite".
You are made up of chemicals, and it
should be of no surprise that some of them are radionuclides, many of which
you ingest daily in your water and food. Here are the estimated concentrations
of radionuclides calculated for a 70,000 gram adult based ICRP 30 data:
From cosmic radiation (high energy γ-rays,
Q
= 1) in the U.S. the average person will receive a dose of 27 mrem per
year and this roughly doubles
every 6,000 foot increase in elevation.
Ben D. Spycher1, Judith E. Lupatsch1, Marcel Zwahlen1 et al.
1Institute of Social and Preventive Medicine (ISPM), University of Bern, Bern, Switzerland; 2Swiss Tropical and Public Health Institute, Basel, Switzerland; 3University of Basel, Basel, Switzerland; 4Department of Oncology, University Children's Hospital Zurich, Zurich, Switzerland; 5Department of Oncology/Hematology, Children's Hospital, Cantonal Hospital Lucerne, Lucerne, Switzerland
Environ Health Perspect. 2015 Jun; 123(6): 622Ð628.
(in cache)
click on figure to enlarge Table 4
Hazard ratios for childhood cancer per mSv cumulative dose of external radiation in the Swiss National Cohort.
Abbreviations:
ALL, acute lymphoblastic leukemia;
CNS, central nervous system;
HR, hazard ratio.
a Children with same residence 5 years before entry into the cohort or, if this information was lacking, lived in the same municipality at birth.
b From conditional logistic regression in nested caseÐcontrol sample (equivalent to Cox proportional hazards regression) adjusting for sex and birth year.
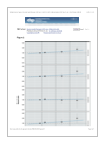
click on figures to enlarge Fig. 2
Hazard ratios for cancer by dose rate of external ionizing radiation among children < 16 years of age in the Swiss National Cohort. Results from Cox proportional hazards models adjusting for sex and birth year using a categorized exposure [points and bars (95% CIs) placed along the x-axis at mean dose rates within categories; categories delineated by vertical lines] and a linear exposure term (blue line). Dose rates < 100 nSv/hr are the reference category.
"Fundamental aim of the International Commission on Radiological Protection (ICRP) set out in the 1990 Recommendations (1990 Recommendations of the International Commission on Radiological Protection. ICRP Publication 60. Annals of the ICRP 21, 1-3, Elsevier, April 1991):
The primary aim of radiological protection is to provide an appropriate
standard of protection for man without unduly limiting the beneficial actions
giving rise to radiation exposure.
This aim cannot be achieved on the basis of scientific concepts alone. All those concerned with radiological protection have to make value judgements about the relative importance of different kinds of risk and about the balancing of risks and benefits. In this, they are no different from those working in other fields concerned with the control of hazards."
COUNCIL DIRECTIVE 96/29/EURATOM
of 13 May 1996
laying down basic safety standards for the protection of the health of workers and the general public against the dangers arising from ionizing
radiation
"Member States shall ensure that all new classes or types of practice resulting in exposure to ionizing radiation are justified
in advance of being first adopted or first approved by their economic, social or other benefits in relation to the health detriment they may cause."
"Epidemiological studies have not demonstrated adverse health effects in individuals exposed to small doses (less than 10 rem) delivered in a period of many years."
J. Radiol. Prot. 1999 Vol. 19, No 2, 107-115 (in cache)
Roger Clarke became Chairman of ICRP in 1993 and is presently (as of January 2005) serving his third term of office. He retired as National Radiological Protection Board Director in June 2003 after 16 years as Director (Source: Health Protection Agency, NRPB Press Releases, Archive for 2005, New Year Honour for Former NRPB Director, 17 January 2005
A Controllable Dose is the dose or the sum of the doses to an individual from a particular source that can reasonably be controlled by whatever means.
THE PRINCIPLE
The protection philosophy for controllable dose is based on the individual. If the individual is sufficiently protected from a single source, then that is a sufficient criterion for the control of the source.
[Contrary to that] This new approach is a totally individual source-related criterion. The principle is
age- and sex-averaged tissue weighting factors, based on updated risk data and intended to apply as rounded values to a population of both sexes and all ages. Eff�ective dose is calculated for a Reference Person and not for an individual.
[Contrary to that] This new approach is a totally individual source-related criterion. The principle is
If the risk of harm to the health of the most exposed individual is trivial, then the total risk is trivial - irrespective of how many people are exposed.
The principle of individual source-related protection was recognised by ICRP in ICRP Publication 60 with the introduction of the concept of a constraint on the optimisation process.
CONTROLLABLE DOSE
Fatal Risk
(deaths/(persons year))
Dose
Proposed System
Current Criteria
10-3
30 mSv
Dose should not exceed this level - approach only if there is benefit to individual or dose is
difficult to reduce or prevent
Occupational Dose Limit
Upper Radon Action Level
Relocation Intervention Level
CT Scan
10-4
3 mSv in a year
There may be a need to reduce or prevent doses, particularly if no benefit to individual
Lower Intervention Level for Shelter, KI-tablets
Lower Radon Action Level
Average Background
Diagnostic Levels
10-5
0.3 mSv in a year
Maximum dose to individual who receives no direct benefit from one source of radiation
INTERNATIONAL ATOMIC ENERGY AGENCY, "Clearance levels for radionuclides in solid materials: Application of exemption principles", Interim report for comment, IAEA-TECDOC-8S5, 1996
INTERNATIONAL GUIDANCE ON EXEMPTION AND CLEARANCE PRINCIPLES
207. There are two main approaches that can be considered indeciding whether a level of dose is trivial:
to choose a level of risk and a corresponding dose which have no significant effect as regards individuals; and
to use the exposure to natural background radiation, to the extent that it is normal and unavoidable, as a relevant reference level.
In Ref.[3] these approaches are evaluated and it is concluded that for the purpose of exemption a level of individual dose of some tens of microsieverts in a year can reasonably be regarded as trivial.
208. Because an individual may be exposed to radiation from several exempted practices,it is necessary to ensure that the total dose does not rise above the trivial dose level. It is therefore recommended that each exempt practice should contribute only apart of the identified trivial dose [3]. The apportionment suggested could lead to individual doses to average members of the critical group of the order of 10 μSv/a from each exempt practice [3]. The value of 10 μSv/a is used in this report as the basis for evaluating unconditional clearance levels.
(Unless otherwise stated,theterm 'dose' refers to the sum of the effective dose from external exposure in a given period and the committed effective dose from radionuclides taken into the body in the same period.)
[3] INTERNATIONAL ATOMIC ENERGY AGENCY, Principles for the Exemption of Radiation Sources and Practices from Regulatory Control, Safety Series No. 89, IAEA, Vienna (1988).
Die Strahlenschutzverordnung enthält keine Kriterien, mit denen der Schutz zukünftiger Ge- nerationen und der Umwelt vor ionisierender Strahlung zu bewerten ist. Bei einem unter Beachtung dieser Sicherheitsanforderungen geplanten, errichteten, betriebenen und stillgelegten Endlager werden alle wesentlichen Maßnahmen getroffen, um nachfolgende Generationen und die Umwelt vor Schäden durch ionisierende Strahlen zu schützen, so dass weitergehende Nachweise von daher grundsätzlich entfallen können. International besteht Einvernehmen, dass berechnete oder abgeschätzte Risiken oder Dosen in dieser Phase nur als Indikatoren für das mit der Endlagerung zu erzielende Schutzniveau interpretiert werden dürfen. Für diese Indikatoren gelten folgende Bewertungskriterien.
6.1 Maßgeblich für den Schutz vor Schäden durch ionisierende Strahlen in der Nachverschlussphase ist die Integrität des einschlusswirksamen Gebirgsbereichs. Die radioaktiven Abfälle müssen in diesem Gebirgsbereich so eingeschlossen sein, dass sie dort verbleiben und allenfalls geringfügige Stoffmengen diesen Gebirgsbereich verlassen können. Zusätzliche Strahlenexpositionen sollen nur in einem begrenzten Gebiet auftreten können, so dass möglichst wenige Personen einer Generation betroffen sein können.
6.2 Für die Nachverschlussphase ist nachzuweisen, dass für wahrscheinliche Entwicklungen durch Freisetzung von Radionukliden, die aus den eingelagerten radioaktiven Abfällen stammen, für Einzelpersonen der Bevölkerung nur eine zusätzliche effektive Dosis im Bereich von 10 μSv/Jahr (in Anlehnung an ICRP 104 (triviale Dosis)) auftreten kann. Dabei sind Einzelpersonen mit einer heutigen Lebenserwartung, die während der gesamten Lebenszeit exponiert werden, zu betrachten.
6.3 Für weniger wahrscheinliche Entwicklungen in der Nachverschlussphase ist nachzuweisen, dass die durch Freisetzung von Radionukliden, die aus den eingelagerten radioaktiven Abfällen stammen, verursachte zusätzliche effektive Dosis für die dadurch betroffenen Menschen 0,1 mSv/Jahr nicht überschreitet (in Anlehnung an ICRP 81 (Risiko kleiner 10-5/a)). Dabei sind ebenfalls Einzelpersonen mit einer heutigen Lebenserwartung, die während der gesamten Lebenszeit exponiert werden, zu betrachten.
Für derartige Entwicklungen sind höhere Freisetzungen radioaktiver Stoffe zulässig, da das Eintreten solcher Entwicklungen eine geringere Wahrscheinlichkeit aufweist.
Wahrscheinliche Entwicklungen sind die für diesen Standort prognostizierten normalen Entwicklungen und für vergleichbare Standorte oder ähnliche geologische Situationen normalerweise beobachtete Entwicklungen. Dabei ist für die technischen Komponenten des Endlagers die als normal prognostizierte Entwicklung ihrer Eigenschaften zugrunde zu legen. Falls eine quantitative Angabe zur Eintrittswahrscheinlichkeit einer bestimmten Entwicklung möglich ist, und ihre Eintrittswahrscheinlichkeit bezogen auf den Nachweiszeitraum mindestens 10 % beträgt, gilt diese als wahrscheinliche Entwicklung.
Weniger wahrscheinliche Entwicklungen sind solche, die für diesen Standort unter ungünstigen geologischen oder klimatischen Annahmen eintreten können und die bei vergleichbaren Standorten oder vergleichbaren geologischen Situationen selten aufgetreten sind. Für die technischen Komponenten des Endlagers ist dabei eine als normal prognostizierte Entwicklung ihrer Eigenschaften bei Eintreten der jeweiligen geologischen Entwicklung zugrunde zu legen. Außerdem sind auch von der normalen Entwicklung abweichende ungünstige Entwicklungen der Eigenschaften der technischen Komponenten zu untersuchen. Rückwirkungen auf das geologische Umfeld sind zu betrachten. Abgesehen von diesen Rückwirkungen sind dabei die jeweilig erwarteten geologischen Entwicklungen zu berücksichtigen. Innerhalb einer derartigen Entwicklung ist das gleichzeitige Auftreten mehrerer unabhängiger Fehler nicht zu unterstellen. Falls eine quantitative Angabe zur Wahrscheinlichkeit einer bestimmten Entwicklung oder einer ungünstigen Entwicklung der Eigenschaften einer technischen Kompo-nente möglich ist, sind diese hier zu betrachten, wenn diese Wahrscheinlichkeit bezogen auf den Nachweiszeitraum mindestens 1 % beträgt.
fatal cancer risk which will be of the order of 10-3 (1 in 1000) per year
Thus, the highest dose that will normally be tolerated before control is definitely instituted is in the range of a few tens of millisieverts (a few rems) although this may be tolerated in successive years.
This covers:
The permanent relocation of people following an accident is recommended to avert a dose of 1 Sv (100 rem) in a lifetime,
which corresponds to some 10s of mSv (several rem) in the first year,
The occupational dose limit of 20 mSv (2 rem) in a year,
The upper (justified) action level for radon in homes (10 mSv (1 rem) per year),
The lower level of averted dose above which evacuation is recommended after an accident (50 mSv = 5 rem), and
A CT scan (~few 10s of mSv (some few rems), 5 - 50 mGy per organ.
Results
60 674 cancers were recorded, including 3150 in 680 211 people exposed to a CT scan at least one year before any cancer diagnosis.
The mean duration of follow-up after exposure was 9.5 years.
The IRR increased significantly for many types of
solid cancer
digestive organs,
melanoma,
soft tissue,
female genital,
urinary tract,
brain, and
thyroid
leukaemia,
myelodysplasia, and
some other lymphoid cancers.
There was an excess of 608 cancers in people exposed to CT scans
147 brain,
356 other solid,
48 leukaemia or myelodysplasia, and
57 other lymphoid.
What is already known on this topic
CT scanning rates have risen substantially since the 1980s. Although large doses of ionising radiation are known to cause cancer, there is uncertainty about the risks following the lower doses from CT scans (5-50 mGy per organ)
A recent study of 180 000 young people exposed to CT scans in the United Kingdom found an increasing risk of leukaemia and brain cancer with increasing radiation dose
What this study adds
Among 680 000 Australians exposed to a CT scan when aged 0-19 years, cancer incidence was increased by 24% (95% confidence interval 20% to 29%) compared with the incidence in over 10 million unexposed people.
The proportional increase in risk was evident at short intervals after exposure and was greater for persons exposed at younger ages
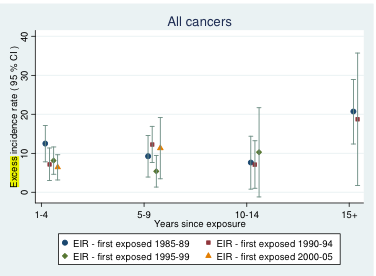
Source: Web Appendix
Web figure C. Absolute excess incidence rates per 100,000 person-years in exposed persons, for selected cancers by years since exposure and calendar period of first exposure, based on a 1 year lag period.
Among 680 000 Australians exposed to a CT scan when aged 0-19 years, cancer incidence was increased by 24% (95% confidence interval 20% to 29%) compared with the incidence in over 10 million unexposed people (incidence rate ratio, IRR) 1.24 (95% confidence interval 1.20 to 1.29); P<0.001).
We saw a dose-response relation, and the IRR increased by 0.16 (0.13 to 0.19) for each additional CT scan.
The IRR was greater after exposure at younger ages (P<0.001 for trend).
At
1-4: 1.35 (1.25 to 1.45),
5-9: 1.25 (1.17 to 1.34),
10-14: 1.14 (1.06 to 1.22), and
15 or more years: 1.24 (1.14 to 1.34)
since first exposure.
The absolute excess incidence rate for all cancers combined was 9.38 per 100 000 person years at risk, as of 31 December 2007. The average effective radiation dose per scan was estimated as 4.5 mSv.
The proportional increase in risk was evident at short intervals after exposure and was greater for persons exposed at younger ages
By 31 December 2007, with an average follow-up of 9.5 years after exposure, the absolute excess cancer incidence rate was 9.38 per 100 000 person years at risk
Incidence rates were increased for most individual types of solid cancer, and for leukaemias, myelodysplasias, and some other lymphoid cancers.
Definitions:
With x = in exposed population ("persons at risk"), nx = in unexposed population incidence rate ratio IRR = (#cancers/person years)x /(#cancers/person years)nx excess incidence rate EIR = (IRR - 1)/IRR #cancersx / (person years)x
While these levels of dose to the individual can hardly be called unacceptable, they are levels at which questions should
be asked as to whether the dose and associated fatal cancer risk which will be of the order of 10-3 (1 in 1000) per year, can be avoided by some sort of action. That action may be disruptive, or, as in the case of a CT scan, be simply to question whether the required information can be obtained by another means involving lower dose.
Controllable doses should not generally exceed this level and actual or potential doses approaching this level would only
be allowed if the individual receives a benefit or the doses cannot be reduced or prevented without significant disruption to lifestyle.
fatal cancer risk which will be of the order of 10-4 (1 in 10 000) per year
At levels of controllable dose of the order of a few millisieverts (a few 100 mrem) per year, the exposures should not be of great concern from the point of view of an individual's health. Natural background radiation is about 2-3 mSv (200 - 300 mrem) in a year, and even if radon exposures are excluded, the figure is 1-2 mSv (100 - 200 mrem).
The exposures covered would be:
the lower level of optimized range for radon intervention (3 mSv),
the lower level for simple countermeasures (sheltering, KI) in an accident (5 mSv),
the existing dose limit for members of the pubic (1 mSv), and
simple diagnostic x-ray examinations (1 mSv)
Steps may be taken to reduce these exposures, or to prevent them, particularly if the individual receives no benefit. Thus from a
controllable dose of a few millisieverts upwards it becomes increasingly desirable to reduce or prevent the dose depending both on the practicability of doing so and whether the individual is deriving any tangible benefit from the exposure, e.g. annual occupational exposures (50 mSv, in cache) or medical examination doses. The associated levels of fatal cancer risk would be 10-4, 1 in 10,000 (per year).
fatal cancer risk which will be of the order of 10-5 (1 in 100 000) per year Doses that are below the millisievert (100 mrem) level are also relevant in the control of exposures. In connection with manmade uses of radiation, the Commission has set the maximum dose from a single new source to a member of the public at 0.3 mSv a year. The associated level of fatal cancer risk is about 10-5 per year. This level of dose is about 10% of total natural background dose and is also of the same order as to variation in background radiation (excluding the radon contribution) over much of the world.
fatal cancer risk which will be of the order of 10-6 (1 in 1000 000) per year
A level of risk of death of 10-6 per year is commonly regarded as trivial and the corresponding annual dose of about 0.01 - 0.02 mSv (1 - 2 mrem) has been used to set exemption criteria for the Basic Safety Standards. At this level of dose there should be no need to consider protection of the individual.
ICRP Publication 103
The 2007 Recommendations of the International Commission on Radiological Protection
(a) On 21 March 2007, the Main Commission of the International Commission on
Radiological Protection (ICRP) approved these revised Recommendations for a System of Radiological Protection which formally replace the previous Recommendations issued in 1991 as Publication 60 (ICRP, 1991b) and update the additional
guidance on the control of exposure from radiation sources issued since Publication
60. These revised Recommendations consolidate and develop the previous Recommendations and guidance.
(i) An important change is that doses from external and internal sources will be
calculated using reference computational phantoms of the human body based on
medical tomographic images, replacing the use of various mathematical models.
For adults, equivalent doses will be calculated by sex-averaging of values obtained
using male and female phantoms. Effective dose will then be calculated using revised age- and sex-averaged tissue weighting factors, based on updated risk data and intended to apply as rounded values to a population of both sexes and all ages. Eff�ective dose is calculated for a Reference Person and not for an individual.
(j) Effective dose is intended for use as a protection quantity. The main uses of
e�ective dose are the prospective dose assessment for planning and optimisation in
radiological protection, and demonstration of compliance with dose limits for regulatory purposes. Effective dose is not recommended for epidemiological evaluations,
nor should it be used for detailed specific retrospective investigations of individual
exposure and risk.
(k) The collective e�ffective dose quantity is an instrument for optimisation, for
comparing radiological technologies and protection procedures, predominantly in
the context of occupational exposure. Collective e�ffective dose is not intended as
a tool for epidemiological risk assessment, and it is inappropriate to use it in risk
projections. The aggregation of very low individual doses over extended time periods is inappropriate, and in particular, the calculation of the number of cancer
deaths based on collective e�ffective doses from trivial individual doses should be
avoided.
(l) In order to assess radiation doses, models are necessary to simulate the geometry of the external exposure, the biokinetics of incorporated radionuclides, and the
human body. The reference models and necessary reference parameter values are
established and selected from a range of experimental investigations and human
studies through judgements. For regulatory purposes, these models and parameter
values are fixed by convention and are not subject to uncertainty. The Commission
is aware of uncertainties and lack of precision of the models and parameter values.
Eff�orts are undertaken to critically evaluate and to reduce the uncertainties. For individual retrospective dose and risk assessments, individual parameters and uncertainties have to be taken into account.
(m) The Commission's process of consolidation of previous guidance and recommendations has indicated that some changes to the structure and terminology of the
system of protection were desirable in order to improve clarity and utility. In particular the distinction between practices and interventions may not have been clearly
understood in the wider radiological protection community. Additionally, there were
exposure situations which were di�cult to categorise in this manner.
(n) The Commission now recognises 3 types of exposure situations which replace the previous categorisation into practices and interventions. These 3 exposure situations are intended to cover the entire range of exposure situations. The
3 situations are:
�
Planned exposure situations, which are situations involving the planned introduction and operation of sources. (This type of exposure situation includes situations
that were previously categorised as practices.)
�
Emergency exposure situations, which are unexpected situations such as those that
may occur during the operation of a planned situation, or from a malicious act,
requiring urgent attention.
�
Existing exposure situations, which are exposure situations that already exist when
a decision on control has to be taken, such as those caused by natural background
radiation.
(o) The 3 key principles of radiological protection are retained in the revised
Recommendations. The principles of justification and optimisation apply in all three
exposure situations whereas the principle of application of dose limits applies only for
doses expected to be incurred with certainty as a result of planned exposure situations. These principles are defined as follows:
The Principle of Justification: Any decision that alters the radiation exposure situation should do more good than harm.
�
The Principle of Optimisation of Protection: The likelihood of incurring exposure,
the number of people exposed, and the magnitude of their individual doses should
all be kept as low as reasonably achievable, taking into account economic and
societal factors.
�
The Principle of Application of Dose Limits: The total dose to any individual from
regulated sources in planned exposure situations other than medical exposure of
patients should not exceed the appropriate limits specified by the Commission.
The Commission continues to distinguish amongst 3 categories of exposure:
occupational exposures,
public exposures, and
medical exposures of patients (and
comforters, carers, and volunteers in research).
If a female worker has declared that
she is pregnant, additional controls have to be considered in order to attain a level of
protection for the embryo/fetus broadly similar to that provided for members of the
public.
(p) The revised Recommendations emphasise the key role of the principle of optimisation. This principle should be applied in the same manner in all exposure situations. Restrictions are applied to doses to a nominal individual (the Reference
Person), namely dose constraints for planned exposure situations and reference levels
for emergency and existing exposure situations. Options resulting in doses greater in
magnitude than such restrictions should be rejected at the planning stage. Importantly, these restrictions on doses are applied prospectively, as with optimisation
as a whole. If, following the implementation of an optimised protection strategy,
it is subsequently shown that the value of the constraint or reference level is exceeded, the reasons should be investigated but this fact alone should not necessarily
prompt regulatory action. The Commission expects that this emphasis on a common
approach to radiological protection in all exposure situations will aid application of
the Commission's Recommendations in the various circumstances of radiation
exposure.
(q) The relevant national authorities will often play a major role in selecting values
for dose constraints and reference levels. Guidance on the selection process is provided in the revised Recommendations. This guidance takes account of numerical
recommendations made previously by the Commission.
(r) Planned exposure situations encompass sources and situations that have been
appropriately managed within the Commission's previous Recommendations for ...
In setting the Max. Conc. Limits
for man-made beta and photon emitters, EPA used cancer risk estimates from
the BEIR I report for the U.S. population in the year 1967 (NAS, 1972).
For an exposed group having the same age distribution as the U.S. 1967
population, the BEIR I report indicated that the individual risk of a fatal
cancer from a lifetime total body dose rate of 4 mrem per year ranged from
about 0.4 to 2 x 10⁻⁶ per year depending on whether an absolute or relative
risk model was used. Using best estimates from both models for fatal cancer,
EPA believed that an individual risk of
0.8 x 10⁻⁶per year resulting
from a 4 mrem annual total body dose
was a reasonable estimate of the annual
risk from a lifetime ingestion of drinking water.
Somatic effect means a health
effect on an exposed body. With regard to ionizing radiation,
somatic effects mainly refer to
cancers and leukemias (USEPA, 1981).
Stochastic effects means effects
for which the probability of occurrence is proportional to dose,
but not the severity of effect,
and it is assumed that there is no threshold below which they do not
occur (WHO, 1993).
Non-stochastic describes effects
whose severity is a function of dose; for these, a threshold may
occur. Examples of non-stochastic
somatic effects are cataract induction, nonmalignant damage
to the skin, hematological deficiencies,
and impairment of fertility (NIH, 1994). Non-stochastic
may also be referred to as deterministic
effects.
Stochastic means random events
leading to effects whose probability of occurrence in a exposed
population (rather than severity
in an affected individual) is a direct function of dose; these effects
are commonly regarded as having
no threshold; heredity effects are regarded as being stochastic;
some somatic effects, especially
carcinogens, are regarded as being stochastic (NIH, 1994).
End Points for Spent Nuclear Fuel and High-Level Radioactive Waste in Russia and the United States
Committee on End Points for Spent Nuclear Fuel and High-Level Radioactive Waste in Russia and the United States,
Office for Central Europe and Eurasia Development, Security, and Cooperation, National Research Council
ISBN: 0-309-50718-9, 154 pages, 6 x 9, (2003)
This free PDF was downloaded from http://www.nap.edu/catalog/10667.html to this address.
Zum Vergrößern auf Bild klicken
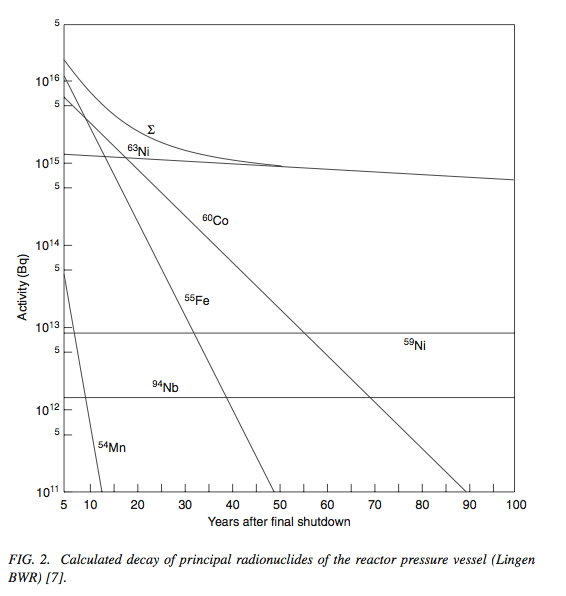
Quelle: Fig. 2 in "Radiological Characterization of Shut Down Nuclear Reactors for Decommissioning Purposes", TECHNICAL REPORTS SERIES No. 389, IAEA, Vienna, 1998 (im Cache)
FIG. 2. Calculated decay of principal radionuclides of the reactor pressure vessel (Lingen BWR, INTERNATIONAL ATOMIC ENERGY AGENCY, Safe Enclosure of Shut Down Nuclear Installations, Technical Reports Series No. 375, IAEA, Vienna, 1995).
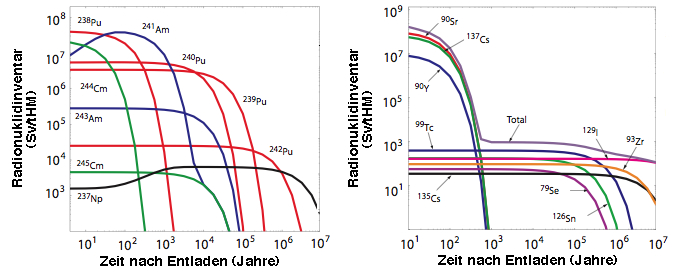
Abbildung: Radionuklidinventar pro tHM in abgebrannten Brennelementen eines LWR, ausgedrückt als effektive Strahlendosis, gemessen in Sievert (Sv), links: Transurane, rechts: Spaltprodukte. Von Brennelementen erzeugte thermische Energie ("Abbrand"): 41.2 GW Tage pro tHM.
Ten years after removal of
spent fuel from a reactor, the radiation dose 1 meter away from a typical spent fuel assembly exceeds 20,000 rems per hour. A dose of 5,000 rems would be expected to cause immediate incapacitation and death within one week. Source: "Radioactive Waste: Production, Storage, Disposal", U.S. Nuclear Regulatory Commission, NUREG/BR-0216, Revision 2, May 2002 (in cache)
By "dose to the population", we assume you mean dose to individuals who are continuously exposed to these indoor airborne concentrations in the home.
The radiation dose from inhalation of radon and thoron and their daughter products can be expressed several ways, including (a) absorbed dose to the irradiated long tissue (primarily the bronchial epithelium), (b) average absorbed dose to the whole lung, (c) dose equivalent (or equivalent dose) to the whole lung, or (d) effective dose (i.e., the average uniform whole-body dose that is estimated to represent the same risk as the actual partial-body irradiation). For this answer, we will assume that you are interested in the effective dose.
DOSES TO INDIVIDUALS
You give three different sets of measurements that might be used for estimating dose to an individual in the measured location from airborne radon and thoron and their daughter products:
A set of radon and thoron concentrations (in Bq m-3),
The potential alpha energy concentration (PAEC) of the airborne daughter products, (in mWL) Ð presumably the combined value for radon and thoron, and
A pair of separate radon-daughter and thoron-daughter PAECs (in mWL) from air sampling -- presumably for the same location as for measurement sets 1 and 2.
The dose is primarily from the radon and decay products and, thus, the PAEC measurements are the ones most directly related to dose; however, it is often more expeditious to make measurements of the precursor radon gas, and thus, with the application of additional factors or assumptions, dose can also be estimated from airborne radon and thoron concentrations.
The relationship between airborne concentration of radon, thoron, and/or radon and thoron decay products and the associated radiation dose is affected by a number of factors, the dosimetry continues to be reviewed, and as yet there is not complete unanimity as to the appropriate conversion factors. For the purpose of this response we will use some published values as examples.
Alternative 1: Calculating Effective Dose from radon and thoron gas concentrations.
Given: Radon = 75 Bq m-3 Thoron = 150 Bq m-3
The 1993 report of UNSCEAR (the United Nations Scientific Committee on the Effects of Atomic Radiation), "Sources and Effects of Ionizing Radiation," uses a radon conversion factor of 25 µSv y-1 per Bq m-3 for an indoor occupancy factor of 0.8 or about 7,000 h y-1). From the same report a thoron conversion factor of 25 µSv y-1 per Bq m-3 it can be inferred for the same occupancy conditions.
Effective dose = (75 x 25) +(150 x 22) = 5,175 µSv y-1 or 5.2 mSv y-1.
Alternative 2: Calculating Effective Dose from radon plus thoron PAEC. Given: PAEC =20 mWL.
For this case we need a PAEC-to-dose conversion factor. Factors have been published for estimating effective dose from the cumulative exposure in WLM (working level months), where a WLM is exposure to one WL for 170 h. Usually an occupancy factor of 0.7 for the home is assumed, and thus for 1 year in a home with 1 WL, the exposure in WLM is (365 x 24 x 0.7/170) = 36 WLM.
We are not aware of a published single factor for radon daughters and thoron daughters combined. The ICRP (International Commission on Radiological Protection), in its Publication 65, "Protection Against Radon-222 at Home and at Work" (1993), presents a radon daughter dose coefficient for members of the public of 3.9 mSv per WLM. ICRP 65 does not give a dose coefficient for thoron, but ICRP Publication 32, "Limits for Inhalation of Radon Daughters by Workers" (1981), gives an effective dose equivalent of 3.4 mSv per WLM of thoron daughters. These two reports are based on different dosimetry models and the two conversion factors are not necessarily directly comparable. However, in the absence of an alternative, let us use the ICRP thoron values for the purpose of making an estimate. The values for radon daughters and thoron daughters are not greatly different, and thus for an estimate for the radon-thoron aggregate we will use an average value of 3.6 mSv per WLM.
This gives a dose estimate for radon daughters +thoron daughters at 20 mWL:
0.020 WL x 36 WLM/WL-y x 3.6 mSv WLM-1 = 2.6 mSv y-1.
Alternative 3: Calculating Effective Dose from radon PAEC and thoron PAEC. Given: Radon daughter PAEC = 5 mWL; Thoron daughter PAEC = 10 mWL.
Effective dose equivalent estimates then are:
Radon daughters at 5 mWL:
0.005 WL x 36 WLM/WL-y x 3.9 mSv WLM-1 = 0.70 mSv y-1.
Thoron daughters at 10 mWL:
0.010 WL x 36 WLM/WL-y x 3.4 mSv/WLM = 1.22 mSv y-1.
Radon daughters + Thoron daughters: 1.9 mSv y-1.
Comment on the Three Alternative Estimates. The three estimates, 5.2, 2.6, and 1.9 mSv y-1 are different but of the same order of magnitude. Differences probably reflect differences in precision and accuracy of the three measurement methods, the uncertainties in the three difference calculational methods, and differences in dose conversion conventions developed and published at different times by different groups.
POPULATION DOSE
If all the individuals in the population of interest are exposed to the same concentrations, then the estimates of individual dose represent the average dose rate (mSv y-1) for members of the population and the population dose (person-Sv) is the average dose times the number of persons in the population.
If different subgroups of the population are exposed to different concentrations (and hence receive different average doses), then a calculation should be made of the typical individual dose for each population group. The average dose for the whole population is the person-weighted average across all groups and total population dose (person-Sv) is the sum of the population doses for the individual subgroups.
Subpart C - Environmental Standards for Ground-Water Protection
§ 191.13 Containment requirements.
(a) Disposal systems for spent nuclear fuel or high-level or transuranic radioactive wastes shall be designed to provide a reasonable expectation, based upon performance assessments, that the cumulative releases of radionuclides to the accessible environment for 10,000 years after disposal from all significant processes and events that may affect the disposal system shall:
(1) Have a likelihood of less than one chance in 10 of exceeding the quantities calculated according to Table 1 (appendix A); and
(2) Have a likelihood of less than one chance in 1,000 of exceeding ten times the quantities calculated according to Table 1 (appendix A).
(b) Performance assessments need not provide complete assurance that the requirements of §191.13(a) will be met. Because of the long time period involved and the nature of the events and processes of interest, there will inevitably be substantial uncertainties in projecting disposal system performance. Proof of the future performance of a disposal system is not to be had in the ordinary sense of the word in situations that deal with much shorter time frames. Instead, what is required is a reasonable expectation, on the basis of the record before the implementing agency, that compliance with §191.13 (a) will be achieved.
Table 1—Release Limits for Containment Requirements
[Cumulative releases to the accessible environment for 10,000 years after disposal]
Radionuclide
Release limit per 1,000 MTHM or other unit of waste (see notes) (curies)
Any other alpha-emitting radionuclide with a half-life greater than 20 years
100
Any other radionuclide with a half-life greater than 20 years that does not emit alpha particles
1,000
2.55 Application of Table 1
Note 1:
Units of Waste. The Release Limits in Table 1 apply to the amount of wastes in any one of the following:
(a) An amount of spent nuclear fuel containing 1,000 metric tons of heavy metal (MTHM) exposed to a burnup between 25,000 megawatt-days per metric ton of heavy metal (MWd/MTHM) and 40,000 MWd/MTHM;
(b) The high-level radioactive wastes generated from reprocessing each 1,000 MTHM exposed to a burnup between 25,000 MWd/MTHM and 40,000 MWd/MTHM;
(c) Each 100,000,000 curies of gamma or beta-emitting radionuclides with half-lives greater than 20 years but less than 100 years (for use as discussed in Note 5 or with materials that are identified by the Commission as high-level radioactive waste in accordance with part B of the definition of high-level waste in the NWPA);
(d) Each 1,000,000 curies of other radionuclides (i.e., gamma or beta-emitters with half-lives greater than 100 years or any alpha-emitters with half-lives greater than 20 years) (for use as discussed in Note 5 or with materials that are identified by the Commission as high-level radioactive waste in accordance with part B of the definition of high-level waste in the NWPA); or
(e) An amount of transuranic (TRU) wastes containing one million curies of alpha-emitting transuranic radionuclides with half-lives greater than 20 years.
Note 2:
Release Limits for Specific Disposal Systems. To develop Release Limits for a particular disposal system, the quantities in Table 1 shall be adjusted for the amount of waste included in the disposal system compared to the various units of waste defined in Note 1. For example:
(a) If a particular disposal system contained the high-level wastes from 50,000 MTHM, the Release Limits for that system would be the quantities in Table 1 multiplied by 50 (50,000 MTHM divided by 1,000 MTHM).
(b) If a particular disposal system contained three million curies of alpha-emitting transuranic wastes, the Release Limits for that system would be the quantities in Table 1 multiplied by three (three million curies divided by one million curies).
(c) If a particular disposal system contained both the high-level wastes from 50,000 MTHM and 5 million curies of alpha-emitting transuranic wastes, the Release Limits for that system would be the quantities in Table 1 multiplied by 55:
Note 3: Adjustments for Reactor Fuels with Different Burnup. For disposal systems containing reactor fuels (or the high-level wastes from reactor fuels) exposed to an average burnup of less than 25,000 MWd/MTHM or greater than 40,000 MWd/MTHM, the units of waste defined in (a) and (b) of Note 1 shall be adjusted. The unit shall be multiplied by the ratio of 30,000 MWd/MTHM divided by the fuel's actual average burnup, except that a value of 5,000 MWd/MTHM may be used when the average fuel burnup is below 5,000 MWd/MTHM and a value of 100,000 MWd/MTHM shall be used when the average fuel burnup is above 100,000 MWd/MTHM. This adjusted unit of waste shall then be used in determining the Release Limits for the disposal system.
For example, if a particular disposal system contained only high-level wastes with an average burnup of 3,000 MWd/MTHM, the unit of waste for that disposal system would be:
1000 MTHM x 30 000/(5000) = 6000 MTHM
<
If that disposal system contained the high-level wastes from 60,000 MTHM (with an average burnup of 3,000 MWd/MTHM), then the Release Limits for that system would be the quantities in Table 1 multiplied by ten:
Note 4: Treatment of Fractionated High-Level Wastes. In some cases, a high-level waste stream from reprocessing spent nuclear fuel may have been (or will be) separated into two or more high-level waste components destined for different disposal systems. In such cases, the implementing agency may allocate the Release Limit multiplier (based upon the original MTHM and the average fuel burnup of the high-level waste stream) among the various disposal systems as it chooses, provided that the total Release Limit multiplier used for that waste stream at all of its disposal systems may not exceed the Release Limit multiplier that would be used if the entire waste stream were disposed of in one disposal system.
Note 5: Treatment of Wastes with Poorly Known Burnups or Original MTHM. In some cases, the records associated with particular high-level waste streams may not be adequate to accurately determine the original metric tons of heavy metal in the reactor fuel that created the waste, or to determine the average burnup that the fuel was exposed to. If the uncertainties are such that the original amount of heavy metal or the average fuel burnup for particular high-level waste streams cannot be quantified, the units of waste derived from (a) and (b) of Note 1 shall no longer be used. Instead, the units of waste defined in (c) and (d) of Note 1 shall be used for such high-level waste streams. If the uncertainties in such information allow a range of values to be associated with the original amount of heavy metal or the average fuel burnup, then the calculations described in previous Notes will be conducted using the values that result in the smallest Release Limits, except that the Release Limits need not be smaller than those that would be calculated using the units of waste defined in (c) and (d) of Note 1.
Note 6: Uses of Release Limits to Determine Compliance with §191.13 Once release limits for a particular disposal system have been determined in accordance with Notes 1 through 5, these release limits shall be used to determine compliance with the requirements of §191.13 as follows. In cases where a mixture of radionuclides is projected to be released to the accessible environment, the limiting values shall be determined as follows: For each radionuclide in the mixture, determine the ratio between the cumulative release quantity projected over 10,000 years and the limit for that radionuclide as determined from Table 1 and Notes 1 through 5. The sum of such ratios for all the radionuclides in the mixture may not exceed one with regard to §191.13(a)(1) and may not exceed ten with regard to §191.13(a)(2).
For example, if radionuclides A, B, and C are projected to be released in amounts Qa, Qb, and Qc, and if the applicable Release Limits are RLa, RLb, and RLc, then the cumulative releases over 10,000 years shall be limited so that the following relationship exists:
Qa/RLa + Qb/RLb + Qc/RLc ≤ 1
[50 FR 38084, Sept. 19, 1985, as amended at 58 FR 66415, Dec. 20, 1993]
The calculation of the committed effective dose (CED) begins with the determination of the equivalent dose, HT, to a tissue or organ, T, listed in Table B.2 below by using the equation:
HT = ∑(DT,R x wR), where the summation is done over all radiation types R
where DT,Ris the absorbed dose in rads (one gray, an SI unit, equals 100 rads) averaged over the tissue or organ, T, due to radiation type, R, and wR is the radiation weighting factor which is given in Table B.1 below. The unit of equivalent dose is the rem (sievert, in SI units).
Table B.1—Radiation Weighting Factors, wR1
Radiation type and energy range2
wR
Photons, all energies
1
Electrons and muons, all energies
1
Neutrons, energy < 10 keV
5
10 keV to 100 keV
10
>100 keV to 2 MeV
20
>2 MeV to 20 MeV
10
>20 MeV
5
Protons, other than recoil protons, >2 MeV
5
Alpha particles, fission fragments, heavy nuclei
20
1All values relate to the radiation incident on the body or, for internal sources, emitted from the source.
2See paragraph A14 in ICRP Publication 60 for the choice of values for other radiation types and energies not in the table.
II. Effective Dose
The next step is the calculation of the effective dose, E. The probability of occurrence of a stochastic effect in a tissue or organ is assumed to be proportional to the equivalent dose in the tissue or organ. The constant of proportionality differs for the various tissues of the body, but in assessing health detriment the total risk is required. This is taken into account using the tissue weighting factors, wTin Table B.2, which represent the proportion of the stochastic risk resulting from irradiation of the tissue or organ to the total risk when the whole body is irradiated uniformly and HTis the equivalent dose in the tissue or organ, T, in the equation:
E = ∑ wT x HT
Table B.2—Tissue Weighting Factors, wT1
Tissue or organ
wT
Gonads
0.25
Breast
0.15
Red bone marrow
0.12
Lung
0.12
Thyroid
0.03
Bone surfaces
0.03
Remainder2
0.30
1The values are considered to be appropriate for protection for individuals of both sexes and all ages.
2For purposes of calculation, the remainder is comprised of the five tissues or organs not specifically listed in Table B.2 that receive the highest dose equivalents; a weighting factor of 0.06 is applied to each of them, including the various sections of the gastrointestinal tract which are treated as separate organs. This covers all tissues and organs except the hands and forearms, the feet and ankles, the skin and the lens of the eye. The excepted tissues and organs should be excluded from the computation of HE.
III. Annual Committed Tissue or Organ Equivalent Dose
For internal irradiation from incorporated radionuclides, the total absorbed dose will be spread out in time, being gradually delivered as the radionuclide decays. The time distribution of the absorbed dose rate will vary with the radionuclide, its form, the mode of intake and the tissue within which it is incorporated. To take account of this distribution the quantity committed equivalent dose, HΤ(τ) where is the integration time in years following an intake over any particular year, is used and is the integral over time of the equivalent dose rate in a particular tissue or organ that will be received by an individual following an intake of radioactive material into the body. The time period, τ, is taken as 50 years as an average time of exposure following intake:
Ht(τ) = ∫ HT(t) dt, where the integral extends from t0 to t0 + 50
for a single intake of activity at time t0where HT(t) is the relevant equivalent-dose rate in a tissue or organ at time t. For the purposes of this part, the previously mentioned single intake may be considered to be an annual intake.
IV. Annual Committed Effective Dose
If the committed equivalent doses to the individual tissues or organs resulting from an annual intake are multiplied by the appropriate weighting factors, wT, and then summed, the result will be the annual committed effective dose, E(τ):
E(τ) = ∑ wτ x HT(τ), where the ∑ extends over all T
Source: 56 FR 23396, May 21, 1991, unless otherwise noted.
§ 20.1201 Occupational dose limits for adults.
(a) The licensee shall control the occupational dose to individual adults, except for planned special exposures under
§ 20.1206, to the following dose limits.
An annual limit, which is the more limiting of
the total effective dose equivalent being equal to 5 rems (0.05 Sv, in cache); or
the sum of the deep-dose equivalent and the committed dose equivalent to any individual organ or tissue other than the
lens of the eye being equal to 50 rems (0.5 Sv, in cache).
The annual limits to the lens of the eye, to the skin of the whole body,
and to the skin of the extremities, which are:
A lens dose equivalent of 15 rems (0.15 Sv), and
A shallow-dose equivalent of 50 rem (0.5 Sv, in cache) to the skin of the whole
body or to the skin of any extremity.
(b) Doses received in excess of the annual limits, including doses received during accidents, emergencies, and planned
special exposures, must be subtracted from the limits for planned special exposures that the individual may receive during
the current year (see § 20.1206(e)(1)) and during the individual's lifetime (see § 20.1206(e)(2)).
(c) When the external exposure is determined by measurement with an external personal monitoring device, the deep-dose equivalent must be used in place of the effective dose equivalent, unless the effective dose equivalent is determined by a dosimetry method approved by the NRC. The assigned deep-dose equivalent must be for the part of the body receiving the highest exposure. The assigned shallow-dose equivalent must be the dose averaged over the contiguous 10 square centimeters of skin receiving the highest exposure. The deep-dose equivalent, lens-dose equivalent, and shallow-dose equivalent may be assessed from surveys or other radiation measurements for the purpose of demonstrating compliance with the occupational dose limits, if the individual monitoring device was not in the region of highest potential exposure, or the results of individual monitoring are unavailable.
(d) Derived air concentration (DAC) and annual limit on intake (ALI) values are presented in table 1 of appendix B to part
20 and may be used to determine the individual's dose (see § 20.2106) and to demonstrate compliance with the occupational
dose limits.
(e) In addition to the annual dose limits, the licensee shall limit the soluble uranium intake by an individual to 10
milligrams in a week in consideration of chemical toxicity (see footnote 3 of appendix B to part 20).
(f) The licensee shall reduce the dose that an individual may be allowed to receive in the current year by the amount of
occupational dose received while employed by any other person (see § 20.2104(e)).
Appendix B to 10 CFR Part 20 - Annual Limits on Intake (ALIs) and Derived Air Concentrations (DACs) of Radionuclides for Occupational Exposure; Effluent Concentrations; Concentrations for Release to Sewerage (in cache)