- I. Pre2014 Renewable Energy Act (pre2014 EEG)
- II. WBGU: World in Transition - A Social Contract for Sustainability
- III. 2014 EEG: German Government Counteracts WBGU Advice
- IV. Shaping the Electricity Market of the Future
- V. Energy Target 2050: 100% Renewable Electricity Supply
I. Pre 2014 Renewable Energy Act (pre2014 EEG)
I.1. Program
and more (in cache)
by Willem Post, January 16, 2012
Germany's Renewable Energy Act of 2000 guarantees investors above-market fees for renewable energy for 20 years from the time of installation (feed-in tariffs). An EEG surcharge ("apportionment"), equal to the feed-in tariffs paid by utilities for renewable energy minus the revenue from that energy fed into the grid (which depends on the market price), is added (as EEG apportionment/kWh) to the electric bills of almost ALL households and businesses (exemptions).
Table 1. The EEG apportionment charges on household electric bills
Note: External costs (cents/kWh) for environmental and climate damage from
lignite: 12.6 - 14.1, coal: 14.7 - 16.7, nuclear: 18.5 - 50 and up
|
Year |
EEG apportionment eurocents/kWh |
|
2003 |
0.41 |
|
2004 |
0.58 |
|
2005 |
0.68 |
|
2006 |
0.88 |
|
2007 |
1.02 |
|
2008 |
1.12 |
|
2009 |
1.13 |
|
2010 |
2.05 |
|
2011 |
3.53 |
|
2012 |
3.59 |
|
2013 |
5.28 |
|
2014 |
6.24 Of this amount*) ...
|
*) Source: Hintergrundpapier zur EEG-Umlage 2014, Bundesverband Erneuerbare Energien, Oktober 2013
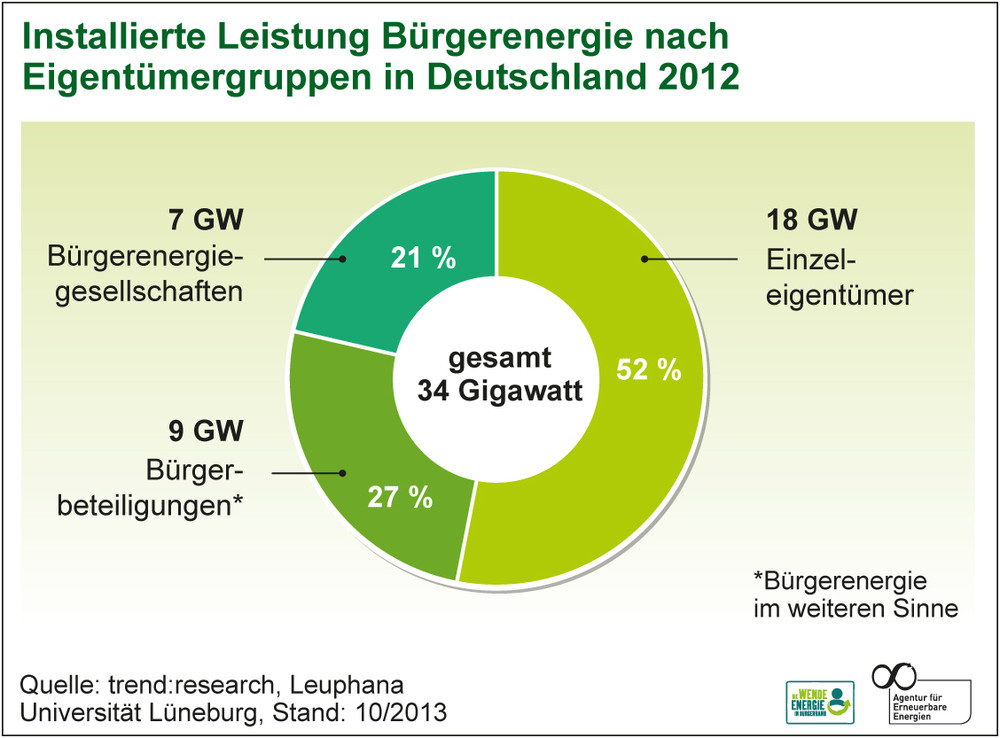
I.2. Renewable Electricity Production under the pre2014 EEG
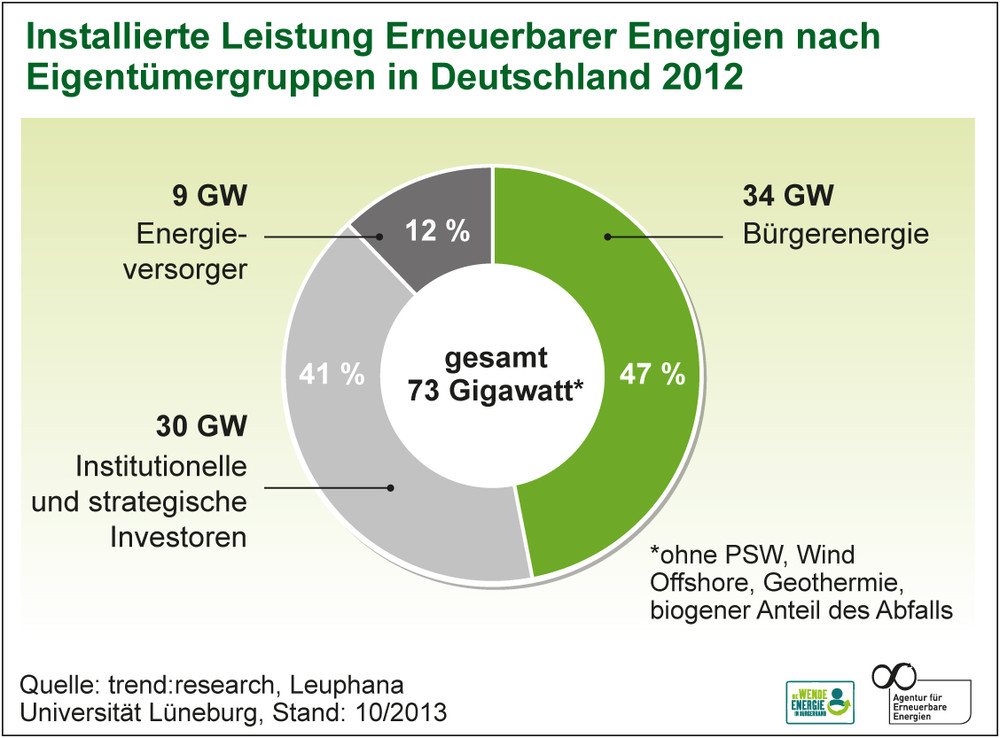 "Bügerenergie" = citizens' energy,
click on figures to enlarge Source (cached), Leuphana University Lüneburg "Bürgerenergiegesellschaften" = (citizens') energy cooperatives, |
|
|
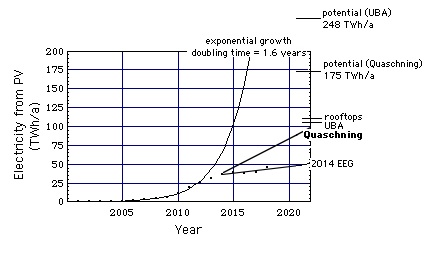
PV-Electricity
|
Figure 2a: German annual photovoltaic (PV) electricity generation doubled every 1.6 years.
2014 energy production from PV: 35.2 TWh. Its full potential would have been reached in 2015 - 2016 had the growth rate (doubling time = 1.6 years) persisted. For comparison: German gross power generation was
Notation:
|
|
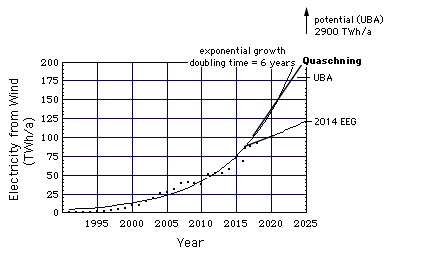
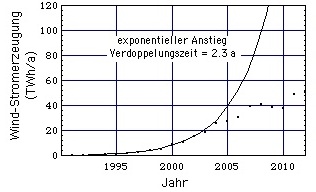
Electricity from On-Shore Wind
|
Figure 2b: German annual electricity generated with on-shore wind turbines doubled
2014 energy production from wind: 51.2 TWh.
|
II. WBGU: World in Transition - A Social Contract for Sustainability
Flagship Report, Scientific Council on Global Change (WBGU), 2011
The German federal government set up WBGU as an independent, scientific advisory body in 1992 in the run-up to the Rio Earth Summit (the Council's principal tasks).
"In this report the WBGU explains the reasons for the desperate need for a post-fossil economic strategy, yet it also concludes that the transition to sustainability is achievable, and presents ten concrete packages of measures to accelerate the imperative restructuring. If the transformation really is to succeed, we have to enter into a social contract for innovation, in the form of a new kind of discourse between governments and citizens, both within and beyond the boundaries of the nation state."
"The new WBGU-Study "A Social Contract for Sustainability" appears at a time in which people around the world are increasingly committed to creating a future that is both sustainable and climate-safe. The study shows that such a future will only be possible if governments, business and civil society collectively set the right course, making the most of regional, national and global cooperation." (Source)
- Full text (5.1 MB, 400 pages),
- Summary: (332 KB, 26 pages)
- E-Seminar "Transformation".
The aim of the new social contract is to preserve natural life-support systems for present and future generations. The social contract combines the 'proactive state' with more participation by civil society in a framework of local, national and global cooperation. Science has an important role to play in this context.
In particular see
- 4. The Great Transformation (Dirk Messner)
- 8. Change Agents (Claus Leggewie)
- When a majority agrees that prompt action is necessary, "agents of change" lead the field. Example: Electricity Works Schönau (EWS)
- 10. Suggestions for Action (Dirk Messner)
4-Page Abstracts ("Factsheets") of Selected Issues
- Factsheet 1/2011: A Social Contract for Sustainability
(pdf, 106 KB)
The central element in a social contract is a proactive state which gears its actions towards sustainability and involves its citizens in decision-making to a greater extent.
- It sets itself targets for climate and energy policy or for the conservation of biodiversity, for example, creates an appropriate macro framework and establishes effective legal mechanisms.
- By doing so, the state safeguards long-term stability as the prerequisite for planning and investment, offers citizens and the business community options for sustainable action, and creates scope for appropriate experimentation.
- The proactive state thus upholds the tradition of the liberal constitutional democracy but develops it further with a view to achieving a sustainable democratic polity and free civil society.
- It also takes account of the natural environment's limits (guard rails or planetary boundaries) as the framework for social and economic development.
- Whereas sustainability and climate protection are often seen as imposing limitations and requiring unreasonable levels of self-deprivation, the proactive state encourages citizens to take action, with the explicit aim of maintaining - and if possible expanding - the freedoms, scope and opportunities of present and future generations.
These proposals formulated by the WBGU are intended to enhance the credibility and functionality of representative democracy and equip it to deal with future challenges.
Breathing life into the social contract: change agents
Change agents have a central role to play in the transformation process as pioneers and drivers of change.
They are defined as individuals or small groups which are initially involved as marginalised protagonists but gradually increase the impact of an innovation until it finally becomes established as a new social routine. Change agents pioneering the transition to a low-carbon society are now embedded in all sectors of society. Indeed, in many countries, they hold positions that can claim acceptance by the majority, and they are found in business, public administration and civil society. Many cities around the world are already implementing low-carbon, future-oriented strategies. In major corporations, the small departments originally set up to handle corporate social responsibility issues have in many cases evolved into 'innovation centres for future-proof markets'. Consumers are showing a growing interest in the social and environmental conditions under which the products that they consume are produced. In the scientific arena, research networks have been set up to study the transformation to a low-carbon society. The proactive state, citizens and change agents are thus key players in the transformation process.
- Factsheet 2/2011: Transforming Energy Systems
(pdf, 112 KB)
A global transformation of energy systems is technically feasible and economically viable which gives all the world's people access to modern energy services while limiting human-induced warming to 2 degrees C.
- Factsheet 3/2011: Global Megatrends
(pdf, 380 KB)
Humankind has become a dominant factor within the Earth System. Some researchers have coined the term Anthropocene ('The Age of Man'). We are rapidly approaching our planet's limits, with trends such as advancing climate change and the destruction of biological diversity jeopardising our natural life support systems. Nonetheless, there are also some positive developments, such as the shift in values towards greater environmental awareness which can be observed worldwide, as well as democratisation and a decrease in poverty.
- Factsheet 4/2011: The Transformation towards Sustainability (pdf, 127 KB)
There is urgent need for, and there are benefits of, a transformation towards sustainability. With reference to the example of climate change, it is demonstrated that this transformation is technically feasible and that sufficient financial resources can be mobilised. The prerequisite is a new social contract which combines responsibility towards future generations with a culture of democratic participation.
- Factsheet 5/2012: Research and Education: Drivers of Transformation (pdf, 120 KB)
The challenges can only be mastered through a broad social dialogue and a consensus on the core issues relating to sustainability: in other words, through a new social contract. This requires a proactive state, balanced out by enhanced participation by citizens.
The transformation to a sustainable society is a process of 'trial and error' - of searching and learning - for society and requires far more democracy. Only a democracy can facilitate the debates that are the essential prerequisite for legitimate policy decisions.
III. 2014 EEG: German Government Counteracts WBGU Advice
- Cap on growth ("Breathing Lid", cached): Principally, as in earlier years, fixed feed-in tariffs are guaranteed for 20 years of operation. These fixed feed-in tariffs have changed over time (example: PV). The 2014 EEG couples the feed-in tariffs for new PV and wind turbines with a Germany wide total annual growth "corridor" for PV and growth "corridor" for wind energy, thus reducing (increasing) the economic incentive to build a new installation when growth exceeds (falls below) the corridor (example: degression August - December 2014, explanation).
For wind as well as for PV this corridor is set at 2.4 - 2.6 GW/year.- The actual feed-in tariffs for PV installations are being published for periods of 3 months by the German Federal Network Agency (Bundesnetzagentur): archive 2009 - 2014,
- Feed-in tariffs for wind onshore (cached).
- The "Agents of Change" claim that the reduced growth rates might result from frequent and hard to understand EEG-changes by the federal government.
- Reason given -to my knowledge unanimously- by members of the coalition parties (Christian and Social Democrats): put a cap on the apportionment (EEG surcharge) by making the EEG more cost-efficient and enabling an ecologically as well as economically meaningful expansion path to 52 GWp installed PV capacity by 2020. As Table 1 shows, there is no need for the cap. For some in-depth information see e.g. Claudia Kemfert (Division Energy, Transportation, Environment, Deutsches Institut für Wirtschaftsforschung), "There is bitter fighting over electricity" [in German: "Um den Strom wird erbittert gekämpft")], April 2014.
- Direct Marketing: Large renewable energy plants (> 500 kW in 2015, > 100 kW thereafter) have to sell their energy on the electricity exchange. They can no longer be part of local energy cooperatives. At the electricity exchange their energy no longer has the label "green energy".
- Details:Installations producing renewable energy sell their energy via the so-called market premium model (§20 para. 1 Num 1 EEG 2014, formerly §33b EEG Num 1, 2012). On top of that the installations receive a "market premium", which is the difference between the price obtained at the electricity exchange and the previous fixed feed-in tariff of green electricity. The sum of the monthly average market price received at the electricity exchange plus the market premium is equal to the feed-in tariff obtained before direct marketing was introduced.
- Remedy: Grünstrom-Markt-Modell: Energy suppliers buy energy directly from renewable energy plants and sell it directly to their customers, as opposed to Direct Marketing where the suppliers buy energy on the electricity exchange. While pure Direct Marketing aims at shutting down wind and solar power plants when stock market prices are negative, the green power market model creates an incentive to adapt energy demand to the supply from renewables. So less clean energy is lost.
- Auctioning: large PV installations will be built by the winners of tenders. This procedure appears to be biassed against small bidders, in effect excluding them from the process.
- Critique from the Alliance for Citizens' Energy [in German]
- Effects of applying the Capital Investment Act (KAGB) on Citizens' Energy Cooperatives (cached)
- Status of the Energy Cooperatives in Germany (cached), January 2015
- Citizens' Energy PV-project: recommendations (cached), September 2014
- Financing renewable energy installations: evaluation of auctioning processes (cached), May 2014
- Market reality of Citizens' Energy (cached), April 2014
Sources:
- The New EEG 2014: Changes [in German], EnergieDialog NRW, EnergieAgentur NRW, Ministerium für Klimaschutz, Umwelt, Landwirtschaft, Natur- und Verbraucherschutz des Landes Nordrhein-Westfalen.
- infografik EEG-Reform [in Germna], Dialog, Energie, Zukunft, Energie Baden-Württemberg (EnBW).
More on the 2014 EEG:
- "Energy policy energy needs citizens: Priority for distributed generation and citizens' direct supply (Direktversorgung) with electricity instead of re-centralization of the energy sector." Position Paper of the Alliance for Citizens' Energy (Bündnis Bürgerenergie) eV re. EEG amendment 2014 (Version: March 6, 2014) [in German]
IV. Shaping the Electricity Market of the Future [in German]
Key issues paper of the German Advisory Council on the Environment (SRU)
March 12, 2014
ABSTRACT
The special SRU report "Shaping the electricity market of the future" presents proposals for the transition to a fully renewable power economy by 2050. Continuous growth of renewable energy, efficiency, security of supply and better governance of the energy revolution are important conditions for success.
EXCERPTS
- Some of SRU's suggestions have already been implemented in 2014 EEG, in particular the transition to Direct Marketing.
- The SRU welcomes the efforts of the Ministry of Economic Affairs to spread the cost of the EEG on more shoulders. These include the revision of the "Special Equalisation Scheme" (dealing with the exemptions from the EEG apportionment) and the exemptions applicable to the electricity generated by one's own power plants.
- It is also important to limit the amount of funding to a level that covers the funding gap to market revenue.
Nevertheless, the SRU sees cause for criticism. The SRU doubts that a "verguetung" for the most important and cost-effective renewable energy source, onshore wind energy, makes sense, particularly as all other technologies are capped for good reasons. This step cannot be justified on the basis of keeping costs low. Network congestion cannot credibly be cited for this either.
Moreover, the introduction of auctioning should not be rushed. In the embodiment of auctions one should first learn from the experiences and mistakes of other countries, which led in part to higher tariffs or mismanagement. First, therefore, pilot projects should be evaluated for an efficient design of the process. This should also be the European Commission to communicate.
The energy revolution will not succeed unless a concept for greater flexibility and significantly lower greenhouse gas emissions from fossil power plants in the transition period will be followed. The rebound in CO2 emissions in Germany damages the international reputation of the energy revolution. Particular cause for concern is the excessive base of lignite. Ultimately, the phasing out of coal must be tackled.
The SRU assumes that wind power and photovoltaics will be the key technologies of a future energy system in a few decades. Their output can very quickly fluctuate, have a considerable fluctuation frequency range and is predictable only to a limited degree. The entire energy system must adapt to these new quality requirements by being flexible. For this, the regime must send the right signals.
In the long term, these are possibilities of adapting to these challenges:
- The demand for electricity should react more flexible - especially in industry and commerce- thus contributing to load balancing.
- In addition, the continued expansion of the long-range grid should allow a large-scale balance of supply and demand. Of particular relevance is adding cross-border network expansion to the national network optimization. A stronger EU-wide integration of electricity grids can ensure that different national supply and demand profiles increasingly cancel each other out.
- The energy demand in all application areas (heat, transport and industrial processes) should increasingly be converted to electricity as the main form of energy to meet climate targets. The result would be an increasingly integrated system with many new flexibility options. So you can move temporary surplus production of electricity into other areas of use (eg. as heat or electric mobility). This also allows a temporarily high production quantity being emulated by the market.
- Finally, further long-term flexibility options should include the mutual convertibility of various forms of energy (eg. power to gas, eg. hydrogen or methane) and a variety of domestic and foreign storage options.
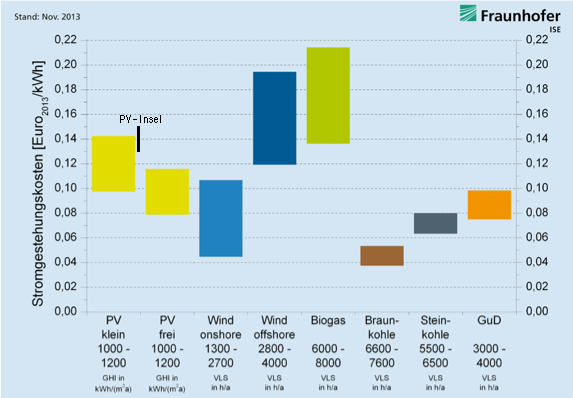 Figure 3: Prime electricity costs for renewables and fossile energies in Germany 2013. Source: C. Kost et al., "Stromgestehungskosten Erneuerbare Energien", Fraunhoferinstitut für Solare Energiesysteme, November 2013 (im Cache)
Notation
|
V. Energy Target 2050: 100% Renewable Electricity Supply (english short version)
Thomas Klaus, Carla Vollmer, Kathrin Werner, Harry Lehmann, Klaus Müschen
Federal Environmental Agency, 2010
Energieziel 2050 - 100 Prozent Strom aus Erneuerbaren Quellen (full version, in German)
V. 1. Overview
- In order to achieve an 80 - 90% reduction in greenhouse gas (GHG) emissions by 2050 we will first have to transform our electricity supply system. The energy sector, currently causing more than 80% of total emissions in Germany, has a key role to play for reducing GHG emissions. Electricity supply is responsible for about 40% of the energy sector's CO2 emissions.
- For Germany an electricity supply system based completely on renewable energies by 2050 is technically as well as ecologically feasible. In our simulation we deploy the best technology available on the market today, meaning that our system can be implemented
- using currently available production and demand side technology and
- without compromising neither Germany's position as a highly industrialised country nor modern behavioural and consumption patterns. ...
- We have conceptualised 3 scenarios representing extreme cases of renewable energy supply, with the electricity supply being predominantly based on wind turbines and photovoltaic cells. Only the Regions Network scenario is dealt with in this study.
- Regions Network scenario: All regions in a country make extensive use of their regional renewables potential. Electricity is exchanged throughout the country. Electricity imports are marginal.
- Local Energy Autarky scenario: Small-scale decentralised energy systems largely use locally available renewable energy sources to satisfy their own power demand without electricity imports. These systems make use of the maximum efficiency technologies and locally available electricity storage facilities.
- International Large Scale scenario: Electricity production and storage is based on large scale technology projects in Europe and its vicinity. Electricity is distributed via an upgraded transmission grid. Electricity production is optimised by distributing fluctuating feed-in from renewable energy most efficiently throughout Europe.
- An electricity supply system based completely on renewable energies can - at any hour of the year - provide a security of supply on par with today's high standard. The results of our simulations show that renewable energies - through the interplay of production, load management and electricity storage - can meet the demand for electricity and provide the necessary control reserve at any time. This is possible even during extreme weather events as occurred in the four-year period considered.
- The expansion of reserve power capacity, application of load management and the development of infrastructure for the transport and long-term storage of electricity are necessary prerequisites for a power system based solely on renewable energies in the year 2050.
- To this effect, a grid expansion on a European level offers great potentials to increase efficiency: a well developed electricity grid seems an essential component for achieving the goal of a completely renewables based electricity system in Germany.
- As an important requirement for achieving a 100% renewable electricity supply, we have to tap the existing energy saving potential.
- A switch to an electricity supply system based on renewable energies will also be economically beneficial.
- A switch to a 100% renewable energy system by 2050 requires decisive political support.
- It is important to define intermediate goals, particularly for the period after 2020. The earlier we start decisive actions, the more time we will have to tackle the upcoming challenges technological and societal adaptation!
- It must be clear that a complete transition of the electricity sector presents a great challenge but needs to start today to avoid the most severe impacts of climate change.
V. 2. Details of the Regions Network Scenario
|
|
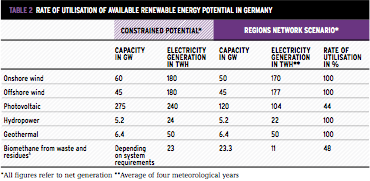
Table 2: Assumed Available Renewable Energy Potential and its Use: Model Data.
It is assumed that only 43 % of the 2050 existing potentials are exploited because the remaining areas are, inter alia, needed for solar thermal systems. Thus, the installed capacity of photovoltaic (PV) systems is 120 GW. Of this amount, about 20% on suitable facades and other vertical surfaces and around 80% on suitable roof surfaces. |
V. 3. Model
|
RES = Renewable Energy Sources |
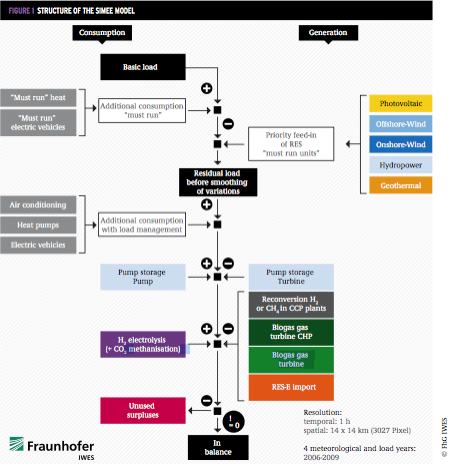
Figure 4: SimEE - Model (in cached): The simulation of the Regions Network scenario was conducted by the Fraunhofer Institute for Wind Energy and Energy System Technology (IWES).
The model simulates electricity production from
The simulation is carried out in hourly resolution and chronological order. Wind and photovoltaic energy production and the use of electric heat pumps can be simulated in a spatial resolution of 14x14 km2.
The dynamic simulation of renewable feed-in and load in 2050 is based on meteorological data and load characteristics from four example years, 2006-2009.
|
Notation: RES = Renewable Energy Sources
V. 4. Results
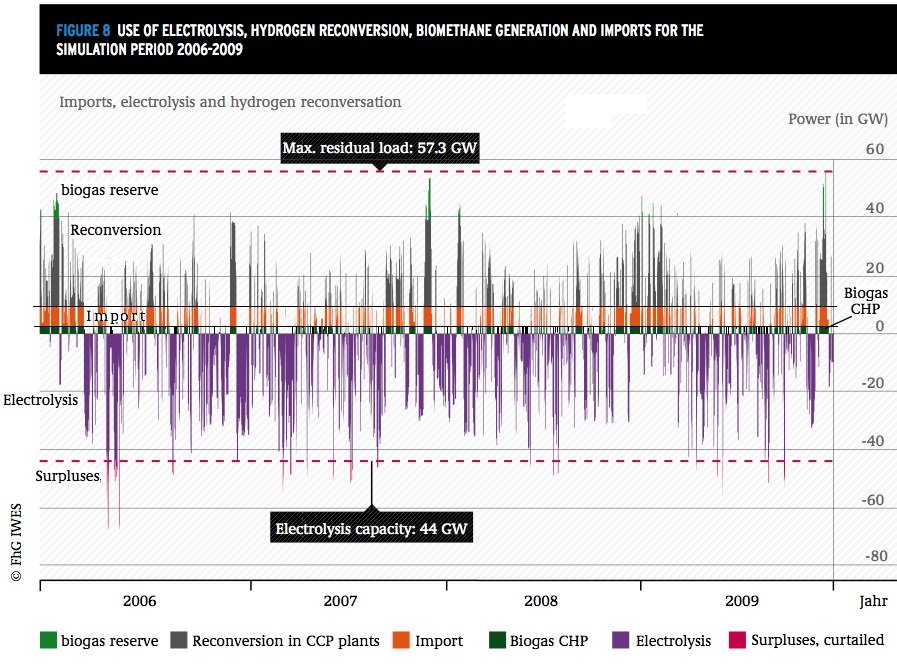
Figure 8: Residual load for prospected electricity consumption assuming the weather we had 2006 - 2009 in Germany.
The residual load is defined as the difference between actual load on the one hand and energy production from renewables, load management, pump storage and chemical storage facilities on the other hand.
- Positive values (red) signify that the remaining load needs to be covered by reconversion, imports and biogas reserve.
- Negative values indicate an excess supply of energy by renewables.
- "Surpluses curtailed" means generated surplus energy that exceeds the electrolysis capacity of the system and needs to be discarded, e.g. by turning off wind turbines or PV areas. With SimEE it could be shown that the German storage potentials for eE-methane as well as for eE-hydrogen are by far larger than the storage requirements.
- Compare 44 GW electrolysis capacity with 184 GWe German power plants capacity in 2013.
Imports
In these scenarios, imports are only used to even out the four-year energy balance. They are not necessary to ensure security of supply. Without these imports, renewable energy potentials would need to be exploited to a somewhat larger extent.
- Imports range from 19.7 TWh for the meteorological year 2007 to 26.5 TWh for 2006.
- The average across all four years is 23 TWh.
- This is slightly less than 5% of electricity consumption in 2050 and thus well below today's gross imports of 40 TWh.
V. 5. Storage of Energy
V.5.1. Pump Storage Hydropower
 click on figure to enlarge
Electricity generation portfolios of the Nordic countries in 2012 (Source, cached). Arrows show transmission lines and their power (MW).
Not included in figure: Potential new cables
|
 click on figure to enlarge
Power lines needed linking Germany with Denmark (42 GW) and Norway with Denmark (46 GW)
Sources:
|
A storage concept (cached, short version for decision makers) not considered in this UBA-study is hydropower. A reservoir capacity of 84 TWh (cached) pump storage is available in Norway (84 TWh = 13 % of the total German electricity consumption in 2013), which
46 GW power line connecting Norway and Denmark and a 42 GW power line connecting Denmark and Germany would transport 76 TWh/a electrical energy for smoothing out renewables' fluctuations.
See also: Stromspeicher in der Energiewende: Untersuchung zum Bedarf an neuen Stromspeichern in Deutschand für den Erzeugungsausgleich, Systemdienstleistungen und im Verteilnetz (in cache) [Electricity Storage in the Energy System Transformation] [participating institutions: FENES, IAEW, ISEA, September 2014]
Hans-Martin Henning, Fraunhofer-Institut für Solare Energiesysteme (ISE) in Freiburg/Breisgau - Scenario: Germany will operate (Source: Forscher bauen aus, photovoltaik 09/2015, pp. 68 - 70)
|
V.5.2. Chemical Storage Systems
click on figure to enlarge
Methane storage fluctuations over the period 2006 - 2009 Electricity can be converted into chemical energy and stored in this form for long periods and transported.
The infrastructure already in place for natural gas allows for an efficient distribution and storage of rp-methane. In contrast, rp-hydrogen would require an additional transport grid but offers higher power-to-power storage efficiencies (42 % for rp-H2 vs. 35 % for rp-CH4). V.5.2.1. Hydrogen Storage System To fully cover the load at any hour throughout the simulation period, the following generation capacities were applied successively as needed: The effect of electrolysers, hydrogen reconversion, biomethane conversion and imports for the entire simulation period are shown in Figure 8. The rp-hydrogen storage system has an efficiency of 42% The hydrogen storage system requires cavern storage space volume of around 28 109 m3. The constrained potential for storage in caverns in Germany is around 37 109 m3, sufficient for 110 TWhth hydrogen; consequently simultaneous natural gas and hydrogen storage is possible with existing storage capacity. V.5.2.2. Methane Storage System
If the long-term storage system is run on rp-methane instead of rp-hydrogen, the total system efficiency decreases to 35% due to additional conversion losses. Imports therefore slightly increase, on average to 30 TWh or around 6% of electricity consumption per annum. The required storage volume of around 7.5 109 m3 is therefore significantly lower than the constrained potential available in 2050. V.5.2.2.1 Potential Leakage of Greenhouse Gas Methane Required methane storage volume Vn = 7.5 109 m3 (1 bar and 273 K) = 5.4 109 kg. If leakage of the necessary methane handling system (including storage) is 1 %/a (more realistic values would be 5.3 %/a - 10.8 %/a %, in cache), this amounts to 5.4 107 kg/a. For comparison: Sourcce: climatemodels.uchicago
For methane leaks see also:
VI. 200 GW PV for Germany - 200 GW are simply logical [both in German] Source:photovoltaik, 9/2012 Christian Breyer and coworkers studied a scenario for a power supply from 100 % renewable energies being as decentralized as possible. For his calculations he divided Germany into area elements 100 kilometer wide. "Such elements have a tendency towards autarchy", he justifies the assumption. Within each area element enough power needs to be available at all 8760 hours of the year. He starts from known data on He makes assumptions on the use and cost of batteries and other storage systems such as power-to-gas (in which green electricity is used to generate gas which is then fed into the gas grid). His result: The annual electricity generation is around 850 TWh, which is more than the commonly assumed consumption. This is necessary because 10% of the energy is not used because they occur at the wrong time and the storage units are full. As for the efficiencies: Needed is a Germany wide installed capacity of about 200 GW of solar power plants and more than 300 GW of wind turbines. VI.1. Cost of a Household-Size Island PV-System (J. Gruber)
"How would you keep consumers from generating their own electricity, when they can do this for less than 1/3 of the prize they'd pay to the power companies?
Costs for PV-power on an island not connected to the electricity grid, generated on a rooftop facing south (east or west) tilted 40 degrees (line "PV-Insel" in Figure 3).
VII. Examples
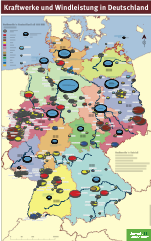
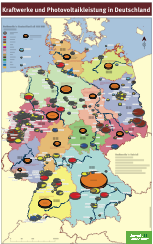
VII. 1. Electricity and Heat Generation in Numbers, Umweltbundesamt, 2014 [in German] Map of Power Plants
Source: Wind Energy Power Plants Source: Photovoltaic Power Plants
VII. 2. Map of Energy Regions in Germany [in German]
VII. 3. Climate Protection Programs and Projects - Innovative Stand-Alone Projects [in German]
VII. 4. Energy Counties - Climate Protection: Concepts for Counties and Municipalities [in German]
VII. 5. Climate County Saerbeck [in German]
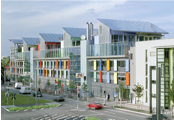
VII. 6. Rolf Disch Solar Architecture (cached)

Global warming potential (GWP) is an estimate of the climate impact of greenhouse gas release, which accounts for the longevity of the gas in the atmosphere as well as its instantaneous impact on the radiative energy balance of the Earth.
in terms of CO2eq the leak rate corresponds to the emission rate of a German city with 4 million inhabtants
(55 000 kg/h 84 CO2eq Germans /(10^4 kg/(8760 h) = 4 106 Germans
You would have to put a penalty tax on photovoltaics in order to prevent them installing 150 GW. The roof area for that is there." (Volker Quaschning, Professor, Regenerative Energy Systems, Hochschule für Technik und Wirtschaft (HTW) Berlin)
Basis:
4400 Euro + 2400 Euro = 6800 Euro
5040 Euro + 2400 Euro = 7440 Euro
6800 Euro for 2630 kWh/a 20 a = 0.13 Euro/kWh
7440 Euro for 2630 kWh/a 20 a = 0.15 Euro/KWh
Energy Mix

VII. 7. Dr. Werner Sobek
|
VII. 8. Germany Hits 59 % Renewable Peak, Grid Does Not Explode
VII. 9. Alliance for Citizens' Energy (BBEn) [in German]
BBEn defines itself as a competence center that bundles and focusses the common interests of citizens' energy by
- advancing political lobbying,
- creating a "culture of citizens' energy" in the political public and
- supporting a citizens' energy community via better networking.
VII. 10. Citizens' Energy eG [in German] offers citizens the opportunity to actively contribute
- to the build-up of renewable energies,
- to energy efficiency and
- to environmental protection.
VII. 11. Agora-Energiewende, project duration: 2012 - 2017, budget: 14 106 Euros, Council Members
"Along with other actors from politics, civil society, the business world, and science, we aim to develop a common understanding of the problems, clarify the options, and discuss feasible policy measures." (Source)
VII. 12. Lots of details can be found in my compilation "Daten und Zahlen".
VII. 13. Jochen Gruber, Windparks - Pro und Contra: Ein Blog
VII. 14. Joachim Gruber, Estimate of the municipal income from trade tax paid by the operator of the planned Windfarm Ankershagen [in German], 22 March 2013.
- Wind turbine with 2.3 MW power will generate 81 GWh in 20 years.
- If start-up of the turbine was 2012, the feed-in-tariff equivalent of 81 GWh would be approx. 5 106 Euros (basis - cached),
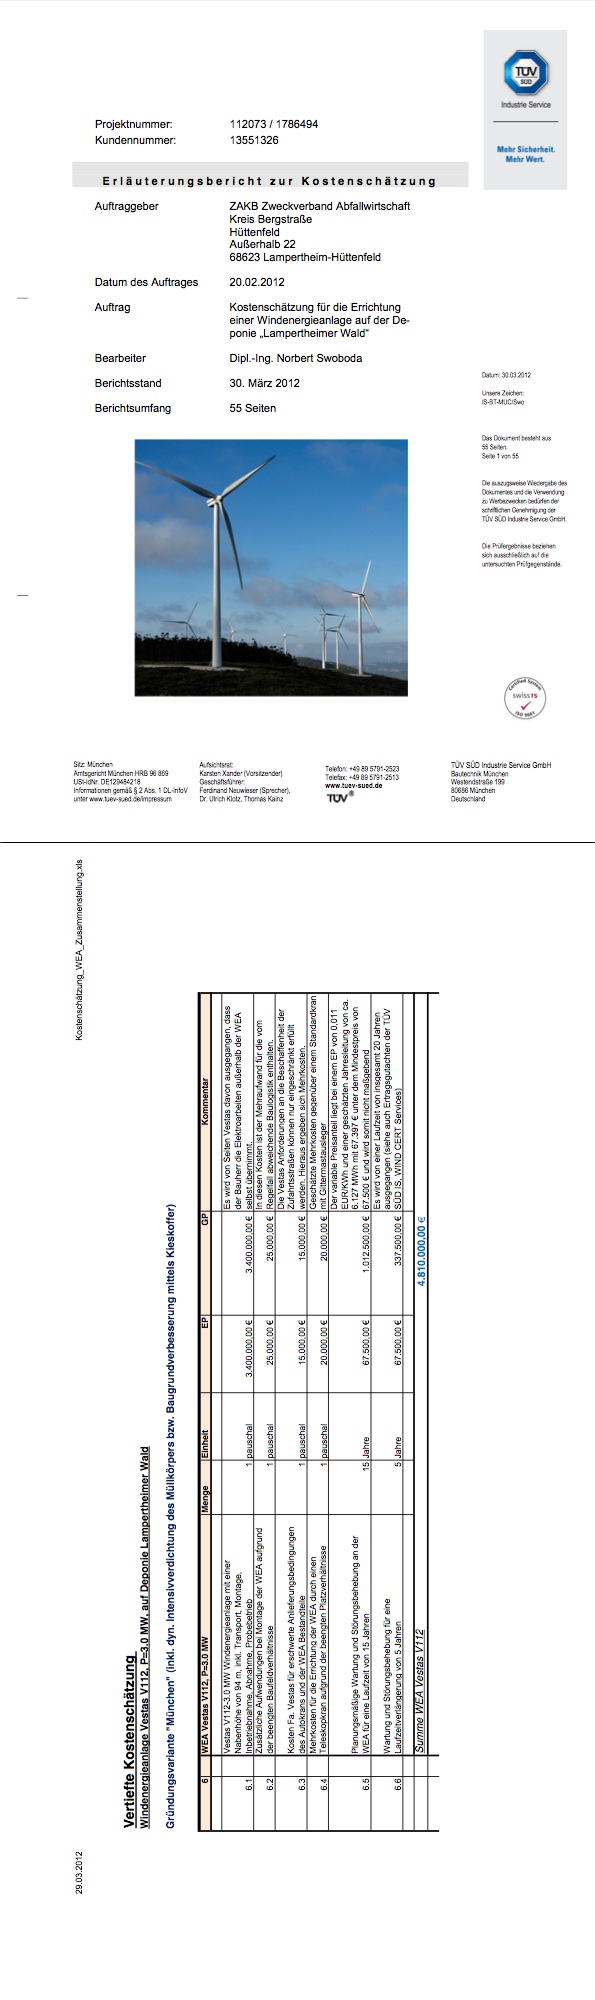
for comparison: turn-key ready Vestas V112-3.0MW wind energy turbine costs 3.4 106 Euros, service for 20 years: 1.3 106 Euros (source: Norbert Swoboda, TÜV Süd, February 2012 - cached).
VIII. Appendix
VIII.1. Potential of on-shore wind energy
A study of the Germany wide land area potential and corresponding energy production [in German]
Insa Lütkehus, Hanno Salecker, Kirsten Adlunger, Thomas Klaus, Carla Vollmer, Carsten Alsleben, Raphael Spiekermann, Andrea Bauerdorff, Jens Günther, Gudrun Schütze, Stefan Bofinger, Federal Environmental Agency (UBA), 2013
Abstract:
Potential of on-shore wind energy
Approximately 13.8 % of the German land area are suited for wind turbine farms. Sensitive nature areas are not part of this area. The wind turbines are located far enough from inhabited areas to meet the required noise protection laws. These 13.8 % can provide up to 1200 GW installed wind power with 2900 TWh/a annual electricity production.
For comparison: Germany's 2012 installed wind power on land is about 34 GW delivering 50.7 TWh/a. In 2012 German gross power generation was 630.1 TWh.
The estimate of the area (13.8 %) did not take into account economical aspects.
- Only technical and ecological constraints were considered,
- specific local circumstances were not considered, e.g.
- protection of locally endangered species,
- radar installations, other commercial and military radio and telecommunication terminal equipment,
- priority areas for settlement development,
- objections of individuals against development of wind energy on their property or in their vicinity,
- economic aspects, e.g. possible gain from wind vs. gain from a different development.
The two reference wind turbines used in this study are assumed to deliver Germany wide on the average 2440 full load hours per year. The number of full load hours per year, averaged over Germany is
- year 2010: 1700 h (Source: UBA),
- year 2013: 1506 h (Sources: BWE - cached, BdEW - cached),
- year 2014: 1343 h (Sources see 2013).
The true technical-ecological potential will therefore be significantly smaller. For example
- disregarding locations in which the weak reference wind turbine will deliver less than 2200 full load hours per year will reduce the potential to 930 GW installed wind power with 2400 TWh/a annual electricity production.
- doubling the required least distance of wind turbines from residential areas will reduce the 13.8 % to 3.4 %.
VIII.2. Certifications for Green Energy
(overview in German)

Regenerative or cogenerative electricity is certified with this label if its provider charges a fixed amount ("funding") per kWh for
- the construction of new plants and
- operation of existing plants or
- measures to promote energy transition
in accordance with the principles described in para. 3.1. through 3.2.2.
This funding amount must be at least
- 1 ct / kWh (net) for end users with an annual consumption below 10,000,
- 0.4 cents / kWh (net) for end users with an annual consumption between 10,000 kWh and 100,000 kWh,
- 0.2 cents / kWh (net) for end users with an annual consumption of more than 100,000 kWh.
para. 3.1. through 3.2.2 specify:
- 3.1.1 - 3.1.3: regenerative electricity generation (Leitfaden I.b.),
- 3.1.4: ground breaking projects, new technologies (Leitfaden I.c.),
- 3.1.5: energy efficiency and environmental impact mitigation measures (Leitfaden I.d.),
- 3.1.6: green electricity direct delivery (Leitfaden I.e.),
- 3.1.7: other support measures. e.g. for citizens' energy projects, projects supporting communication and education, mini projects (Leitfaden I.f.),
- 3.1.8: cooperation with developing countries (Leitfaden I.g.).
VIII.3. Providers of Renewable Electricity
Whom to choose among more than 1000 providers?
VIII.4. K. Rohrig, "German Government's Scenario to Supply 80% of Power Consumption by Renewable Energy in 2050
5th International Conference on Integration of Renewable and Distributed Energy Resources (IRED), Berlin, 04.-06.12.2012 (cached)
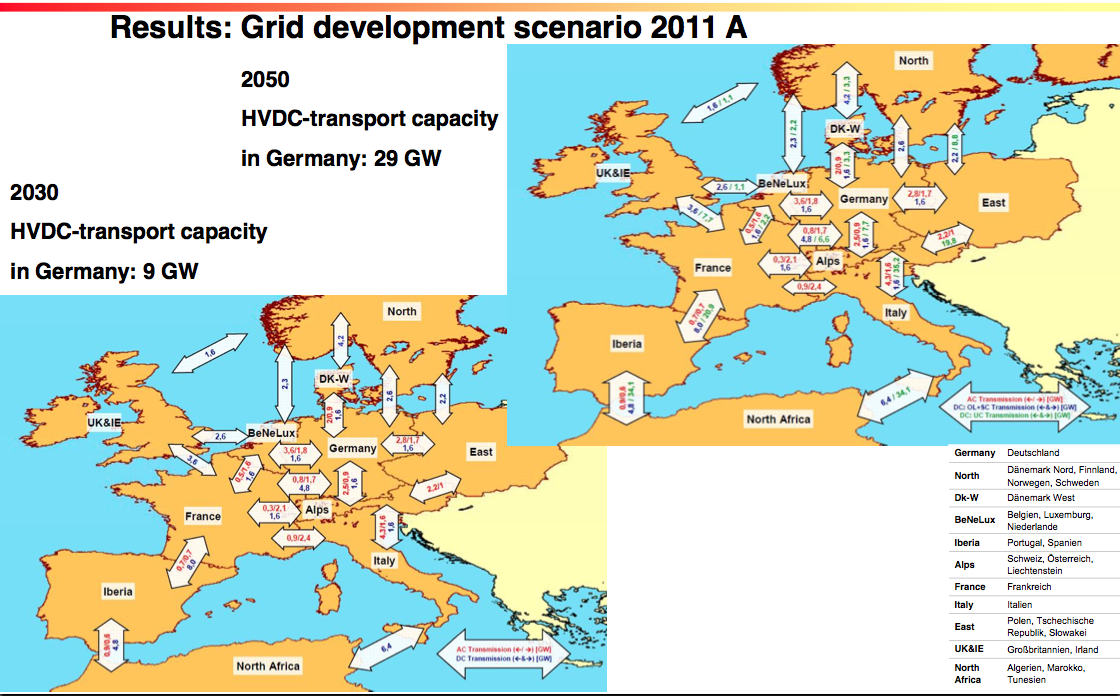 click on figure to enlarge Source: Rohrig, 2012 |
Electricity grid development in Germany: scenarios 2030 and 2050 |
Version: 13 November 2016
Address of this page
Home
Joachim Gruber