We [Deutsche Bank Climate Change Advisors] are seeking to raise public awareness of climate change. As investors, we know the importance of measurement so that we can track progress. Our approach is to start by understanding the quantity, or concentrations, of long-lived greenhouse gases which are building up in the world's atmosphere and are leading to global warming.
We have turned to key scientific sources to calculate the current atmospheric concentrations of greenhouse gases and to monitor how quickly these concentrations are increasing. Our starting point has been the Intergovernmental Panel on Climate Change's (IPCC) Fourth Assessment Report, released in 2007, which details the important long-lived greenhouse gases that contribute to global warming and are driven by human activity resulting in emissions. Using the work from the IPCC, we collaborated with scientists at the Joint Program on the Science and Policy of Global Change at the Massachusetts Institute of Technology (MIT) to update the findings and track these gases in the most timely and up-to-date manner possible. This is a process that relies on regular measurements taken at dozens of sites across the world.
In order to show the underlying growth of greenhouse gas concentrations, the effect of natural cyclical phenomena such as the seasons and the El Niño-Southern Oscillation are removed. Aerosols, some caused by pollution, do have a net cooling effect at present, but they are difficult to measure so are not included. Changes in other factors that affect long term accumulation, including economic activity, are reflected in the regular site measurements through an adjustment process that takes place every month when this actual data become available. The lag between the actual and the trend estimate is about three months, with final validation several months later.
Greenhouse gas concentrations are frequently expressed as an equivalent amount Gte of Carbon Dioxide (CO2, GteCO2). This CO2-equivalent concentration in parts per million (ppm) can then be expressed in terms of metric ton of CO2, a standard of measurement, which as a stock of gases in the atmosphere is readily understood.
According to the IPCC AR4 Synthesis Report, atmospheric CO2 concentrations were 379ppm in 2005. The estimate of total CO2-eq concentration in 2005 for all long-lived GHGs is about 455 ppm (see Carbon through History).
On June 18th as the counter started, long-lived GHGs in the atmosphere were estimated to be 3.64 trillion metric tons, growing at 2 billion metric tons per month (= 24 109 metric tons per year), or 467 ppm, of which CO2 was 385 ppm.
The full implications for global warming coming from greenhouse gases are outlined both in the IPCC Synthesis Report and a more recent paper from MIT looking at the probabilities of warming. To quote MIT's News Office this is "the most comprehensive modeling yet carried out on the likelihood of how much hotter the Earth's climate will get in this century shows that without rapid and massive action, the problem will be about twice as severe as previously estimated six years ago - and could be even worse than that." By 2100, surface temperatures could be 5.1 degrees Celsius higher."
Ronald Prinn, professor of atmospheric science at MIT, explained the data behind the sign: "The number on the counter is based on global measurements. It shows the total estimated tonnage of greenhouse gases expressed as their equivalent amounts of carbon dioxide, with seasonal and other natural cyclical variations removed to more clearly reveal the underlying long-term trends driven by human and other activity." (Source)
Abb.3.1.2
Beispiele für globale Emissionspfade, bei denen im Zeitraum 2010 - 2050 750 Mrd. t CO2 emittiert werden (Quelle: Wissenschaftlicher Beirat der Bundesregierung Globale Umweltveränderungen: Seite 16 in: Kassensturz für den Weltklimavertrag - Der Budgetansatz, Sondergutachten 2009, Berlin: WBGU - in cache)
Abbildung 1.1-2 zeigt illustrativ drei schematische zeitliche Verläufe der globalen CO2-Emissionen aus fossilen Energieträgern, die mit einem solchen Budget vereinbar wären. Es wird deutlich, dass eine zeitliche Verschiebung der Trendumkehr der globalen Emissionen (peak) dazu führt, dass in späteren Jahren deutlich höhere Minderungsraten erforderlich sind, um das Budget einzuhalten. Eine globale Reduktionsrate
3.7% pro Jahr ist in heutigen Wirtschaftssystemen erreichbar.
9.0% pro Jahr ist unmöglich zu verwirklichen.
Vor allem aufgrund neuer, wesentlich niedrigerer Abschätzungen der Landnutzungsemissionen seit 2000 (Friedlingstein, et al. 2010) ist die vom WBGU für das Budget 2010 - 2050 gegebene Abschätzung von 750 Gt CO2 (WBGU, 2009b) daher auch als grober Richtwert für das zulässige Budget 2011 - 2050 gültig.
Auch wenn der dominante Erwärmungseffekt von den CO2-Emissionen stammt, wurden bei diesen Berechnungen auch die Effekte der anderen im Kioto-Protokoll geregelten Treibhausgase berücksichtigt. So wird davon ausgegangen, dass die kumulierten Emissionen dieser anderen Treibhausgase im Zeitraum 2010 - 2049 etwa 500 Gt CO2eq betragen (Meinshausen et al., 2009).
Studien der vergangenen Jahre zeigen, dass durch die lange Lebensdauer von CO2 in der Atmosphäre dessen ohnehin hohe Bedeutung für den Klimawandel im Vergleich zu kurzlebigeren Treibhausgasen und Aerosolen auf lange Sicht immer dominanter wird (Allen et al., 2009; Meinshausen et al., 2009). Der WBGU hat diese Erkenntnis ins Zentrum des Sondergutachtens "Kassensturz für den Weltklimavertrag - Der Budgetansatz" gestellt (WBGU, 2009b). Da mittlerweile neuere Emissionsdaten vorliegen, wird im Folgenden das noch zulässige CO2-Budget aktualisiert.
Nach Meinshausen et al. (2009) führt die Emission von 1.160 Gt CO2 aus anthropogenen Quellen im Zeitraum 2000 - 2050 mit einer Wahrscheinlichkeit von 33 % zur Überschreitung der 2 Grad Celsius-Leitplanke.
Auf Grundlage der Daten von CDIAC (2011), Le Quére et al. (2009) und GCP (2011) schätzt der WBGU die CO2-Emissionen aus fossilen Quellen und der Zementherstellung für den Zeitraum 2000 - 2010 auf 314 Gt CO2 sowie die Emissionen aus Landnutzungsänderungen auf 45 Gt CO2, d.h. die gesamten anthropogenen CO2-Emissionen im Zeitraum 2000 - 2010 belaufen sich nach dieser Schätzung auf ca. 360 Gt CO2.
Insgesamt dürften im Zeitraum 2011 - 2050 demnach noch ca. 800 Gt CO2 aus anthropogenen Quellen emittiert werden, wenn die 2 Grad Celsius-Leitplanke mit einer Wahrscheinlichkeit von zwei Dritteln eingehalten werden soll.
Was heißt das für die Emissionen aus fossilen Quellen?
Friedlingstein et al. (2010) beziffern die durchschnittlichen jährlichen CO2-Emissionen aus Landnutzungsänderungen für den Zeitraum 2000 - 2009 auf 4,0 Gt. Die Vertragsstaaten der Biodiversitätskonvention haben sich zum Ziel gesetzt, bis 2020 zumindest eine Halbierung der Verlustrate natürlicher Ökosysteme zu erreichen, einschließlich der Wälder (CBD, 2010b). Sollte es daher gelingen, die damit verbundenen Emissionen bis 2020 zu halbieren und anschließend mit derselben Rate weiter auf Null zu senken, würde dies die CO2-Emissionen aus Landnutzungsänderungen bis 2050 auf 40 Gt begrenzen. Würden diese Emissionen allerdings erst bis 2030 halbiert und bis 2050 auf Null gesenkt, dann würden 80 Gt CO2 emittiert. Je nachdem, wie erfolgreich die Eindämmung der CO2-Emissionen aus Landnutzungsänderungen ist, also vor allem die Verminderung der Entwaldung in den Tropen (Kap. 4.1.7), dürften also bis 2050 noch 720 - 760 Gt CO2 aus fossilen Quellen emittiert werden.
Soll die Wahrscheinlichkeit, die anthropogene Klimaerwärmung auf 2 Grad Celsius zu begrenzen, auf 75 % erhöht werden, würde sich das zulässige CO2-Budget aus fossilen Quellen auf 560 - 600 Gt CO2 verringern.
Sollten keine Erfolge bei der Eindämmung der Entwaldung erzielt werden, würde das Budget weiter schrumpfen.
Literatur
Allen, M. R., Frame, D. J., Huntingford, C., Jones, C. D., Lowe, J. A., Meinshausen, M. und Meinshausen, N. (2009): Warming caused by cumulative carbon emissions towards the trillionth tonne. Nature 458, 1163-1166.
CBD - Convention on Biological Diversity (2004): Protected Areas (Articles 8 (a) to (e)). Decision VII/28. Montreal: CBD. CBD - Convention on Biological Diversity (2010a): Updating and Revision of the Strategic Plan for the Post-2010 Period. Decision X/2. Montreal: CBD. CBD - Convention on Biological Diversity (2010b): Global Biodiversity Outlook 3. Montreal: CBD Secretariat.
CDIAC - Carbon Dioxide Information Analysis Center (2011): Global Data 1751-2007. Internet: http://cdiac.ornl.gov/ ftp/ndp030/global.1751_2007.ems (gelesen am 7. Januar 2011). Oak Ridge, TN: CDIAC.
Friedlingstein, P., Houghton, R. A., Marland, G., Hackler, J., Boden, T. A., Conway, T. J., Canadell, J. G., Raupach, M. R., Ciais, P. und C., L. Q. (2010): Update on CO2 emissions. Letter to the Editor. Nature Geoscience -advance online publication, 1 - 2.
GCP - Global Carbon Project (2010): Carbon Budget. Summary Highlights (brief). Internet: http://www.globalcarbonpro- ject.org/carbonbudget/09/hl-compact.htm (gelesen am 5. Januar 2011). Canberra: Global Carbon Project. GCP - Global Carbon Project (2011): Carbon Budget. Highlights (full). Internet: http://www.globalcarbonproject.org/car- bonbudget/09/hl-full.htm#ffcement (gelesen am 7. Januar 2011). Canberra: GCP.
Le Quére, C., Raupach, M. R., Canadell, J. G. und Marland, G. (2009): Trends in the sources and sinks of carbon dioxide. Nature Geoscience 2, 831-836.
Meinshausen, M., Meinshausen, N., Hare, W., Raper, S. C. B., Frieler, K., Knutti, R., Frame, D. J. und Allen, M. R. (2009): Greenhouse-gas emission targets for limiting global warming to 2 Grad Celsius. Nature 458, 1158-1161.
Berechnung der maximal zulässigen Emission ohne Berüksichtigung der seit Beginn der Industrialisierung in den Industrieländern verbrauchten CO2-Emissionen ("Historische Verantwortung" oder "Zukunftsverantwortung")
Ausgangspunkt: 2 Grad Ziel. Daraus folgt
global noch zulässige CO2eq-Emission: 750 Mrd. Tonnen CO2eq im Zeitraum 2010 - 2050.
gleichmäßig verteilt auf 6.8 MRD. Menschen ergibt: zulässige Emission pro Person = 110 t CO2eq
gleichmäßig verteilt über 40 Jahre ergibt: zulässige Emission pro Person und Jahr = 2.75 t CO2eq.
Diese Menge (2.75 t CO2 / Jahr und Person) hat der WBGU daher in dieser und dieser Abbildung verwendet.]
Für jedes Land wird ein Emissionsbudget abgeleitet, das im Gesamtzeitraum von sechs Jahrzehnten zur Verfügung steht. Zieht man von diesem Budget jeweils die bereits zwischen 1990 und 2009 erfolgten Emissionen ab, ergibt sich die Restmenge, die den Staaten bis 2050 tatsächlich noch zur Verfügung steht.
Beispielsweise
bekämen die
USA,
Deutschland und
Russland
in dieser Option negative Emissionsbudgets bis 2050 (nebenstehende Abb. 5.3-1), wären also bereits heute "kohlenstoffinsolvent".
Japan hätte die CO2-Emissionsrechte, die ihm für den gesamten Zeitraum 1990-2050 zustünden, schon heute nahezu aufgebraucht.
Das würde diese Staaten dazu zwingen, in erheblichem Maße Emissionsrechte von Ländern zu erwerben, die vermutlich auch künftig ihre zugewiesenen Budgets nicht voll ausschöpfen werden.
Dieser Handel mit Zertifikaten würde zweifellos zu bedeutenden finanziellen Transfers von Nord nach Süd führen.
The InterAcademy Council has released a new report, commissioned by the governments of Brazil and China, identifying and detailing the scientific consensus framewok for directing global energy development. Lighting the way: Toward a sustainable energy future lays out the science, technology and policy roadmap for developing energy resources to drive economic growth in both developed and developing countries while also securing climate protection and global development goals.
For more information on the report, see the press release or the IAC's "Lighting the Way" brochure and further background information. To view or download the full report, click here.
Dr. Katja Barzantny, Sigrid Achner, Eutech Energie und Management GmbH; Andree Böhling, Greenpeace e.V.
Der Anteil der elektrischen Energie am Endenergieeinsatz von Haushalten sowie Gewerbe, Handel, Dienstleistungen ist in den letzten Jahrzehnten kontinuierlich gewachsen. Wenn auch die Zuwachsraten in der Vergangenheit deutlich abgenommen haben, wird unter weitestgehend unveränderten Rahmenbedingungen auch künftig ein weiterer Zuwachs erwartet. Gründe für die Verbrauchsentwicklung liegen neben dem anhaltenden Wirtschaftswachstum u.a. in der vielfach noch weiter ansteigenden Ausstattung der Haushalte und der Wirtschaft mit elektrischen Geräten (z.T. verbunden mit einer Zunahme der Gerätegröße) und Anlagen (Umweltbundesamt (UBA): Nachhaltige Entwicklung in Deutschland. Die Zukunft dauerhaft umweltgerecht gestalten, Berlin, 2002, S. 134). An erster Stelle stehen dabei Telekommunikations- und EDV-Anlagen sowie Anlagen zur Kühlung und Klimatisierung. Im Haushaltsbereich sind hierfür maßgeblich sozioökonomische Trends (Anstieg der Single-Haushalte, steigendes Einkommen, sinkendes Zeitbudget für Hausarbeit usw.) verantwortlich. Im Sektor GHD ist eine entscheidende Ursache im wirtschaftlichen Strukturwandel hin zu kommunikations- und informationsintensiven Dienstleistungsbranchen zu sehen. Im Hinblick auf die aktuellen Verbräuche im Jahr 2004 weisen die Energiedaten des BMWi (2006) folgende Zahlen aus: Stromverbrauch HH ca. 140 TWh Stromverbrauch GHD ca. 125 TWh Hierin enthalten sind die Verbräuche für Beleuchtung, Information und Kommunikation, mechanische Energie sowie der Stromeinsatz für die Prozesswärme-, Warmwasser- und Raumwärmebereitstellung. Einen Überblick über den Haushaltsstromverbrauch nach Anwendungsarten gibt die Tabelle 5-1.
Tabelle 5-1: Haushaltsstromverbrauch (140 TWh im Jahr 2004, Quelle: BMWi, 2006) nach Anwendungsarten 2001 (Deutsches Institut für Wirtschaftsforschung (DIW)/Umweltbundesamt (UBA)/Forschungszentrum Jülich/Fraunhofer-Institut für System- und Innovationstechnik (ISI): Politikszenarien für den Klimaschutz Ü Langfristszenarien und Handlungsempfehlungen ab 2012 (Politikszenarien III), Berlin, 2004).
140 TWh = 360 W Jahr/Haushalt 40 106 Haushalte (wobei 40 106 = grob abgeschätze Zahl der Haushalte, 2.13 Personen/Haushalt = mittlere Haushaltsgröße)
13.3 TWh = Leerlaufverluste ohne die bei Warmwasserbereitung (Quelle: UBA 2001)
Einsparpotential-Schätzungen
Bundesminister für Umweltschutz, Szenario NaturschutzPlus II in: Ökologisch optimierter Ausbau der Nutzung Erneuerbarer Energien, 2004
2004 - 2010: Reduktion um insgesamt 28 TWh auf 112 TWh pro Jahr (entspricht 20 % von 140 TWh)
2011 - 2020: Reduktion um insgesamt weitere 35 TWh auf 77 TWh pro Jahr (entspricht 31 % von 112 TWh oder 45 % von 140 TWh)
Deutsche Energieagentur (dena): Presseinformation. Auszüge aus dem Statement von Stephan Kohler, Vorsitzender der Geschäftsführung, Deutsche Energie-Agentur GmbH (dena), auf dem Energiegipfel, Berlin, 2006
2015: Reduktion um 18 % von 140 TWh
2020: Reduktion um 25 % von 140 TWh
Quelle: Dr. Katja Barzantny, Sigrid Achner, Eutech Energie und Management GmbH; Andree Böhling, Greenpeace e.V. "Klimaschutz: Plan B - Nationales Energiekonzept bis 2020", Greenpeace e.V., Große Elbstraße 39, 22767 Hamburg, Tel. 040/30618-0, Fax 040/30618-100, E-Mail: mail@greenpeace.de
Hierin sind die Leerlaufverluste der Geräte enthalten. Diese werden nach UBA 2001 mit insgesamt 13,3 TWh jährlich (ohne Leerlaufverluste für die Warmwasserbereitung) für den Haushaltsbereich beziffert. Insgesamt entfällt auf die Prozesswärme der größte Anteil am Stromverbrauch, gefolgt von mechanischer Energie und elektrisch bereitgestellter Raumwärme (Wagner, U.: CO2-Vermeidungskosten im Kraftwerksbereich, bei den Erneuerbaren Energien sowie bei nachfrageseitigen Energieeffizienzmaßnahmen, München, 2004, Tab. 7-1, S. 96).
Ein Umbau der Energieversorgung, wie Sie ihn skizziert haben, kostet viel Geld. Wer soll das bezahlen?
Die erforderlichen Mehrinvestitionen in Energieeffizienz, Ausbau der Erneuerbaren Energien und der Kraft-Wärme-Kopplung machen sich bezahlt durch die erheblichen Energieeinsparungen - und das schon binnen 10 Jahren. Es lohnt sich also. Mal ganz abgesehen davon, dass dieses Geld - 110 Milliarden Euro bis 2020 - ja hier bei uns investiert würde, was jede Menge Arbeitsplätze bedeutet. [Anmerkung (J.G.) 110 109 Euro / (80 106 Personen in Deutschland * 10 Jahre) = 137 Euro / (Person Jahr)]
Was hätten wir sonst noch von der Energiewende?
Eine deutlich verringerte Importabhängigkeit, ein drastisch reduzierter Primärenergieeinsatz, 45 Prozent weniger Treibhausgas-Emissionen bis 2020, minus 90 Prozent bis 2050. Plus eine erhöhte Versorgungssicherheit und mehr Komfort, etwa durch besser gedämmte Wohnungen.
-->Atomstromfreies Internet: Was kann ich tun? - Mach mit! (Greenpeace Energy hat das Angebot des atomstromfreien Internets (http://af-i.de, http://www.atomstromfreies-internet.de/) zum 30. Juni 2009 beendet.)
Nach Schätzung des Freiburger Ökoinstituts verbraucht das Internet weltweit 20 GW elektrische Leistung. Das weltweite Datennetz verbraucht gewaltige Mengen an Strom und könnte mitverantwortlich sein für den Klimawandel.
Google: Eine Suchanfrage = 11 Wh
Eine einzige Such-Anfrage bei Google verbrauche so viel Strom wie eine 11-Watt-Energiesparlampe pro Stunde, meldet die New York Times.
eBay: Eine Auktion der Dauer einer Woche: 30 Wh
Eine eBay-Auktion, die eine Woche dauert, kostet ungefähr 30 Wattstunden Strom und führt zu einem Kohlendioxidausstoß von 18 Gramm. Doch wirkt es sich spürbar aus, dass jährlich Hunderte von Millionen Online-Auktionen stattfinden.
Spiele: Eine Figur in Second Life: 1752 kWh pro Jahr
Eine Figur in "Second Life" frisst durchschnittlich 1752 Kilowattstunden pro Jahr - das ist mehr als mancher echte Mensch im Jahr verbraucht, zum Beispiel in Indien.
CO2-Emission der deutschen Internetnutzung im Jahr 2001: 4 Millionen Tonnen = 1/2 % von Deutschlands Gesamtemission an Treibhausgasen
Basierend auf Daten des Prognos-Instituts und des Umweltbundesamtes haben Klimaforscher errechnet, dass der Stromverbrauch des Internets einen CO2-Ausstoß von 4 Millionen Tonnen pro Jahr verursacht, allein in Deutschland.
Das Wuppertal Institut für Klima, Umwelt und Energie, eine Klimaforschungseinrichtung des Landes Nordrhein-Westfalen, geht in einem Szenario für das Jahr 2010 davon aus, dass das Internet in Deutschland mehr als 30 Milliarden Kilowattstunden Strom verbrauchen wird.Davon entfällt
der größte Teil auf PCs, der Rest verteilt sich
auf Server,
Provider und
Datenleitungen für Onlinehandel und Mailverkehr.
Werde der derzeitige auf fossilen Brennstoffen und Atomenergie beruhende Strom-Mix beibehalten, sei das Internet im Jahr 2010 für 18,5 Millionen Tonnen CO2 und mehr als 27 Tonnen hochradioaktiven Atommüll verantwortlich, befürchtet Greenpeace.
... jeder einzelne kann einiges tun:
So sollte man statt zu Desktop-Computern zu Notebooks greifen, die ein Drittel weniger Energie verbrauchen.
Außerdem sollte man auf den Standby-Modus verzichten und
sich mit schlichten Hintergrundbildern begnügen.
Und schließlich wäre schon viel gewonnen, wenn man von hohen Rechenleistungen beanspruchenden Bilddateien, Multimedia-Elementen, Video-Portalen und Online-Spielen nur dann Gebrauch machen würde, wenn es sinnvoll ist."
Atomstromfreies Internet - Powered by Greenpeace (Greenpeace Energy hat das Angebot des atomstromfreien Internets (http://af-i.de, http://www.atomstromfreies-internet.de/) zum 30. Juni 2009 beendet. Keines der folgenden Links funktioniert mehr.):
Du willst mithelfen, das Internet grün zu machen? Dazu gibt es viele Möglichkeiten, und eine davon kostet dich nicht einmal etwas!
Af-I Webmail
Mit dem atomstromfreien E-Mail-Account schenken wir dir 20 MB grünen Speicherplatz für E-Mails, und das sogar komplett ohne Werbung! Wenn du willst, kannst Du Deine E-Mails ab sofort ökologisch korrekt verschicken. Hol Dir jetzt deine neue E-Mail-Adresse!
Af-I Website
Wenn deine Website atomstromfrei sein soll, lass Sie doch von einem unserer Partner hosten! Du hast schon eine Internetseite? Dann ziehe damit zu einem unserer zertifizierten Provider um! Wir zeigen dir, zu wem…
Af-I Server
Auch deinen Server kannst du jetzt atomstromfrei housen lassen, wenn du ihn ins Rechenzentrum einer unserer Af-I Service Provider stellst. Hier gibt es atomstromfreie Server!
Kleiner Tipp: Wenn du möchtest, dass dein Server bei dir zuhause steht, ist das kein Problem: Dann kannst du Af-I User werden und deinen Strom von Greenpeace energy beziehen!
Af-I User
Du willst nicht nur Dein Internet, sondern auch deinen Computer mit grünem Strom versorgen? Dann werde doch Stromkunde bei Greenpeace energy! Das geht ganz einfach, du kannst sogar online wechseln. Deine Waschmaschine, dein Toaster und alle anderen Geräte in deiner Wohnung werden dann gleich mit grün! Damit machst du dich unabhängig von grauem Strom, der Atommüll erzeugt und die Erde erwärmt. Ich möchte atomstromfrei leben!
Quelle: wdr Fernsehen, Quarks & Co, 2001
Energieszenarien: Wie errechne ich meine persönliche Energiebilanz?
Eine erste grobe Abschätzung gibt der Verbrauch an Primärenergie pro Kopf in Deutschland: Das sind jährlich
6 Tonnen Steinkohleeinheiten =
gut 50.000 Kilowattstunden (kWh) =
5000 Liter Heizöl.
CO2-Emission verschiedener Energieträger bei
vollständiger Umsetzung:
Gas 0,19 kg/kWh
Steinkohle 0,33 kg/kWh
Braunkohle 0,41 kg/kWh
Übrigens entsteht beim Verbrennen von 1 l Diesel soviel CO2 wie bei 1,135 l Benzin.
Der durch die Nutzung fossiler Energieträger wie Öl, Erdgas und Kohle erzeugte hohe
Ausstoß von Kohlendioxid droht unser Klima nachhaltig zu verändern. Deutschland hat
sich selbst verpflichtet, diesen Ausstoß bis 2005 um 25 Prozent zu reduzieren.
Niemand kann in die Zukunft sehen, aber dieses Ziel auch wirklich zu erreichen
dürfte sehr schwierig werden. Ende 1997, sozusagen Halbzeit, waren schon mehr als 10
Prozent Reduzierung geschafft (894 Megatonnen 1997 gegenüber 1014 Megatonnen 1990).
Im gleichen Zeitraum hat der Primärenergieverbrauch aber nur um 3 Prozent
abgenommen. Die Differenz ist leicht zu erklären: Im Zuge der deutschen Einheit
wurden im Osten der Republik zahlreiche Kraftwerke von Kohle auf Gas umgestellt. Die
sogenannte CO2-Intensität von Gas ist aber nur etwa halb so hoch wie die
von Kohle, d.h. beim Verbrennen derselben Energiemenge wird nur halb so viel
Kohlendioxid frei. Grund dafür ist das günstigere Verhältnis von Kohlenstoff zu
Wasserstoffatomen im Gasmolekül. Weil die Umstellung von Kohle auf Gas weitgehend
abgeschlossen ist, dürfte die weitere Reduktion des Kohlendioxidausstosses weit
schwieriger werden.
Kompensationsanbieter
Viele umweltbewusste Menschen haben aufgrund ihrer CO2-Emissionen mittlerweile ein schlechtes Gewissen. Clevere Unternehmer machen sich das zunutze und wollen gleichzeitig der aufgeheizten Atmosphäre zu Hilfe kommen.
The Gold Standard works three ways: as a foundation, a project development method, and a credit label:
a) The Gold Standard is a non-profit foundation, based in Basel, Switzerland. At headquarters, we manage questions and applications about the Gold Standard accreditation process.
b) Projects that use the Gold Standard method are the premium projects in the carbon market. The project method requires the use of renewable energy and energy efficiency technologies that promise sustainable development for the local community. All Gold Standard projects are rigorously tested for environmental quality by registered third parties.
c) The Gold Standard carbon credit label is awarded after third party validation and verification of the offset project. Gold Standard credits are in high demand due to rising awareness about the need for rigor and transparency in the carbon market. Glossary
Es gibt Firmen ("Kompensationsanbieter"), z.B.
Compare Carbon Offsetters Compares Quality, Price, Projects, Certification.
The First Green Directory to neutralize all its carbon emissions.
Looking for organic food, cheap clean energy, a sustainable house, organic cotton, a vegetarian date, an organic farm, a sustainable community or eco products?
Welcome to EcoBusinessLinks - Green Directory
+300 categories +8,000 green links +1,000,000 visitors/year
greenOrange handelt mit so genannten Emissionsberechtigungen. Diese werden vereinfacht als "Zertifikate" bezeichnet. Jedes Zertifikat entspricht 1 t CO2, die durch spezielle Klimaschutzprojekte eingespart wurde.
Wir bieten diese Zertifikate Privatpersonen und Unternehmen an, die nicht zur Teilnahme am gesetzlichen Emissionshandel verpflichtet sind, die aber trotzdem etwas für den Schutz unseres Klimas tun möchten.
Diese Zertifikate stellen also eine Möglichkeit dar, sich aktiv am Ausbau der regenerativen Energieversorgung und an der Reduzierung von CO2- Emissionen zu beteiligen.
In unserem Ablaufdiagramm wird genau erklärt, wie greenOrange funktioniert.
Allianz-Autoversicherung
(sie bietet in Kombination mit der Kfz-Versicherung den Kauf von CO2-Minderungzertifikaten nach "Gold-Standard" an - Kosten (Stand: September 2007): 37 EUR pro Tonne emittierten CO2)
"atmosfair ist eine gemeinnützige GmbH, die aus einem Forschungsprojekt des Bundesumweltministerium entstand und von der Umweltorganisation Germanwatch und dem forum anders reisen initiiert wurde. Als non-profit Organisation sind kommerzielle Interessen ausgeschlossen. So lässt sich garantieren, dass mit den atmosfair-Geldern so viel wie möglich für den Klimaschutz getan wird. Mindestens 80 Prozent der Einnahmen fließen in Klimaschutzprojekte. Damit entspricht die Mittelverteilung bei atmosfair den Anforderungen des deutschen Spendensiegels." Schirmherren: Prof. Dr. Hartmut Graßl (Physiker, Ehemaliger Direktor des Max-Planck-Instituts für Meteorologie in Hamburg), Prof. Dr. Mojib Latif (Leibniz-Institut für Meereswissenschaften an der Universität Kiel), Prof. Dr. Klaus Töpfer (Ehemaliger Exekutiv-Direktor des Umweltprogramms der Vereinten Nationen, UNEP)
"NativeEnergy helps you help build Native American (auf deutsch: Indianer), farmer-owned, community based renewable energy projects that create social, economic, and environmental benefits. Native Americans and farmers traditionally care for and care about the environment because they are also very dependent on the gifts of the Earth for their survival. They are seeking a way to build their economies and their communities. This is one of the reasons we developed our novel approach to renewable energy; we want our business – our work – and so also our customers’ purchases, to make a real difference."
die einen regelrechten "Ablasshandel" mit der Klimabelastung betreiben - sie bieten Betrieben oder Einzelpersonen freiwillige Kohlendioxid-Ausgleichsmaßnahmen an. Für ein Jahr Autofahren, was einem CO2-Ausstoß von etwa zwei Tonnen entspricht, bezahlt der reuige Umweltsünder bei der Carbon Neutral Company zum Beispiel rund 20 Euro. Das Geld kommt einem Klimaschutzprojekt zugute. (Quelle: "Klimaschutz im Alltag", Quarks & Co, Sendung vom 30.1. 2007, tagesschau.de)
Short list (in cache) of policy initiatives, business efforts, and actions by individuals which WWF has helped to bring to life and which illustrate the growing movement of actions and activists who want to help turn the tide.
You can make a more accurate calculation of your personal or household CO2 emissions by multiplying your actual energy use, as specified in fuel / utility bills, by relevant 'carbon intensity factors'. Carbon intensity factors for the major fuels are as follows:
The carbon intensity factor for electricity depends on the fuel used for generation and the efficiency of conversion. Typical factors are as follows:
Power Plant Fuel
Carbon intensity factor
Coal
0.92 kg CO2 /kWhel
Gas
0.52 kg CO2 /kWhel
Nuclear2
0.0 kg CO2 /kWhel
Renewable3
0.0 kg CO2 /kWhel
1Woodfuel is a biofuel so carbon released on combustion is equivalent to carbon taken up in the growing of the plant. Some CO2 may be emitted as a result of harvesting, processing and transport. 2No CO2 is released from the production of electricity but processes of uranium mining, enrichment and transport do cause CO2 emissions. 3No CO2 emissions are produced from electricity generation but some may be associated with the construction of installations.
Most electricity suppliers use a mixture of different generation sources. Some utility companies can provide customers with details of fuels used and average carbon intensity factors. Emissions from electricity usage are calculated by multiplying the estimated usage by average electricity grid carbon intensity factors for each country, as shown in the next paragraph.
Indirect Systems
Jaime Arias, Dept. of Energy Technology, Royal Institute of Technology Sweden
The average CO2 Emission
from a carbon power plant is about 1.11 [kg CO2/kWhel],
from oil power plant is about 0.77 [kg CO2/kWhel],
from a gas power plant is about 0.55 [kg CO2 /kWel] and
from a nuclear and hydroelectric power plant is 0.00 [kg CO2/kWhel].
The current U.S. electricity mix has an estimated life cycle GHG emission's factor of 655 kg CO2e/MWh, not including
the penalty for transmission loses (19). The U.S. average life cycle emission's factor for crude oil, excluding petroleum product transport is 530 kg CO2e/bbl (26).
Source: Jaramillo, P.* +, Griffin, W. M.=& and
S. T. McCoy&, Civil and Environmental Engineering Department, Tepper School of Business, and Department of Engineering and Public Policy. Carnegie Mellon University, 5000 Forbes Avenue, Pittsburgh, Pennsylvania 15213-3890, Life Cycle Inventory of CO2 in an
Enhanced Oil Recovery System, July 2009.
(19) Jaramillo, P.; Griffin, W. M.; Matthews, H. S. Comparative life cycle air emissions of coal, domestic natural gas, LNG, and SNG for electricity generation. Environ. Sci. Technol. 2007, 41 (17), 6290-6296.
(26) Mangmeechai, A. Life Cycle Greenhouse Gas Emissions, Consumptive Water Use and Levelized Costs of Unconventional Oil in North America; Carnegie Mellon University: Pittsburgh, PA, 2009.
Regional Conversion Factor (RC) is the emission of CO2 per unit of electrical energy kWhel delivered, measured in [kg CO2/kWhel, with kWhel meaning kWh electrical energy].
aus: Strom und Wärme selbst erzeugen und nutzen, Shell GASreporter 2/2008, Seite 4
In Deutschland wird etwa doppelt so viel Wärme verbraucht wie Strom.
Die Kraft-Wärme-Kopplung kann nach physikalisch-technischen Prinzipiendiesen Energiemix (2 Teile Wärme / 1 Teil Strom) liefern (siehe rechte Spalte: "Physikalisch-technischer Hintergrund").
Die gezeichneten KWK-Potenziale sind demgegenüber die sog. "wirtschaftlich erreichbaren".
Vorwiegend in den neuen Bundesländern wird die Kraft-Wärme-Kopplung seit Jahrzehnten eingesetzt.
Zur Zeit (2007) werden in Deutschland etwa 20 Millionen Tonnen CO2 durch KWK-Anlagen eingespart.
Der Stirlingmotor liefert etwa diesen Strom-Wärme-Mix
Funktionsweise des Stirlingmotors
(Quelle: Wikimedia, by Richard Wheeler (Zephyris) 2007)
Eine Alpha-en:Stirling-Maschine. Rot bezeichnet heißes und blau kaltes Gas.
Der rechte Kolben wird immer wieder im richtigen Takt angeschoben, so ähnlich wie man jemanden auf einer Schaukel anschiebt (das System aus Kolben und Schwungrad wird in Resonanz gebracht).
Einmal schiebt ihn das sich unter Erwärmung ausdehnende Gas nach links,
das andere Mal saugt das sich abkühlende Gas den Kolben nach rechts.
Der Motor braucht keine Ventile. Der Trick ist die Phasenverschiebung der beiden Kolbenbewegungen um 90 Grad, die oft dadurch erreicht wird, daß man den zweiten Zylinder um 90 Grad gedreht anbringt, wie in der Sunmachine geschehen.
Physikalisch-technischer Hintergrund
Wird 1 kWh Strom (aus Brennstoff, im Cache)) erzeugt, fallen zusätzlich etwa 2 kWh Wärme an. Diese 2 kWh können
zu Heizzwecken weiterverwendet werden (dies nennt man Kraft-Wärme-Kopplung, KWK, oberes Bild) oder
als Abwärme in Kühltürmen verschwendet werden (unteres Bild).
Quelle der Grafiken: ASUE
Vergleich der Wirkungsgrade bei Strom- und Wärmeerzeugung:
oben: über Kraft-Wärme-Kopplung,
unten: über konventionelle Kraftwerke (Strom, oberer Teil) und dezentrale Heizung (Wärme, unterer Teil).
Prozentualer Anteil des in KWK-Anlagen erzeugten Stroms an der gesamten erzeugten Strommenge (Stand 2006).
Mehr Effizienz ist gefordert:
Deutscher Nachholbedarf bei der Kraft-Wärme-Kopplung
Markus Rimmele
(Quelle: Deutschlandfunk, Umwelt und Verbraucher, 30.11.2006, im Cache)
Um beim Klimaschutz voranzukommen, sind Energiesparen und der Einsatz erneuerbarer Energien angesagt. Aber auch eine effizientere Energienutzung kann den CO2-Ausstoß mindern. Bei der Kraft-Wärme-Kopplung hinkt Deutschland im europaweiten Vergleich hinterher.
In Dänemark liegt der Anteil der im KWK-Verfahren gewonnenen Elektrizität bei 50 Prozent,
in den Niederlanden bei 30,
in Polen bei 17,
in Deutschland aber nur bei 12 Prozent - "zum Unmut der EU-Kommission, die von Deutschland eine Verminderung der Treibhausgas-Emissionen fordert". Guido de Wilt, der zuständige EU-Beamte in Brüssel
ein wirtschaftliches KWK-Potenzial von annähernd 60% an der Stromerzeugung ermittelt im Vergleich zu heute ca. 10%,
in Meseberg habe die Bundesregierung 25% als Ziel bis 2020 aufgestellt,
doch wenn es bei dem schwachen Anreizniveau des vorliegenden Entwurfs bleibe, würden nicht einmal 20% tatsächlich erreicht.
Klaus Traube, energiepolitischer Sprecher [des Bundesverbands KWK], skizzierte die aus Sicht des Branchen übergreifenden Verbandes erforderlichen Änderungen (Stellungnahme zum BMWi-Entwurf der KWK-Gesetzesnovelle vom 9.10.07, im Cache).
Es komme darauf an, mit dem neuen Gesetz ein starkes Signal für massive Investitionen in Fernwärme, industrielle KWK und Tausende kleiner Anlagen in Gewerbe, öffentlichen Einrichtungen und Wohnungsbau zu geben.
Vor allem müsse künftig der gesamte erzeugte KWK-Strom eine Bonusvergütung erhalten und nicht wie bisher nur der in das öffentliche Netz eingespeiste."
Auszug aus der gemeinsamen Pressemitteilung vom 27. April 2005 von Bundesverband Kraft-Wärme-Kopplung (B.KWK), Deutsche Umwelthilfe (DUH), Greenpeace, Bund für Umwelt und Naturschutz Deutschland (BUND), Bundesverband Bürgerinitiativen Umweltschutz (BBU) und Naturschutzbund Deutschland (NABU)
BUND-Bundesgeschäftsführer Gerhard Timm erklärte: "Ohne massive Effizienzsteigerungen wird die Energiewende nicht gelingen. Dabei ist der Ausbau der Kraft-Wärme-Kopplung entscheidend." Timm erinnerte daran, dass in Deutschland nur rund 10 Prozent des Strombedarfs über die Kraft-Wärme-Kopplung erzeugt werden. In Finnland, Dänemark und den Niederlanden liege der Anteil zwischen 35 und über 50 Prozent. Eine Stromwirtschaft der Großstrukturen blockiere den Wandel [Die Bundesregierung wies [In dem vor kurzem erstellten Monitoring-Bericht zum KWK-Gesetz] ... darauf hin, dass das für 2010 angestrebte CO2-Reduktionsziel von mindestens 20 Mio. t p.a. nicht erreicht würde, weil der angekündigte marktkonforme Zubau der KWK von den Energiekonzernen nicht eingelöst werde, Verband Kommunaler Unternehmen (VKU)-Vorschläge für KWK-Förderung / Stadtwerke könnten pro Jahr 3,5 Mio. t CO2 einsparen (15.11.2006), hinzugefügt von J. Gruber]. Die aktuell verkündeten Planungen neuer Mammutkraftwerke würden die nach dem zweiten Weltkrieg etablierte Kraftwerksstruktur bis über die Mitte des 21. Jahrhunderts hinaus fortschreiben.
Der Generalbevollmächtigte der Stadtwerke Leipzig, Winfried Damm, forderte die Bundesregierung auf, "jetzt die Rahmenbedingungen für die nächste Kraftwerksgeneration richtig zu setzen." Die Fernwärmestandorte in Ostdeutschland, aber auch vielerorts in Westdeutschland müssten jetzt entscheiden, ob sie weiter auf die effiziente und Klima schonende Kraft-Wärme-Kopplung setzen oder Strom und Wärme künftig wieder getrennt bereitstellen sollen. Damm: "Sollten die Kraftwerksbetreiber keine verlässlichen Rahmenbedingungen vorfinden, werden sie die bestehenden Anlagen auf Verschleiß fahren und in wenigen Jahren endgültig abschalten." Vor ähnlichen Entscheidungen, die weitere Arbeitsplätze kosten würden, stünden neben den Stadtwerken Leipzig mindestens weitere 7 ostdeutsche Stadtwerke, die ebenfalls kommunale KWK-Anlagen betreiben.
Umweltbundesamt, Fachgebiet I 4.4 "Rationelle Energienutzung" Dessau, 13. April 2007
"Elektrische Wärmepumpen stellen Energie für die Gebäudeheizung bereit, indem sie relativ kühle Umgebungswärme aus Erdreich, Wasser oder Luft auf ein nutzbares Temperaturniveau heben ("pumpen"), wobei sie elektrischen Strom verbrauchen. Dasie einerseits erneuerbare Umweltwärme verwenden, andererseits aber auch aus nichterneuerbaren Energieträgern erzeugten Strom, sind sie eine Art "Zwitter" unter den Heizungssystemen.
Die Effizienz der Wärmepumpenanlage (die Jahresarbeitszahl JAZ) ist gut [>> 3], wenn die Installation folgende Punkte erfüllt:
Hohe Güte des Wärmepumpenaggregates selbst (hohe Leistungszahl)
gute Abstimmung der installierten Einzelkomponenten
möglichst konstant hohe Temperatur der verwendeten Wärmequelle(Abwärme oder warmes Abwasser sind besser als Außenluft)
niedrige Vorlauftemperatur und kleine Temperaturdifferenz zwischen Wärmequelle und Heizungsvorlauf.
... Auch wenn man zukünftige Bestwerte für die Effizienz elektrischer Wärmepumpen annimmt, können z.B. erdwärmegestützte Wärmepumpen nur bis zu 35 % weniger Treibhausgase emittieren als Gas-Brennwertheizungen."
Erklärung:
"Die Jahresarbeitszahl (JAZ) beschreibt die Energieeffizienz einer elektrischenWärmepumpe: Sie ist das [über] ein Jahr [ge]mittelte Verhältnis von abgegebenerNutzwärme (Heizarbeit, [kWhth]) für die Raumheizung zu dem dazu erforderlichen Aufwand(Antriebsarbeit). Bei elektrischen Wärmepumpen ist dies der erforderliche elektrischeStrom [kWhel].
[JAZ = kWhth/kWhel] Zum Beispiel bedeutet eine JAZ von 3.0 für eine elektrische Wärmepumpe, daß fürdie Bereitstellung von 3 kWh Nutzwärme 1 kWh elektrischer Strom erforderlich ist."
"Angenommene Bestwerte von Jahresarbeitszahlen (JAZ)
elektrischer Wärmepumpen für ein Heizsystem
mit 35 C Vorlauftemperatur und 28 C Rücklauftemperatur"
Wärmequelle
Angenommene Bestwerte der JAZ
elektrischer Wärmepumpen
Grundwasser
5.0
Erdreich
4.3
Außenluft
3.8
"Diese Bestwerte berücksichtigen das Entwicklungspotenzial elektrischerWärmepumpen. Thermodynamische und technische Gründe sprechen dafür, daßneue und optimierte elektrische Wärmepumpen näherungsweise diese Bestwerte derJAZ erreichen können."
Ein totales Reduktionspotential wurde identifiziert, das die Reduktionsanforderung von etwa 27 Gt CO2 erfüllt. Die Kosten der Reduktion werden weniger als 40 EUR/t CO2 betragen und werden -im Mittel im Jahr 2030- schätzungsweise bei 15 EUR/t CO2 liegen.
Zum Vergleich: Die mittlere CO2-Emission in Deutschland liegt bei 11 t CO2 pro Person und Jahr, die Erde verträgt aber nur 1 t CO2 pro Person und Jahr.
Eine Verringerung seiner energiebedingten CO2-Emission um 40 % bis 2020 würde jeden von uns weniger als 1 Euro pro Tag kosten oder 50 Euro pro jährlich eingesparter Tonne CO2.
- energiebedingt bedeutet bei der öffentlichen Stromerzeugung, der zentralen Wärmeerzeugung (z.B. in Heizwerken), in den Raffinerien und Kokereien -
Bis 2020 werden wir in Deutschland 25 - 30 % der CO2-Emissionen gegenüber 1990 einsparen. Dieser hohe Wert liegt an den "Lernkurven" von Technologien.
[unsere] überschlägige Rechnung: Wenn wir Deutsche bis 2020 unsere Treibhausgasemissionen um 40% reduzieren wollen, dann müßten wir ungefähr 11 Milliarden Euro pro Jahr einsetzen, um dies zu erreichen, d.h. 25 Euro pro Privathaushalt pro Monat.
(vgl. dazu den globalen Wert der IPCC, Seite 12, Tabelle SPM.4 von Summary for Policymakers (im Cache). In: Climate Change 2007: Mitigation. Contribution of Working Group III to the Fourth Assessment Report of the Intergovernmental Panel on Climate Change, the IPCC Fourth Assessment Report (AR4), B. Metz et al. (eds), Cambridge University Press, Cambridge, United Kingdom and New York, NY, USA).
Das wäre überdies ein "famoses" Wirtschaftsprogramm.
Erklärung:
Diesen Betrag (11 Milliarden Euro in Deutschland pro Jahr oder 25 Euro pro Privathaushalt und Monat) erhält man, wenn man die von heute bis 2020 notwendigen Ausgaben um die Einsparungen verringert, die im Rahmen der Maßnahmen in diesem Zeitraum erzielt werden. Einsparungen erzielt man z.B. bei der Gebäudeheizung, nachdem man sein Gebäde wärmegedämmt hat. Besonders in der Anfangsphase, z.B. beim Anbau der Wärmedämmung, werden also Privathaushalte zur CO2-Reduktion pro Monat mehr als durchschnittlich 25 Euro ausgeben. Aber im Jahre 2020 wird eine rückblickende Bilanz der Ausgaben und Einsparungen im gesamten Zeitraum 2008 - 2020 den Durchschnittswert von 25 Euro pro Privathaushalt und Monat ergeben.
Das Dokument enthält einen konkreten Maßnahmenkatalog für die Erreichung einer 40 % Emissionsreduzierung bis 2020. Dieses Konzept wird von den Grünen als Antrag in den parlamentarischen Prozess eingebracht. Die genannte UBA-Studie ist eine der Grundlagen des Energiekonzepts.
Die Grünen halten die Emissionsreduzierung nicht nur für notwendig sondern auch für möglich. Es ist ein zentrales Anliegen unserer Politik - auf allen Ebenen.
Energiekonzept von BÜNDNIS 90 / DIE GRÜNEN: Entschließungsantrag der Abgeordneten Oliver Krischer, Bärbel Höhn, Hans-Josef Fell, Sylvia Kotting-Uhl, Ingrid Nestle, Hermann Ott, Dorothea Steiner und der FraktionBÜNDNIS 90 / DIE GRÜNEN zu der dritten Beratung des Gesetzentwurfs der Fraktionen der CDU/CSU und FDP, -Drucksachen 17/3051, 17/3409, 17/3453- Entwurf eines Elften Gesetzes zur Änderung des Atomgesetzes, Deutscher Bundestag, Drucksache 17/3485, 17.Wahlperiode 27.10.2010 (im Cache)
"... eine proportionale Aufteilung der erforderlichen CO2-Emissionsminderungen auf die verschiedenen volkswirtschaftlichen Sektoren (Energiewirtschaft, Industrie, Verkehr, Gewerbe/Handel/Dienstleistungen, Haushalte) [ist] nicht zielführend. Stattdessen orientiert das UBA sich bei der Aufteilung der Minderungsziele an folgenden Kriterien:
Wirtschaftlichkeit der vorhandenen Minderungspotenziale, also geringst mögliche Vermeidungskosten pro verminderte Tonne CO2.
Überwindbarkeit der Hemmnisse zur Emissionsminderung.
Verkehr: 17 %, 30 Mio t
Senkung der CO2-Emissionen pro km um 40 % (= 15 Mio t CO2) gegenüber 2005.
Eine CO2-abhängige Kfz-Steuer sollte - so, wie es die Koalitionsvereinbarung für die 16. Legislaturperiode des Deutschen Bundestages vorsieht - eingeführt werden.
Ein vergleichendes Label für Neuwagen mit Energieeffizienzklassen A-G (wie bei Haushaltsgeräten) ist erforderlich.
Verbindliche Grenzwerte für den spezifischen CO2-Ausstoß sind erforderlich, damit das Ziel eines CO2-Ausstoß es für den Durchschnitt der Neuwagen von 130 g/km erreicht wird.
Verlagerung in öffentlichen Personennahverkehr bzw. Schiene (ÖPNV) und Verkehrsvermeidung: 15 Mio t CO2
Beispiel: Verlagerung von 5 % aller PKW-Fahrten im Stadtbereich auf ÖPNV und 30% aller PKW-Fahrten unter 5 km auf Fahrrad vermindern die CO2-Emissionen um 3 - 4 Mio t pro Jahr (Etwa die Hälfte aller Pkw-Fahrten ist kürzer als 5 km).
Haushalte: 43 %, 39 Mio t
energetische Sanierung des Gebäudebestands und der Heizungsanlageneffizienz:
Minderung um 20 Mio t CO2 (= 60 %), gleichbedeutend mit einer Erhöhung der Sanierungsrate von derzeit 0.6 % auf 2 %
6 % Steigerung des Anteils erneuerbarer Energien an der Wärmeversorgung
Gewerbe, Handel, Dienstleistungen: 50 %, 10 Mio t
Wie wird jeder von uns in seinem Privatleben einen Teil dieses Betrags aufbringen können?
Staatliche Maßnahmen für Privathaushalte und Gewerbe: Aussagen des UBA-Berichts "Klimaschutz in Deutschland", 5. Mai 2007
Die Besteuerung der einzelnen Energieträger sollte sich an ihrer relativen Umweltschädlichkeit orientieren und auch den Aspekt der Ressourcenschonung berücksichtigen, um die Lenkungseffizienz der Energiebesteuerung sowie ihre Akzeptanz in der Öffentlichkeit zu erhöhen. Vor diesem Hintergrund sollten sich die Relationen der Steuersätze für alle Energieträger zu 50 % nach dem Energiegehalt und zu 50 % nach der Treibhausgasemissionsrelevanz richten.
Auf lange Sicht ist die Höhe der Energiesteuersätze schrittweise so zu justieren, daß sie zusammen mit den anderen Klimaschutzinstrumenten die mit dem Kohlendioxidausstoß verbundenen (also "externen") Kosten vollständig internalisieren. Auf der Grundlage aktueller Literaturauswertungen empfiehlt das Umweltbundesamt als beste Schätzung der externen Kosten den Wert 70 Euro pro Tonne CO2 zu verwenden. Bezogen auf diesen Wert betragen die externen Kosten der Stromerzeugung nach Berechnungen des Umweltbundesamtes im Durchschnitt derzeit knapp 6 Cent/kWh (ohne Einbeziehung der Kernkraft).
Die Bundesregierung sollte zusätzlich zur Verschärfung der Anforderungen der EnEV das CO2-Gebäudesanierungsprogramm so weiterführen und ergänzen, daß die jährliche Sanierungsrate möglichst bald auf 2,0 % steigt.
"Ein 25 Jahre alter Heizkessel verbraucht im Schnitt 30 % mehr Erdgas oder Heizöl als ein moderner Gas- oder Ölbrennwertkessel. Bei den heutigen Energiepreisen zahlt sich die Investition [in einen solchen Kessel] bereits nach 7 Jahren aus."
Bis 2020 können in Gebäuden mehr als 30 % der CO2-Emissionen durch verdoppelten Einsatz von Brennwertkesseln und erneuerbaren Energien im Wärmemarkt eingespart werden.]
Bislang wurden in Deutschland die Bemühungen zur Energieeinsparung in Wohngebäuden durch die Ausweitung des Wohnflächenkonsums kompensiert. Um diesen Trend nicht weiter zu begünstigen, sollte die Bundesregierung die genannten Instrumente mit dem Abbau der Subventionen im Wohnungswesen flankieren. Abzuschaffen sind die Wohnungsbauprämie und die Arbeitnehmersparzulage für Bausparverträge, zu überprüfen sind die Subventionen zur Förderung der Wirtschafts- und Regionalstruktur. Auch sollten keine neuen, undifferenzierten Subventionen für Wohnungsneubau entstehen, zum Beispiel in Form einer pauschalen Förderung selbstgenutzten Wohneigentums im Zuge der "Riester-Rente".
Gerade Wohneigentum führt erfahrungsgemäß zum Verharren angehender Seniorenhaushalte in der Familienwohnung, nachdem die Kinder ausgezogen sind. Dies mündet in einem hohen Pro-Kopf-Wohnflächenkonsum betagter Ein- und Zwei-Personenhaushalte, während gleichzeitig junge Familien unter Umständen zusätzliche Wohnungen bauen müssen. Dadurch entsteht neue Wohnfläche, die im Winter geheizt und im Sommer ggf. gekühlt werden muss. Zielführender wäre die Förderung des Umzugs von Senioren in kleinere Wohnungen in Lagen mit guter Infrastruktur.
Der Effizienzwettlauf ist eine Kombination aus der Vorgabe von Effizienzstandards und einer Pflichtkennzeichnung, die beide regelmäßig an die Entwicklung der Technik anzupassen sind. Er ist eine Weiterentwicklung der Instrumente "Verbrauchszielwerte" aus der Schweiz und des japanischen "Top-Runner"-Programms.
Deutschland braucht einen Energieeffizienzfonds zur Förderung eines Portfolios verschiedener Energieeffizienz-Aktivitäten, weil die Transaktionskosten bei vielen Einsparmaßnahmen aus Sicht der Akteure relativ hoch sind. ... Ein Vorschlag des Wuppertal Institut für Klima, Umwelt und Energie für die Einrichtung eines Energieeffizienzfonds ist die Ausstattung des Fonds mit einem Finanzvolumen von 5,8 Mrd. Euro in einem Zeitraum von fünf Jahren vor (hauptsächlich von 2006 - 2010, Wuppertal Institut 2005, Ein Energieeffizienz-Fonds für Deutschland, Konzept für einen Energieeffizienz-Fonds in Deutschland, Wuppertal, Februar 2005). Mit diesem Finanzvolumen ergeben sich Einsparungen von 31,5 TWh Strom pro Jahr und mehr als 35 TWh Gas, Öl, Fernwärme und Kohle pro Jahr. Das UBA empfiehlt, den Energieeffizienzfonds vor allem über den vorgeschlagenen Abbau klimaschädlicher Energiesteuervergünstigungen zu finanzieren.
Projekte des World Wildlife Funds
Stop Climate Change - It Is Possible, a short WWF list (in cache) of policy initiatives, business efforts, and actions by individuals
effektive, dynamische Anreizsysteme zur Senkung des Energieverbrauchsim Gebäudebereich und bei Elektrogeräten ("Top-Runner-Ansatz");
einen beschleunigten Ausbau der Erneuerbaren Energien und ein Moratorium für den Neubau von Kohlekraftwerken im Strombereich;
ein Fördergesetz für den Einsatz Erneuerbarer Energien im Wärme- undKältebereich;
eine Verdreifachung des Anteils der hocheffizientenKraft-Wärme-Kopplung auf Basis Erneuerbarer Energien und Erdgas;
strenge gesetzliche Verbrauchswerte für Kraftfahrzeuge und eineBegrenzung der steuerlichen Abschreibungsmöglichkeiten aufverbrauchsstarke Modelle.
Auf dem Weg zu einer Vollversorgung durch klimaverträgliche Erneuerbare Energien, verfolgen die Maßnahmen darüber hinaus das Ziel einer Reduktion der Treibhausgase von mindestens 80 Prozent bis Mitte des Jahrhunderts. "Es geht um nicht weniger als den vollständigen Umbau unserer Energieversorgung", so Rainer Baake, Bundesgeschäftsführer der Deutschen Umwelthilfe (DUH).
Eckpunktepapier der Regierung stellt Weichen auf Scheitern - DUH fordert Vorrang für Klimaschutz (im Cache) vor Partikularinteressen strukturkonservativer Sektoren der Industrie und präsentiert eigene Vorschläge - Bundesregierung soll CO2-Minderungsbeiträge ihres Klimaschutz-Programms offen legen, Pressemitteilung, 20.08.2007
Pläne der EU-Kommission und der deutschen Regierung
Emissionszertifikate: Carbon Dioxide Cap and Trade
Emissions Trading: How does it work?
Emissions trading offers a market-based approach to achieve environmental policy goals by providing financial incentives to reduce emissions and other pollutants.
The central emissions trading mechanism is known as cap-and-trade. Under such a program, a government or other authority establishes a total limit - known as the cap - on the targeted pollutant based on a prior emissions year. Emitters are given an emissions target, generally on an annual basis, which they are required to meet. Using both carrots and sticks, cap-and-trade typically includes a penalty structure in the event of non-compliance.
Emitters that need allowances can make up for the shortfall by buying permits from other allowance holders who have a surplus. However, the total cap on how much can be emitted annually stays constant, ensuring that while some emitters may increase emissions, society benefits through an annual reduction in the overall level of emissions covered by the program.
In addition to domestic reductions, an emissions trading program may also permit the use of so-called offset permits. The Clean Development Mechanism (CDM) is currently the largest offset market and encourages the transfer of clean energy technologies by implementing emissions reduction projects in developing countries. At the same time it allows the developed world to finance the required emissions reductions at a lower cost as it is generally cheaper to abate greenhouse gas emissions in the developing world.
Der Emissionshandel in Deutschland erfasst rund 55 % der [deutschen totalen] CO2-Emissionen [also 55 % von durchschnittlich 972 106 t CO2e pro Jahr im Zeitraum 2008-2012] (Quelle: Nationaler Allokationsplan NAP 2008-2012, 2006, Cache).
Für das Emissionsbudget von 972 106 t CO2 -Äquivalente (CO2e) pro Jahr ergibt sich die in dieser Abbildung dargestellte Aufteilung nach Treibhausgasen und Sektoren (GHD = Gewerbe, Handel und Dinstleistungen, EH = Emissionshandel).
The European Union Emission Trading System (EU ETS) is Europe's flagship policy to fight climate change and the largest carbon emissions trading program in the world. The EU ETS brings together 30 countries (the 27 EU Member States plus Iceland, Liechtenstein and Norway) and covers CO2 emissions from over 11,000 installations. These include power stations, combustion plants, oil refineries and iron and steel works, as well as factories making cement, glass, lime, bricks, ceramics, pulp, paper and board.
The EU ETS runs in phases: 2005-2007 (Phase I), 2008-2012 (Phase II, coinciding with the first commitment period of the Kyoto Protocol), 2013-2020 (Phase III), etc. There is no end date to the EU ETS. By linking to the Kyoto Protocol, the EU ETS allows companies to use international offset credits to meet part of their compliance target. These offsets are known as Certified Emission Reduction units (CERs) and Emission Reduction Units (ERUs).
The legal framework underpinning the European carbon market, Directive 2003/87/EC, grants the holder of one EU Allowance (EUA) the right to emit one tonne of CO2. Approximately 2 109 EUAs are capped annually under the EU ETS, representing about 50% of EU's total CO2 emissions. Currently, EU Member States allocate the majority of the EUAs free of charge but this will change in Phase III (2013) when auctioning becomes the main allocation method. In addition, the EU ETS will expand its current scope by including petrochemicals, ammonia and aluminium industries and two additional greenhouse gases (nitrous oxide and perfluorocarbons) in the program from 2013. Airlines will also be subject to compliance requirements beginning in 2012.
Since carbon trading took off in Europe, trading volumes and underlying asset values have grown beyond expectations. The EU ETS was valued at over Euro100 109 ($140 109) in 2010, up from Euro7 109 ($10 109) in 2005. The global carbon markets saw transactions of 8.7 109 tonnes of CO2e in 2010 where the EU ETS accounted for 80% (Source: World Bank). By any measure, carbon has grown impressively to establish itself as a new commodity that is here to stay.
The California Emissions Trading Scheme (Cal ETS), cache
On October 20, 2011, The California Air Resources Board (ARB) finalized the rules for the state's greenhouse gas market-based compliance program. The California Emissions Trading Scheme (Cal ETS), which will govern sources that attribute approximately 85% of California's emissions, is scheduled to begin on January 1, 2013, after being delayed one calendar year. With 2.5 billion allowances under the cap between 2013 and 2020, California's cap and trade program will be the largest program in North America, and second only to the EU ETS in the world.
The program is divided into three multi-year compliance periods. The first compliance period (2013-2014) will cover electricity generating and industrial facilities exceeding 25,000 MT CO2e per year. The second (2015-2017) and third (2018-2020) compliance periods will include transportation fuels.
Cap and Trade in Deutschland
"Deutsche und andere europäische Stromversorger haben in der ersten Handelsperiode des Emissionshandels (2005 - 2007) bereits kostenfrei zugeteilte Emissionszertifikate in Milliardenhöhe an ihre Kunden weitergereicht. Dies setzte sich in der zweiten Handelsperiode fort.
In der zweiten Handelsperiode des EU-Emissionshandels (2008 - 2012) bekommen die Stromversorger in Deutschland 68 % ihrer benötigten Emissionsmengen frei zugeteilt - das sind Zertifikate für jährlich 230 Millionen Tonnen CO2. Die zusätzlich benötigten Mengen müssen die Unternehmen ersteigern, auf dem Markt zukaufen oder über Investitionen in Klimaschutzprojekte in Entwicklungsländern (Clean Development Mechanism, CDM-Projekte) erwerben.
"Die Kommission fordert, dass Stromerzeuger die Emissions-Zertifikate ab 2013 vollständig ersteigern müssen, für die übrige Industrie soll dies bis 2020 schrittweise eingeführt werden.
[die] Bundesregierung ... möchte, dass
Branchen jenseits des Stromsektors dauerhaft nur 20 Prozent der Zertifikate ersteigern müssen.
... den größten Verschmutzer-Industrien wie Stahl, Zement oder Chemie ("energieintensive Industrie") möchte sie die Rechte sogar ganz kostenlos zuteilen.
Insgesamt würden dann für 94 Prozent der deutschen Industrie Ausnahmen geschaffen. Völlig ungerechtfertigt! Das Argument der Verschmutzer-Lobby, die den Verlust internationaler Wettbewerbsfähigkeit und von Arbeitsplätzen durch teure Zertifikate an die Wand malt, ist fadenscheinig. Die Hersteller von Zement, Glas und Stahl stehen kaum unter internationalem Wettbewerbsdruck (WWF-Hintergrund).
Clean Development Mechanism in Deutschland
Geht es nach dem Willen der Bundesregierung, sollen die EU-Staaten und Unternehmen für Klimaschutzprojekte in Entwicklungs- und Schwellenländern (sog. CDM-Projekte, 'Clean Development Mechanism') Gutschriften erhalten, die sie zum Ausstoß von Treibhausgasen in Europa ermächtigen.
by
Joos F et al., "An efficient and accurate representation of complex oceanc and biospheric models of anthropogenic carbon uptake",
Tellus, 48B, 397-417, 1996;
Shine et al., "Alternatives to the global warming potential for comparing climate impacts of emissions of greenhouse gases", Clim. Change, 68, 281-302, 2005, see equation given in figure.
"... estimates of the characteristic 'residence time' of a molecule of carbon dioxide in the atmosphere involve a complicated mélange of factors, leading to the conclusion that
although almost half of newly added carbon dioxide molecules remain for only a decade or two,
roughly a third stay for a century or more, and
fully one fifth for a millennium"
(see, e.g., Atmospheric Chemistry and Physics, Vol. 7 (2007), pp. 2287-2312).
"[the Bern Carbon Cycle equation] should be viewed as an approximate lower bound for the portion of fossil fule CO2 emissions that remain airborne.
This is why the residence time of such molecules is generally characterized as a century."
Source: Robert M. May (Former President of the Royal Society (2000-2005), Chief Scientific Adviser to the British Government (1995-2000),
Oxford, England), How Long Will They Stay (in cache)
"Jeder Deutsche verbraucht täglich im Schnitt weniger als 130 Liter Wasser im Haushalt. Der virtuelle Wasserverbrauch liegt jedoch bei 4.000 Litern pro Person und Tag. Und mehr als die Hälfte dieser virtuellen Wassermenge wurde importiert."
(Quelle: WWF-Deutschland, Wasser-Fußabdruck, 2009)
BY LEN ACKLAND | 22 JANUARY 2010
... some conservative politicians coupled support for lengthened reactor lifetimes with the demand that utilities contribute as much as one-half of the windfall profits that longer-running reactors would generate into a fund aimed at further developing renewable energy, which now provides 15 % of German electricity. (An eight-year extension for all 17 reactors could lead to as much as $66 billion in profits depending on factors including the price of electricity, according to the Ecological Institute [Umweltbundesamt].) Volker Kauder, the chairman of the Christian Democrats, reiterated that demand after the election by calling for the industry to finance a roughly $60 billion-$70 billion renewable energy fund.
Ackland is an associate professor in the School of Journalism and Mass Communication at the University of Colorado at Boulder and is founding director and current co-director of the school's Center for Environmental Journalism. He was editor of the Bulletin from 1984 to 1991 and is the author of Making a Real Killing: Rocky Flats and the Nuclear West.
... "Zuletzt berieten die Partei- und Koalitionsspitzen dem Vernehmen nach ein Modell, wonach
7 ältere Meiler noch 8 Jahre länger als bisher vorgesehen am Netz bleiben könnten.
10 neuere Reaktoren könnten dann noch 14 Jahre länger Strom liefern.
Im Durchschnitt würde dies also eine Verlängerung der Laufzeiten von 12 Jahren ergeben.
Nach dem Ausstiegsbeschluss von Rot-Grün würden die letzten Meiler etwa im Jahr 2025 abgeschaltet.
Es soll zudem dabei bleiben, dass die Atomkonzerne Eon, RWE, EnBW und Vattenfall ab 2011 eine Steuer von jährlich 2,3 Milliarden Euro an den Bund zahlen. Allerdings wird diese Abgabe wohl befristet - die Rede war zuletzt von 4 bis 6 Jahren.
Weitgehende Einigung gab es über die Abschöpfung der Zusatzgewinne der Atomkonzerne bei längeren Laufzeiten. Neben der Steuer werden die Unternehmen nach dem Willen der Regierung zeitgleich "vertragliche Sonderzahlungen" in einen Fonds für Ökoenergien leisten.
Diese Sonderzahlungen sollen zunächst pro Jahr zwischen 200 und 300 Millionen Euro liegen.
Nach Auslaufen der Atomsteuer sollen diese Zahlungen in den Fonds später etwa auf das Volumen der Steuer von jährlich 2,3 Milliarden Euro anwachsen."
Nach Informationen der Nachrichtenagentur dpa sind die Kosten für die mögliche Nachrüstung auf 500 Millionen Euro je Kernkraftwerk begrenzt. Auch würden sich die Zahlungen der Konzerne für den neuen Ökostrom-Fonds reduzieren, wenn eine künftige Regierung die 2016 auslaufende Atomsteuer verlängern oder erhöhen will.
Hier haben die schwarz-gelbe Koalition und die Atombetreiber E.on, RWE, EnBW und Vattenfall eine Sperre eingebaut, um Rot-Grün bei einem möglichen Wahlsieg Änderungen am Atompaket für längere Laufzeiten zu erschweren. In dem Vertrag heißt es laut dpa, dass die für die nächsten Jahre zugesagten Öko-Förderbeiträge sich verringern, "wenn eine Kernbrennstoffsteuer (...) für eine längere Dauer als in den Jahren 2011 bis 2016 erhoben oder wenn eine anderweitige Steuer, Abgabe oder sonstige Belastung eingeführt, begründet oder erhöht wird".
Der Förderbeitrag mindert sich für das laufende und für künftige Jahre,
wenn insgesamt oder für das jeweilige KKW (Kernkraftwerk)
Bestimmungen zur Laufzeitverlängerung und zur Übertragbarkeit von Elektrizitätsmengen (...) geregelt, verkürzt, verändert, unwirksam oder aufgehoben werden oder in sonstiger Weise entfallen
oder ab dem 6. September 2010 gestellte Nachrüstungs- oder Sicherheitsanforderungen einen Gesamtbetrag von 500 Mio. Euro für das betreffende KKW überschreiten,
um den Betrag, um den
die Änderung
oder die weiteren Nachrüstungs- oder Sicherheitsanforderungen
bezogen auf die restlichen LZV- (Laufzeitverlängerungen)-Elektrizitätsmengen die Kosten je MWh (Megawattstunde) für das betreffende KKW erhöhen, oder
wenn
eine Kernbrennstoffsteuer oder eine ähnliche Steuer
oder für eine längere Dauer als in den Jahren 2011 bis 2016 erhoben
oder wenn eine anderweitige Steuer, Abgabe oder sonstige Belastung eingeführt, begründet oder erhöht wird, durch die eine Zahlungspflicht im Zusammenhang mit dem Kernbrennstoffkreislauf (einschließlich Entsorgung), der Elektrizitätserzeugung aus Kernenergie begründet oder erhöht wird,
um den Betrag der sich daraus ergebenden zusätzlichen Belastung je MWh.
Jährliche Gewinne (nach Roland Koch und Günther Öttinger) und jährliche Abgaben aller 17 deutschen Kernkraftwerke zusammengenommen.
Die Gewinne steigen bei gleichbleibender Brennelemente-Steuer, wenn man die Brennelemente stärker ausnutzt (d.h. den sog. Abbrand erhöht).
Der Öko-Förderbeitrag (*)
kann um die Kosten der Sicherheits-Nachrüstung reduziert werden, die 500 Millionen EURO übersteigen.
soll nach Auslaufen der Brennelemente-Steuer etwa auf das Volumen dieser Steuer anwachsen.
"Wir gehen davon aus, daß die Kosten für Nachrüstung 500 - 600 Millionen EURO pro KKW ausmachen... " (Norbert Röttgen).
Die Aufsichtsbhörden der Länder seien einfach zu schwach besetzt und vertrauten daher zu sehr auf externe Gutachter. "Ich bin fest davon überzeugt, das ist alles ein Gerede um die Sicherheit. Da wird praktisch nichts passieren." (Wolfgang Renneberg, ehemaliger Abteilungsleiter "Reaktorsicherheit" im Bundesumweltministerium)
Nach Angaben aus Regierungskreisen ist in dem Papier auch festgelegt, dass der den Konzernen abverlangte Sonderbeitrag für Umwelt- und Klimaschutz höher ausfallen soll, falls deren Gewinne größer als erwartet sein sollten.
Nach einem Bericht der "Financial Times Deutschland" würde der Staat dann, wenn die Großhandelspreise an der Leipziger Strombörse 63 Euro je Megawattstunde (0.063 Cents/kWh) überschreiten, die Hälfte der Differenz abschöpfen. Mit dem Geld will der Bund einen Fonds zur Förderung erneuerbarer Energien und zur Verbesserung der Energieeffizienz aufbauen.
Durch Erhöhung des Abbrands (d.h. längere Verwendung der Brennelemente) steigert man den Gewinn bei konstanter Brennelemente-Steuer.
Definition:
Abbrand (burnup) ist die vom Kernbrennstoff erbrachte thermische Energie, Einheit: GWth d/tHM.
HM (heavy metal) bedeutet Schwermetall.
Brennelemente bestehen aus Kernbrennstoff (z.B. dem Oxid des Schwermetalls Uran, eingesetzt als Pellet) und Strukturmetall. Die Masse des Oxids wird in die in ihm enthaltene Masse an Schwermetall umgerechnet, und auf diese Weise wird die Masse des Kernbrennstoffs in tHM angegeben.
3 % des im Leichtwasserreaktor verwendeten Schwermetalls Uran ist das Uranisotop U235, also 30 kg U235/tHM.
Voraussetzungen/Daten:
Abbrand von Leichtwasserreaktoren (Druckwasserreaktoren): 30 GWth d/tHM ... 60 GWth d/tHM.
Die Bundesregierung setzt -nach Pressemitteilungen- offensichtlich bisher (Stand September 2010) den minimalen Abbrand an: 30 GWth d/tHM.
Brennelemente-Steuer: 145 EURO pro g U235.
Die Steuer bezieht sich auf den Brennstoff (Uran), nicht auf die erzeugte Energie. Sie ist also keine Besteuerung des vom KKW erwirtschafteten Gewinns; denn bei gleichbleibender Menge des Brennstoffs kann die erzeugte Energie zwischen 30 GWth d/tHM und 60 GWth d/tHM variieren (s. Burnup History).
Typische jährliche Beladung eines KKW mit Kernbrennstoff (HM): 900 GWth d/ Abbrand = 900 GWth d / (30 GWth d/tHM) = 30 tHM/Jahr
Resultat:
Brennelemente-Steuer (in EURO) = jährliche Beladung (in tHM/Jahr) * Gewicht U235 pro tHM (in g U235/tHM) * 145 EURO/g U235.
Beispiel: Brennelemente-Steuer für
1 KKW: 30 tHM/Jahr * (30 kg U235/tHM) * (145 EURO/g U235) = 130 Millionen EURO/Jahr.
17 deutsche KKWs: 17 * 130 Millionen EURO/Jahr = 2.2 Milliarden EURO/Jahr.
09/11/03: Joint press release by WWF Germany, Allianz SE and the Potsdam Institute for Climate Impact Research (PIK)
... If the costs of climate protection [1] are offset against the benefits of economic growth, the difference is about one year of delayed economic growth for Europe by 2050. The level of prosperity that is forecast for 2050 would thus be reached in 2051 when the costs of climate protection are factored in. But this does not yet take into account the costs of damages caused by climate change that would be averted. Unless we act in the coming decade, RECIPE (Report on Energy and Climate Policy in Europe) predicts that not only will the costs of reducing global CO2 levels rise, but the chances of still being able to stop the dangerous consequences of climate change will fall dramatically. After 2020, the window for ambitious climate protection will close entirely.
To help guide government leaders at the climate talks in Copenhagen, RECIPE is calculating possible cost distribution models for climate protection in six regions of the world. The findings make it clear that effective climate protection at low costs is achievable only if we act without delay. Concrete paths toward reducing CO2 in these regions are designed to provide a stable environment in which appropriate incentives will quickly develop - not only for the necessary investments in new technologies but also for research and transfers to emerging countries. A cost-optimal mitigation strategy for the transformation of the energy sector alone requires an increase of investments in low-emission technologies to an annual level of 400 to 1,000 billion by 2030, most of which would have to be provided by the financial markets and industry.
The overwhelming importance of investing in the transformation to a low-carbon economy provided the Allianz-WWF climate partnership with the impetus to support the RECIPE study. "There is no other market that needs and will experience such a sudden and sustainable growth in investments in the next ten years as the market for climate protection and the decarbonization of the economic processes", says Joachim Faber, member of the Allianz SE Board of Management and CEO of Allianz Global Investors. "But the willingness of our customers to invest depends upon reliable conditions. It is now up to governments to provide these conditions. This includes not only reliable paths toward reduction targets but market-based economic elements such as
the auctioning of all CO2 certificates,
the establishment of global cap and trade systems,
rapid implementation of the EU Directive to promote renewable energies that guarantees investors reliable feed-in tariffs, and stronger subsidies for research into low carbon technologies."
Another reason for Allianz to be closely involved in climate protection is the fact that in global industry, 40% of insured losses are now attributable to climate effects, and this number is rising.
[1] According to RECIPE assumptions, CO2 emissions without climate protection measures would grow to 2,500 metric gigatons (Gt) by 2050 and result in a global rise in temperature of up to 7 C over pre-industrial levels. The latest scientific findings suggest that to achieve a high probability of limiting the rise in global temperature to 2 C, additional emissions until 2050 must be held below 750 GtCO2 [330 GtC].
Carbon Resources: more than 11 000 GtC in the ground
Remaining atmospheric deposit: 330 GtC within 21st century
Issues [Prof. Dr. Ottmar Edenhofer (chief economist of the Potsdam Institute for Climate Impact Research (PIK) and Chairman of the Response Strategies Working Group of the Intergovernmental Panel on Climate Change (IPCC)), Dr. Nico Bauer]:
dividing the global budget (330 GtC = 750 GtCO2) into national budges by interntional negotiations
international and intersectoral permit trade for cost-effective achieving of the budget
The Coalition for Energy Solutions is dedicated to providing solid numerical analysis of energy choices. Too often, energy debates descend to energy-bashing, with heated rhetoric instead of analysis. The Coalition for Energy Solutions is a group of energy professionals dedicated to understanding various energy scenarios, and presenting the feasibility, basic environmental effects, and costs in a clear and objective fashion.
In 2008, Germany's power production was 611.9 TWh, of which
about 40.4 TWh, or 6.6%, was from wind,
about 22 TWh, or 3.6%, was from biomass (mostly wood),
about 21 TWh, or 3.4%, was from hydro, and
about 4.5 TWh, or 0.7%, was from PV solar. In 2009 the PV solar production was about 7.1 TWh, or 1.1%.
The German experience shows the economics of utility-size wind and PV solar power are such that utility-size wind provides about 6 times the power of PV solar for less than one third the subsidies spent on PV solar.
Nations with high wind power production are
Spain (12% of production),
Portugal (15.2%) and
Denmark (21% of which 9% is consumed by Denmark, 12% is exported to Sweden and Norway for smoothing by their hydro plants for a fee. In Denmark the power output, on/off status, and many other operating data of each and every wind turbine are monitored from a single command center to control power output and its variation and to schedule maintenance).
The following is probably an example of misleading data: given is a snapshot in time that does not reflect the smoothed situation as do the numbers for Spain, Portugal and Denmark above.
"Speaking at the opening of the World Future Energy Summit in Abu Dhabi in the United Arab Emirates (17. - 20. January 2011) today, Energy Minister Eamon Ryan TD told delegates how Ireland had just reached a new wind energy record."
"As I was leaving Ireland yesterday, we reached a new record in electricity coming from our wind," he said. "Wind energy output was 1250 MW, powering over 800,000 homes."
(Source: Minister Ryan tells energy summit of Irish wind energy record, Business & Leadeship, 17.1.2011)
"Integrating large scale wind power generation into an existing power grid is no easy task. In recent years, Ireland has aggressively developed wind power generation projects. Today, roughly 35% of Ireland's domestically generated power comes from wind farms. As Ireland has expanded their variable wind generation capabilities, they have learned that this type of power adds a layer of complexity to the operation of the power grid that was not present in earlier times. As it turns out, the ability to reliably operate the grid with large portions of variable wind power is a key constraint. According to the minister, migrating to high %ages of variable wind power generally requires major investments in the infrastructure of the underlying power grid. The minister maintains that these investments are so difficult to swallow, because they are not glamorous or high profile in nature.
In the future, Ireland will forge ahead with plans to continue to expand it wind generation capabilities. Continued expansion will bring along new challenges. Above a level of about 50% wind generation, Ireland will need to be interconnected to a larger system in order to maintain grid stability. This means that Ireland will need to build an interconnection with one or more neighboring electrical grids.
In the past, the idea of interconnecting the European power grids has not been widely accepted, but according to the minister [Eamon Ryan, Ireland's Minister for Communications, Energy & Natural Resources], this is an idea whose time has arrived. The minister shared that there has been a change in thinking among the EU's Council of Ministers in the last three years. He feels as though the EU now understands that it needs to build an interconnected grid. He spoke of the interconnection plans that are now being drawn up at the EU Council of Ministers level. In the coming years, Mr. Ryan believes that the EU will approve and build an interconnected grid." (Source: Damon Jones, "Irish Lessons in Wind Power", January 18, 2011)
The reason these high %ages work for these nations [Spain, Portugal & Denmark] is that a sufficient capacity of quick-responding pumped storage hydro plants are available to economically smooth their wind power. Spain and Portugal are also using quick-responding combined cycle gas turbine, CCGT, plants to smooth their wind power.
CCGT plants (Gas-und-Dampf-Kraftwerke, GuD)
CCGT plants are up to 60% efficient vs about 30%efficient for a coal plant, and
emit 0.5 lb CO2/kWh vs 2.0 lb/kWh for a coal plant.
To smooth variable, intermittent wind power
CCGT plants can vary their output without damage at about 4%/min and
hydro plants at about 100%/min.
[Spinning reserves
Source: Willem Post, "Impact of variable, intermittent power on grids" (in cache)
At all times some power plants are in spinning reserve mode, i.e., producing enough power to keep themselves running; they provide power to the grid in a fraction of a second in the event a power plant has an unscheduled outage. Other power plants are in standby mode; they usually are started each day to provide power during peak demand periods.
Spinning reserves - regulation velocity
nuclear plants - less than 1%/min,
thermal plants - 1%/min;
combined cycle gas turbines - 2.5%/min;
simple cycle gas turbines - 4%/min,
hydro plants with or without pumped storage - 100%/min]
Portugal's 2009 power production is from
gas 38.6%,
coal 21.4%,
hydro 17.1%,
wind 15.2%, and
other renewables 6.4%
Pumped storage hydro plants tied in with wind farms is by far the lowest cost renewable power arrangement, as proven by Denmark, Spain and Portugal during the past 10 years.
Germany's power plant capacity is about 133 GW. Germany's electric power grid is strongly connected to nearby grids. It is designed as they do their cars, etc., unlike the grid of the US which is a state-by-state patchwork of public-private grids. As a result Germany can handle 6.6% of variable, intermittent wind power AND have one of the lowest outage rates in the world. Germany has insufficient hydro plants and relies mostly on CCGT plants and a well-designed electric power grid to smooth its wind power.
BY BRUCE BIEWALD | 13 JULY 2011, Bulletin of the Atomic Scientist
Biewald is President and CEO of Synapse Energy Economics. Synapse conducts energy planning and policy analyses for a wide range of clients, including agencies of the US government, states, non-governmental organizations, and others. Synapse's recent projects include an analysis PDF for the Civil Society Institute of the benefits of transforming the electric power industry by 2050; the study uses cost data from recent projects wherever possible, and includes the costs of integrating large amounts of variable generation into the US power system, as well as the costs of new transmission needed to deliver renewable energy
A step in the right direction. Responding to these and other data, the US Energy Information Administration (EIA) has in the last year revised its assumed costs of new nuclear power plants, placing more emphasis on data from actual projects. EIA revised upward its assumed "overnight" cost of new nuclear units by 37 %, from $3,902 to $5,339 per kilowatt. ("Overnight" costs do not include interest during construction.) This is a move in the right direction, but cost forecasts should be revisited frequently to ensure that they reflect the latest data and trends.
Moreover, it is important to consider the effects of subsidies when costing out various technologies for a study designed to inform long-term energy policy. Consumers pay the full cost of any new resource, whether they pay this cost through electricity rates or through their tax dollars. Quantifying the value of a $5 billion or $10 billion taxpayer loan guarantee is difficult, but it should not be ignored in responsible energy policy-making.
We need to do careful and current research on all resource types -- not just nuclear. For example, the cost of new wind projects fell to very low levels in the mid 2000s -- with the cheapest projects at or below $1,700 per kilowatt, or about 5 cents per kilowatt-hour [1700 $/kW / (0.05 S/kwh) = 34000 h]. But the cost of new wind began trending up again in the late 2000s and has remained well above the lows of the last decade. The most economical new wind projects today are coming in at 7 cents to 8 cents per kilowatt-hour.
Photovoltaics, on the other hand, have seen dramatic cost reductions since mid-2009. Again, focusing on real market data:
In 2009 and 2010, pursuant to a feed-in tariff (a posted offer to purchase renewable energy), the Sacramento Municipal Utilities District received offers for 100 megawatts of photovoltaic capacity in the range of 14 cents per kilowatt-hour.
In early 2011, Southern California Edison reported bids for more than 2,500 megawatts of photovoltaic capacity at or below the time-of-use-adjusted Market Price Referent (MPR) in California. The MPR is an avoided cost number used by utilities in California to evaluate bids from potential power projects. The on-peak MPR in 2010 was in the range of 13 cents per kilowatt-hour.
All of these photovoltaic prices include a federal subsidy, so actual project costs are likely to be 3 cents to 4 cents per kilowatt-hour higher. But clearly photovoltaic costs have reached a major inflection point, and it will be crucial to stay abreast of these costs over the next several years and to rely on current data.
"Element Power, a wind turbine project investor/developer, has made a proposal to locate 3,000 MW of wind turbines, say 1,000 @ 3 MW each, arranged in ten 300 MW clusters of 100 wind turbines each, in the Irish Midlands by the end of 2018. The wind turbines would be about 459-ft tall and have 373-ft diameter rotors. The wind turbine clusters would be in the counties of Meath, Westmeath, Laois, Offaly and Kildare. All of the wind energy would be exported to the UK.
Element Power estimated the useful service life of the proposed system at 25 years. Element Power stated the proposed system would be entirely independent of the Irish grid. ..."
"Relatively recent analysis of wind turbine operating records shows a degradation of capacity factors (CF) of about 1-2 % per year, due to wear and tear and increased maintenance outages as the years progress (as with an older car engine getting less mileage and needing more maintenance), i.e., the Element Power assumed CF of 0.381 taken from Vendor brochures is highly optimistic, and even the more likely CF of 0.33 may still be optimistic. Parasitic power and turbulence interference between wind turbines further degrades CFs."
That is what Marty Weitzman thinks we should do about climate change.
This came up at the World Bank event I wrote about yesterday. During the Q&A session a World Bank employee came to the mic and said that the Bank would likely soon adopt a social cost of carbon (SCC) to use when evaluating its projects, and what SCC would Weitzman recommend?
Weitzman hemmed and hawed and noted that the whole point of his paper was that there are these big uncertainties, and that previous attempts to calculate the socially optimal price on carbon haven’t accounted for these and thus are wrong, and that you couldn’t even really do the calculation with the current tools we have. But he finally acknowledged that if you made him philosopher-king and demanded an answer he would say that the price on emissions (i.e. a carbon tax or the price of a cap-and-trade permit) should be $50 per ton of CO2, rising at rate of a few % over inflation.
A few thoughts:
1. Muse about uncertainty all you want, but ultimately you have to name your price.
2. This is higher than a lot of mainstream economists who work on this issue. Bill Nordhaus thinks the right value today is around $10 per ton of CO2 (see Table 5-4 of this publication); Billy Pizer at RFF thinks it is close to double this (ungated version here, see Table 5 (3 in gated version) suggesting the correct valuation is 82% higher). On the other hand Nic Stern estimates it should be $80 per ton of CO2.
3. Carbon prices in Europe are currently about 70% of this level (thanks partially to the weak dollar).
4. Carbon prices in the U.S. are short of this mark by about… oh, that’s right, $50.
This entry was posted on April 2, 2008 at 5:54 am and is filed under Cap and Trade, Carbon Tax, Climate Change.
You can follow any responses to this entry through the RSS 2.0 feed.
To convert tonC to tonCO2, multiply tonC by 3.667 (C = 12 g/mol, O2 = 32 g/mol -> (12 + 32)/12 = 3.667).
click on thumbnail to enlarge
Figure: Global CO2 Emissions from Fossil-Fuel Burning, Cement Manufacture, and Gas Flaring: 1751-2008.
Units: MtC, except emissions per capita, which is given in units tC/person
Source: ORNL-Carbon Dioxide Information Center CDIAC (in cache)
click on thumbnail to enlarge
Source: ORNL-Carbon Dioxide Information Center CDIAC
Total carbon emissions have increased from 6.151 GtC (22.55 GtCO2) in 1990 to 8.749 GtC (32.0 GtCO2) in 2008, i.e. by 42% (of the 1990 level). Contributions by cement production and gas flaring:
cement production: 2008 emissionscement = 3.8 x 1980 emissionscement,
gas consumption: 2008 emissionsgas = 2.2 x 1980 emissionsgas,
gas flaring: 1992 emissionsflaring = 0.42 x 1980 emissionsflaring
2008 emissionsflaring = 0.86 x 1980 emissionsflaring,
1955 CO2 emissions per capita = 2.35 tCO2/person, 2008 CO2 emissions per capita = 4.77 tCO2/person.
click on thumbnail to enlarge
Figure: German CO2 Emissions from Fossil-Fuel Burning, Cement Manufacture, and Gas Flaring: 1751-2008
Units: ktC, except emissions per capita, which is given in units tC/person
Source: ORNL-Carbon Dioxide Information Center CDIAC (in cache)
click on figure to enlarge
Source: ORNL-Carbon Dioxide Information Center CDIAC
German carbon emissions have increased from 139,384 MtC (488 MtCO2) in 1950 to 214.524 MtC (750.0 MtCO2) in 2008, i.e. by 35% (of the 1950 level).
1950 CO2 emissions per capita = 7.14 tCO2/person, 2008 CO2 emissions per capita = 9.13 tCO2/person.
Ziel des Global Framework for Climate Services (GFCS) sei, den weltweiten Austausch von Wissen über den Klimawandel zu vertiefen. Vor allem aber solle für die gegenseitige Hilfe bei der Anpassung an die Klimaänderung ein internationaler Rahmen geschaffen werden. Becker: "Wir nennen das Capacity Building. Das soll vor allem den ärmeren Ländern helfen, sich bei der Anpassung selbst zu helfen. Hat GFCS Erfolg, wird das langfristig - und das ist nicht nur ein moralisches sondern auch ein sicherheitspolitisches Argument - auch den Industriestaaten helfen. Ich nenne hier nur das Stichwort Klimaflüchtlinge." (Dr. Paul Becker, Vizepräsident, Deutscher Wetterdienst (DWD)).
Source: Deutscher Wetterdienst, Press Release
Abb. 2: Anomalien der Lufttemperatur in Nordamerika im März 2012
"Schon der Winter 2011/2012 (Dezember bis Februar) war auf dem nordamerikanischen Kontinent ungewöhnlich mild, wobei der Schwerpunkt der höchsten Temperaturanomalien imwestlichen Kanada lag (vgl. Abb. 1). Aber auch in den US-Grenzstaaten Minnesota (MN)undNorth Dakota (ND) traten Abweichungen bis zu 6 K zu den Mittelwerten der internationalenReferenzperiode 1961-1990 auf. Insgesamt war der Winter im Gebietsmittel der USA (ohneAlaska und Hawaii) der viertwärmste. "
"...[V]om Nordosten der USA bis in den Süden Kanadas [lagen die] Monatsmitteltemperaturen ... um 6 bis 10 K über den Mittelwerten des Referenzzeitraums (vgl. Abb. 2). Diegrößten Abweichungen wurden mit mehr als 11 K in den mittleren und nördlicheren USPrärien westlich der Großen Seen in den Staaten Minnesota (MN), Süd-Dakota (SD), Nebraska (NE) und Iowa (IA) verzeichnet. Für 25 US-Staaten östlich der Rocky Mountains war dieser März der bisher wärmste März. In 15 weiteren Staaten fiel er unter die 10 wärmsten.
Das außergewöhnlich hohe Temperaturniveau war vor allem auf die Wetterlage vom 11. bis22. März zurückzuführen (s.u.). Zur Monatsmitte stiegen die Temperaturen in den nördlichenPrärien auf Werte um 25 oC und darüber. Am wärmsten war es vom 18. bis 22. März, alsregional sogar Höchstwerte um 30 oC (u.a. Chicago/Illinois: 30,6 oC, Norfolk/Nebraska:31,1oC) erreicht wurden. In der Osthälfte der USA und im Süden Kanadas wurden damit diebisherigen Rekordwerte erreicht oder neue Rekorde für die Tageshöchst- und auch für dieNachttemperaturen im März erzielt. Nach vorläufigen Auswertungen der NOAA (NationalOceanic and Atmospheric Administration) wurden über 15.000 neue Wärmerekorde verzeichnet und über 100 Jahre alte Rekorde gebrochen. Vor allem in den Bundesstaaten Michigan und Maine lagen die neuen Maximumtemperaturen teilweise um mehr als 10 K überden bisherigen. Auch die tiefsten Nachttemperaturen waren teilweise um mehr als 10 K höher als die bisher höchsten Nachttemperaturen. Die Nächte waren vor allem in den USStaaten Minnesota und Wisconsin so ungewöhnlich mild, dass die Minimumtemperaturenteilweise sogar über den bisherigen Rekord-Höchsttemperaturen lagen. Nähere Einzelheitenenthält der Bericht "March 2012 Heat Wave" des National Climate Data Center (NCDC). Besonders bemerkenswert ist, dass die Rekordwerte um die Monatsmitte auftraten, wo es imMittel noch deutlich kühler ist als am Monatsende. Weitere Rekorde brachte z. B. auch dieAnzahl der Tage mit 80 oF (26,6 oC). "
Source: C. Lefebvre, März 2012 - der wärmste März der USA
Was der Strom wirklich kostet Vergleich der staatlichen Förderungen und gesamtgesellschaftlichen Kosten von Atom, Kohle und erneuerbaren Energien
Überarbeitete und aktualisierte Fassung, Oktober 2012
Forum Ökologisch-Soziale Marktwirtschaft im Auftrag von Greenpeace Energy und dem Bundesverband WindEnergie e.V. (BWE)
"Für die externen Kosten von Kohle, Erdgas und erneuerbaren Energien wird auf die Ergebnisse einer aktuellen Studie des Fraunhofer ISI Instituts im Auftrag des Bundesumweltministeriums zurückgegriffen (Fraunhofer ISI 2012). Diese Werte wird auch das Umweltbundesamt in der in Vorbereitung befindlichen Neuauflage 2012 der Methodenkonvention zu externen Kosten aufgreifen. Danach betragen die externen Kosten der Stromproduktion aus
Steinkohle 8.9 Ct/kWh,
Braunkohle 10.7 Ct/kWh,
Erdgas 4.9 Ct/kWh,
Wind 0.3 Ct/kWh,
Wasser 0.2 Ct/kWh,
Photovoltaik 1.2 Ct/kWh.
So fallen auch bei erneuerbaren Energien geringe externe Kosten an, wenn man die Herstellung der Anlagen mit dem anfallenden Material- und Energieverbrauch berücksichtigt."
"Für Atomenergie wird weder bei Fraunhofer ISI noch in der Methodenkonvention des UBA ein eigener Wertder externen Kosten angegeben. Die ansonsten verfügbaren Schätzungen liegen sehr weit auseinander. Dashängt vor allem damit zusammen, dass hier Annahmen zur Wahrscheinlichkeit und zu den Folgekosteneines nuklearen Unfalls mit Freisetzung von radioaktivem Material getroffen werden müssen. Zu denexternen Kosten der Atomenergie liegen Schätzungen in der Bandbreite von 0,1 Ct/kWh bis hin zu 320 Ct/kWh vor - die verschiedenen Schätzungen weichen also um den Faktor 3.200 voneinander ab. Aus dieser Bandbreite methodisch fundiert einen "Best Guess" herauszufiltern, ist nach Einschätzung der Autorinnen nicht möglich. Für die externen Kosten der Atomenergie kann lediglich eine verkleinerte Bandbreite, aber kein Punktwert angegeben werden. Für den unteren Wert der Bandbreite wird auf die Hilfslösung des Umweltbundesamtes in der Methodenkonvention zu externen Kosten zurückgegriffen, Atomenergie den Satz des schlechtesten fossilen Brennstoffs - Braunkohle - zuzuordnen (UBA 2007), also 10,7 Ct/kWh."
Eine bequeme Lösung: Vor Ort wird alles sauber - der Dreck wird weit weg in Kolumbien gemacht: Deutschland bezieht einen großen Teil seiner Kohle aus Kolumbien.
Peter Krysler, Billige Kohle aus Kolumbien (im Cache): Umweltverschmutzung und ein blutiges Geheimnis, Deutschlandfunk, UMWELT UND VERBRAUCHER / Beitrag vom 17.04.2014
In Kolumbien wird die Steinkohle im günstigen Tagebau gefördert. Das spart Geld: 20 bis 40 Euro kostet die Tonne, in Deutschland sind es 140 Euro; kein Wunder, dass für deutsche Kohlekraftwerksbetreiber die kolumbianische Kohle so attraktiv ist. Seit 2011 wuchs der Abbau von Steinkohle um 30 Prozent.
Ruth Reichstein, Umweltschädliche Kohle aus Kolumbien (im Cache): Kolumbien ist zum wichtigsten Kohle-Lieferanten Deutschlands geworden. Deutschlandfunk, UMWELT UND VERBRAUCHER / ARCHIV / Beitrag vom 29.01.2013
70 Prozent der Kohle gehen nach Europa - der größte Teil nach Deutschland. Für die deutschen Energieversorger ist Kolumbien ist zum wichtigsten Kohle-Lieferanten geworden. Ein Viertel der Importe kommen mittlerweile aus dem südamerikanischen Land. Und die Produktion dort steigt immer weiter an - parallel zum angekündigten Stopp des Steinkohlebergbaus in Deutschland.
Der Eon-Konzern bezieht mittlerweile ein Drittel seiner Steinkohle aus kolumbianischen Minen.
Peter Kolakowski, Umstrittener Steinkohleabbau in Kolumbien (im Cache): Indigene Bevölkerung prangert Menschenrechtsverletzungen an. Deutschlandfunk, UMWELT UND VERBRAUCHER / ARCHIV / Beitrag vom 02.05.2012
Der Menschenrechtsanwalt Alirio Uribe Munoz arbeitet in einem Anwaltskollektiv für die Gemeinde Tabaco, die 2001 von Sicherheitskräften gewaltsam geräumt wurde, um dem Cerrejon-Tagebau Platz zu machen. Uribe erzählt auch von den Morden an drei Gewerkschaftern. So soll das Bergbauunternehmen Drummond, welches ebenfalls deutsche Kraftwerke beliefert, etwas mit den Mordfällen zu tun haben.
"Drummond wird vorgeworfen, dass sie vor über zehn Jahren an der Ermordung von drei Gewerkschaftern beteiligt waren oder das in Auftrag gegeben haben. Das Unternehmen hat das immer abgestritten, aber jetzt bei einem Gerichtsverfahren in den USA wurden Paramilitärs verhört und haben ausgesagt, dass führende Mitarbeiter von Drummond massiv in diese Mordfälle verwickelt sind und dass Drummond auch die paramilitärischen Einheiten über einen längeren Zeitraum finanziell unterstützt hat.
Würden die Kosten der Förderung und der Umwelt- und Klimabelastung von Atomenergie, Kohle und Erdgas wie beim EEG umgelegt, würde diese "Konventionelle-Energien-Umlage" einen deutlichen Zuschlag auf den Endverbraucher-Strompreis bewirken. Wie hoch der Zuschlag ausfällt, hängt entscheidend davon ab, welche Endverbraucher an den Kosten beteiligt werden würden.
Denkbar wäre zum einen, die Kosten gleichmäßig auf den gesamten Nettostromverbrauch umzulegen (ca. 540 TWh pro Jahr, Variante 1).
Würde hingegen die Strommenge zugrunde gelegt, auf die sich im geltenden Wälzungsmechanismus des EEG als "anzulegenden Letztverbrauch" die Kosten verteilen (ca. 387 TWh pro Jahr, Variante 2), wäre die Subventions- und Umweltumlage noch einmal deutlich höher.
Tabelle 6 gibt eine Übersicht über die Zusammensetzung und Höhe der Umlage in den beiden Varianten der Kostenwälzung. Die staatlichen Förderungen mit Auswirkungen auf die öffentlichen Haushalte und die nicht internalisierten externen Kosten der konventionellen Energieträger haben im Jahr 2012 ein Volumen von 40 Mrd. Euro. Dieser Wert ist mehr als doppelt so hoch wie die Differenzkosten des Erneuerbare-Energien-Gesetzes, die über die EEG-Umlage gedeckt werden.
Average amount of electricity generated in 1 year by a 1 m2 photovoltaic (PV) panel, tilted 60 degrees, pointing south in Waren (Müritz), Germany is 72.4 kWh. Definition of kWp: Power output of PV area at maximum insolation. Efficiency of PV area: Under maximum insolation this PV area delivers 0.1 kW. Maximum insolation on this 1 m2 PV area is 1 kW. So, the efficiency of the photovoltaic panel is 10 %.
"Wenn man sich die Stromerzeugungskosten für das Jahr 2020 berechnet, zeigt sich, dass Photovoltaik und Onshore-Windenergie etwa gleich teuer sein werden, während Offshore-Windkraft noch etwas teurer sein wird. Es kommt dann nicht mehr darauf an, welches die günstigste Energiequelle ist, sondern mit welchem Erzeugungsmix wir die geringsten Kosten für den Netzausbau und die Speicherung haben werden. Unter diesen Randbedingungen kommt man auf ungefähr ein Drittel Photovoltaik und auf grob 200 Gigawatt installierte Leistung."
(Bruno Burger, Leiter, Abteilung Leistungselektronik, Fraunhofer-Institut für Solare Energiesysteme, Freiburg)
Anfang Einschub
Fraunhofer-Institut für Solare Energiesysteme (Fraunhofer-ISE)
"Unsere Energieversorgung befindet sich im Wandel. Die zunehmende Einspeisung regenerativer Energien in unser Stromnetz erfordert neue Managementkonzepte, birgt aber auch vielfältige Potenziale. Durch die intelligente Vernetzung dezentraler Erzeuger, Speicher und beeinflussbarer Lasten können alle Akteure flexibel und zeitnah interagieren. Dies ermöglicht die Einführung neuer Marktkonzepte unter Einbeziehung erneuerbarer Energien, Kosteneinsparung durch Effizienzgewinne auf allen Prozessebenen und neue innovative Lösungen für technische Herausforderungen. So können durch dezentrales Last- und Erzeugungsmanagement Spitzenlasten in Netzen begrenzt und damit die Aufnahmefähigkeit bestehender Netze für erneuerbare Energie auch ohne Netzausbau erhöht werden. Die Anforderungen und Erwartungen an das Netzmanagement und die erforderliche Informations- und Kommunikationstechnologie (IKT) sind entsprechend hoch."
"Unsere Vision ist eine nachhaltige hocheffiziente Erzeugung, Verteilung und Nutzung elektrisch und thermisch kombinierter erneuerbarer Energien."
"Unsere Ziele sind FuE-Aktivitäten für eine systemtechnische Verbindung der drei Säulen des Strukturwandels der Energieversorgung:
Monitoring und intelligente Betriebsführung bis zum Endverbraucher im Verteilnetz"
"Mit unserer Kombination aus Erfahrung und energiesystemtechnischer Kompetenz unterstützen wir Industrie und Politik seit Beginn der Forschung an intelligenten Energienetzen. Hierfür bieten wir ein breites Portfolio anwendungsorientierter Forschungs-, Entwicklungs- und Beratungsleistungen an." (Quelle)
Ende Einschub
"CO2 -Zertifikate werden verschenkt. Der faire Preis für CO2 -Emissionen sind 70 Euro pro Tonne. Zum Vergleich: Mit Photovoltaik kommen wir heute schon auf etwa 50 Euro pro Tonne." (Christian Breyer, Geschäftsführer, Berliner Reiner Lemoine Institut)
"Wie teuer wird der Strom, wenn wir ein 200-Gigawatt-[Photovoltaik-] Szenario umsetzen?
Es zeichnet sich ab, dass wir auf jeden Fall unter 12 Eurocent pro Kilowattstunde Stromgestehungskosten bleiben. Das ist für ein Worst-Case-Szenario für das Jahr 2020 gerechnet, das aber für jede Stunde des Jahres funktioniert. Dann wird es keinen Netzzusammenbruch geben, und es ist ein sehr dezentrales Szenario.
In der Realität könnten wir sicherlich 10 Eurocent oder weniger an Stromgestehungskosten für ein 100-Prozent-Erneuerbare-Szenario schaffen, allein schon weil die nötigen Speicher günstiger werden.
Zum Vergleich: An der Strombörse kostet die Kilowattstunde heute 6 - 7 Eurocent an Vollkosten, also inklusive der Anlageninvestition, die an der Strombörse keine Rolle spielt. Das sind die Kostenannahmen für heute, diese werden aber steigen, da auch die Stromgestehungskosten der fossilen Kraftwerke steigen." (Christian Breyer)
Abbildung 1: Stromgestehungskosten für erneuerbare Energien und konventionelle Kraftwerke an Standorten in Deutschland im Jahr 2013. Der Wert unter der Technologie bezieht sich bei PV auf die solare Einstrahlung (GHI) in kWh/(m2a), bei den anderen Technologien gibt sie die Volllaststundenanzahl der Anlage pro Jahr an.
"Wie will man denn verhindern, dass nicht alle Endkunden ihren Strom zu weniger als einem Drittel des Preises selber machen, statt ihn teuer einzukaufen? Man müsste schon die Photovoltaik mit einer Strafsteuer belegen, um zu verhindern, dass nicht mindestens 150 Gigawatt installiert werden, denn die Flächen dazu sind auf den Dächern da." (Volker Quaschning, Professor für regenerative Energiesysteme, HTW Berlin)
Beispiel 1 (J. Gruber)
Kosten für PV-Strom auf einer vom Stromnetz unabhängigen Insel, erzeugt auf einer nach Süden (Osten oder Westen) ausgerichteten Dachfläche mit 40 Grad Neigung (Linie in nebenstehender Abbildung).
PV-Strompreis ohne Speicher:
0.084 (0.10) Euro/kWh.
Basis:
Materialkosten für eine schlüsselfertige Anlage (2015) 1335 Euro/kWp (im Cache).
Lebensdauer der Anlage: 20 Jahre,
Energieertrag pro Jahr: 806 kWh/kWp (690 kWh/kWp),
Energiebedarf pro Jahr: 0.3 kW 8760 h = 2630 kWh. Daraus folgt:
"Abbildung 1 zeigt die jahresmittleren Eigenverbrauchsanteile und Autarkiegrade je nach Größe des PV-Speichersystems. Zusätzlich wurden die PV-Leistung und die nutzbare Speicherkapazität auf den Jahresstrombedarf normiert. Durch die Normierung können beide Bewertungsgrößen in Abhängigkeit des jährlichen Strombedarfs eines Haushalts abgeschätzt werden. Wie die Abbildung zeigt, sinkt mit zunehmender PV-Leistung der Eigenverbrauchsanteil, wohingegen der Autarkiegrad ansteigt. Durch einen zusätzlichen Batteriespeicher lassen sich beide Größen in der Regel erhöhen. Wird in einem Haushalt mit einem Jahresstrombedarf von 4 MWh (4.000 kWh) ein PV-System mit einer Leistung von 4 kWp installiert, entspricht dies einer spezifischen PV-Leistung von 1 kWp/MWh. Bei dieser Systemgröße können Einfamilienhaushalte im Jahresmittel einen Eigenverbrauchsanteil und Autarkiegrad von jeweils rund 30 % erzielen." Quelle: Quaschning
"Wird zusätzlich ein Batteriespeicher mit einer nutzbaren Speicherkapazität von 1 kWh/MWh (zum Beispiel 4-kWh-Batteriespeicher bei einem Jahresstrombedarf von 4 MWh) installiert, kann der Eigenverbrauchsanteil auf 60 % und der Autarkiegrad auf 55 % gesteigert werden. Eine Vergrößerung der Speicherkapazität auf über 1,5 kWh/MWh würde den Eigenverbrauchsanteil und Autarkiegrad nur noch wenig steigern. Dies ist darauf zurückzuführen, dass größere Batteriespeicher in der Nacht nicht vollständig entladen werden [2]. Um hohe Autarkiegrade zu erzielen, ist es aus energetischer Sicht sinnvoll, je 1 kWp PV-Leistung eine nutzbare Speicherkapazität von 1 kWh zu installieren. Allerdings ist mit steigendem Autarkiegrad dessen Vergrößerung mit zunehmendem Aufwand verbunden. Um den Autarkiegrad von 55 % auf 75 % zu steigern, muss sowohl die PV-Leistung auf 2 kWp/MWh als auch die Speicherkapazität auf 2 kWh/MWh verdoppelt werden. Aus dem Verlauf der Linien gleichen Autarkiegrades wird auch deutlich, dass eine nutzbare Speicherkapazität über 2 kWh pro kWp PV-Leistung keine Steigerung des Autarkiegrades zur Folge hat. Aus dieser energetischen Betrachtung können somit Grenzen der sinnvollen Dimensionierung von PV-Speichersystemen abgeleitet werden." Quelle: Quaschning
"Erst die Kombination von PV-Anlage und Stromspeicher erlaubt es, sich mit selbst produzierten Strom auch nachts zu versorgen. Der selbst produzierte Sonnenstrom aus der Photovoltaikanlage wird zuerst direkt für die Hausversorgung genutzt. Der Überschuss lädt am Tag den eigenen Solarenergiespeicher auf und was davon noch übrig bleibt, wird nach wie vor in das öffentliche Stromnetz eingespeist. In der Nacht verbraucht man automatisch zuerst den gespeicherten Strom, bevor er aus dem öffentlichen Netz zugekauft wird. Im Herbst und Frühling hält sich die Kapazität der Akkus ideal mit den Sonnenstunden die Waage. Obwohl im Sommer die Batteriekapazität leicht ausreicht und im Winter durch schneebedeckte PV-Module nicht an jedem Tag voll geladen wird, ergeben sich für den Sonnenspeicher immerhin ca. 260 Vollzyklen im Jahr."
"Besonders effizient arbeitet ein Solarstromspeicher, welcher aus Modulen vom Ost-West-Dach gespeist wird. Diese Ausrichtung weist eine gleichmäßigere über den Tag verteilte Stromproduktion auf, als ein reines Süddach. Bereits bei Sonnenaufgang mit den ersten Sonnenstrahlen liefert eine solch installierte PV-Anlage eine brauchbare Leistung und hält die Sonnenernte durch bis zum letzten Sonnenstrahl bei Sonnenuntergang. Für die Wintermonate sind ergänzende PV-Module am Balkongeländer oder der Südfassade sinnvoll, da diese Module garantiert schneefrei bleiben und im Winter zur Sonne hin einen optimalen Winkel aufweisen. Ein Speicher erhöht den Eigenverbrauchsanteil von 10 % bis 40 % auf 70 % bis 95 %, je nach Ausrichtung und Größe der Photovoltaikanlage und Kapazität der Sonnenbatterie. Die Unabhängigkeit steigt und etwaige Strompreissteigerungen wirken sich geringer aus. Es ist abzusehen, dass in Zukunft in Millionen von Haushalten dezentral von den Bürgern solche Inhouse-Speicher aufgestellt werden, da der Strompreis seit Jahren durch das Gewinnstreben der Energiekonzerne ins Absordum getrieben wird. Ungefähr alle zehn Jahre hat sich in der Vergangenheit der Strompreis verdoppelt."
"Der Stromspeicher wird seit 1. Mai 2013 staatlich mit einem Zuschuss gefördert. Die Staatliche Förderung wird als Anschaffungskriterium immer unwichtiger, denn viele Investoren wollen sich mit dem Solarstromspeicher möglichst autark vom Netzbetreiber machen und auf Kohle- und Atomstromkonsum verzichten. Sobald im Jahr 2025 die ersten PV-Anlagen aus der EEG-Förderung herausfallen und es keine Anschlussförderung gibt, werden die Solarstromspeicher alltäglich werden, wie Zentralheizungen oder Fernseher."
"Christian Breyer hat mit seinem Team ein Szenario für eine Stromversorgung zu 100 Prozent aus erneuerbaren Energien untersucht, das möglichst dezentral sein soll. Zur Berechnung hat er Deutschland in ein 100-Kilometer-Raster unterteilt. "Auf 100 Kilometer wollen sich die Regionen tendenziell selber versorgen", begründet er die Annahme. Innerhalb der einzelnen Flächen des Rasters muss alle 8.760 Stunden des Jahres genug Strom vorhanden sein. Er nimmt bekannte Daten darüber auf,
wie viel Strom in jeder Stunde eines Referenzjahres benötigt wird,
wie in diesem Referenzjahr zu jeder Stunde die solare Strahlung anfiel, und
wann der Wind geweht hat.
Er trifft Annahmen für Einsatz und Kosten von Batterien und anderen Speichern wie zum Beispiel Power-to-Gas, bei dem mit dem grünen Strom Gas erzeugt und in das Gasnetz eingespeist wird."
"Das Ergebnis: Die Jahresstromerzeugung liegt bei rund 850 Terawattstunden, das ist mehr, als landläufig als Verbrauch geschätzt wird. Das ist nötig, da zehn Prozent der Energie nicht genutzt werden, weil sie zur falschen Zeit anfallen und die Speicher voll sind."
[Zu den angesetzten Wirkungsgraden:]
Von der Energie, die zwischengespeichert wird, geht wiederum ein Teil durch Umwandlungsverluste verloren.
Solarkraftanlagen haben rund 1.000 Volllaststunden pro Jahr. Das bedeutet, sie erzeugen pro installiertem Kilowatt 1.000 Kilowattstunden Strom im Jahr.
"Wer argumentiert, dass damit zeitweise viel zu viel Strom erzeugt wird und zu anderen Zeiten viel zu wenig, hat damit nur teilweise recht. Bruno Burger hat aus den bei der Strombörse veröffentlichten Daten für 2012 berechnet, dass der Wind- und der Sonnenstrom sowieso fast nie gleichzeitig in voller Höhe fließen. "Wir haben an die 30 Gigawatt Wind und an die 30 Gigawatt installierter Leistung für die Photovoltaik, aber die Summe der tatsächlich erbrachten Leistung lag noch nie über 30 Gigawatt", sagt er. Ein weiteres Indiz dafür, dass sich die beiden Energiequellen gut ergänzen, indem sich ihre Fluktuationen gut ausgleichen."
"Rund 9 Cents pro Kilowattstunde Solarstrom sind in den Augen der meisten Experten eine relativ sinnvolle Annahme für 2050. (siehe oben)
Damit kommt der Preis nicht an den für den heutigen Kohle- und Atomstrom heran, und nach den Prognosen auch nicht an den aus Windkraftanlagen. Dieser wird sich vermutlich bei 4 - 6 Cents einpendeln. "Das ist die Kalkulationsmethode von den Energieversorgungsunternehmen", sagt Volker Quaschning. "Die betrachten einen grünen Acker, auf dem Windstrom billiger erzeugt werden kann."
Doch diese Argumentation vernachlässige, dasss sich Wind- und Sonnenkraft beim Ausgleich der Fluktuationen unterstützen und dass der Solarstrom für die 9 Cents bereits beim Verbraucher sei und von ihm bereitgestellt würde. 9 Cents im Vergleich zu 25 - 30 Cents Strompreis - das sei dovch unschlagbar günstig.
7.3.3.2 methanspeicher und stromimport
Abbildung 7-22 zeigt den Einsatz von
Elektrolyse,
eE-Methan-Rückverstromung,
Biogasverstromung und
Importen
für den gesamten Betrachtungszeitraum 2006 bis 2009. Die Last wird in jeder Stunde vollständig gedeckt. Dazu werden je nach Bedarf nacheinander eingesetzt, bis zu:
2,5 GW Biogas-Gasturbinen mit KWK,
9,3 GW Stromimporte aus erneuerbaren Energien,
28,0 GW GuD-Kraftwerken zur Rückverstromung von eE-Methan und
17,5 GW Biogas-Gasturbinen als Reservekraftwerke.
Der Wirkungsgrad des eE-Methan-Speichersystems beträgt 35 %, ist also etwas geringer als der des eE-Wasserstoff-Speichersystems. Daher sind die Importe mit mit einem Mittelwert von 29,5 TWh (gemittelt über alle vier Jahre) beim eE-Methan-Speichersystem etwas höher und betragen rund 6 % des Stromverbrauchs im Jahr 2050.
7.3.3.2 methanspeicher und stromimport
Abbildung 7-23 zeigt den eE-Methan-Speicherfüllstand über die vier Jahre. Anfangs- und Endwert betragen jeweils ca. 40 TWhth, das Minimum liegt bei 10 TWhth und das Maximum bei ca. 75 TWhth. Das hierfür benötigte Speicher- volumen von rund 7,5 Mrd. m3 liegt sehr deutlich unter den technisch-ökolo- gischen Potentialen im Jahr 2050.
Quelle: Abb. 7-24 in: Energieziel 2050 - 100 Prozent Strom aus Erneuerbaren Quellen
"Für kleine Photovoltaikanlagen ist das Ausrechnen einer finanzmathematischen Rendite, womöglich noch mit Nachkommastellen, wenig sinnvoll. Entscheidend ist oft nicht einmal die Investitionssumme, sondern langfristig hohe Erträge bei niedrigen Betriebs- und Wartungskosten. Ein weiteres Plus in der Kalkulation ist der Eigenverbrauch des erzeugten Solarstroms. Bei Anlagen über 10 kWp Leistung wird dieser sogar unerlässlich, um den Einnahmeausfall aus dem nicht mehr voll vergüteten 10-Prozent-Anteil auszugleichen. Sonst wirkt diese neue Regelung im EEG wie eine zusätzliche Vergütungskürzung."
Beispielrenditen, die mit dem Solarrechner der Stiftung Warentest für den Inbetriebmonat August 2012 ermittelt wurden, sind in der Tabelle auf Seite 38 dargestellt. Auffallend ist, dass günstigere Einkaufspreise die Rendite kaum verbessern, aber höhere Betriebskosten die Rendite deutlich schmälern. Besonders positiv wirken sich Eigenverbrauch und hohe Erträge aus: Qualität und Leistungsfähigkeit ist also Trumpf, jedenfalls bei der langfristig kalkulierten Rentabilität."
Teil 1
In diesem Video werden die verschiedenen Maßnahmen aufgezeigt, wodurch die EEG-Umlage in den Jahren 2009 - 2012 durch die schwarz-gelbe Bundesregierung gezielt aufgebläht wurde und die Widersprüchlichkeit der vollmundigen Erklärungen zur Energiewende zu den tatsächlichen Taten.
Ergänzend hierzu werden die angewandten Kommunikationsmethoden ("agenda setting") aufgezeigt, die dazu führen, dass bestimmte Schlagzeilen in den Medien stehen und andere nicht.
Durch die Befreiung der stromintensiven Industrie ist die EEG-Umlage nach Schätzungen des Bundes der Energieverbraucher um rund 0,8 Ct/kWh zu hoch.
"Nicht die EEG-Umlage ist der Sündenbock, sondern die Bundesregierung, die rechtswidrig die Umlage aufbläht, um sie politisch zu diskreditieren und abzuschaffen. Denn der Erfolg des EEG geht den etablierten Stromversorgern an die wirtschaftliche Substanz. Deshalb begrüßen wir die Einleitung des Beihilfeverfahrens durch die EU-Kommission. Das Beihilfeverfahren richtet sich nicht gegen die EEG-Umlage, sondern gegen die Ausnahme von der Umlage. Unsere Beschwerde entlastet im Erfolgsfall die Stromrechnung jeden Haushalts um rund 30 Euro im Jahr, den Mittelstand um wesentlich höhere Beträge.", Aribert Peters, Vorsitzender, Bund der Energieverbraucher e.V., Pressemitteilung, 05. Juni 2012
Nachtrag 2012: Wegbereiter für das Solarausstiegsgesetz von 2012 war eine 2009/2010 begonnene Pressekampagne gegen das EEG, die EEG-Umlage und die PV, die durch Fukushima nur kurzzeitig ausgesetzt und bereits ab Herbst 2011 fortgeführt wurde. Diese PR-Kampagne wird in diesem Film anhand vieler Beispiele und Widersprüche dargestellt. Sie bot die mediale Grundlage für das aktuelle Solarausstiegsgesetz, mit dem versucht wird, eine begonnene dezentrale Energiewende zu beenden.
Teil 2
erklärt den Merit-Order Effekt und zeigt auf, wie sich vor allem auch durch die zum 01.01.2010 in Kraft getretene neue Berechnungsgrundlage (AusglMechV) die EEG-Umlage von 2010 auf 2011 überproportional erhöht hatte. Stärker, als es den eigentlichen Steigerungen der Vergütung entsprochen hätte ...! Diese Information waren den Medien nicht zu entnehmen.
Nähere Hintergründe zum EEG, der EEG Umlage, der Berechnungsgrundlagen etc. findet man in dem dazugehörigen Artikel. Ergänzend wurden außerdem Untersuchungen zu Journalismus und PR-Arbeit beigefügt, die ebenfalls mit Originalquellen versehen sind. http://tinyurl.com/6xe4u6s
Teil 3
zeigt auf, worum es wirklich geht: Die von Hunderttausenden Bürgern begonnene dezentrale Energiewende soll weichen zugunsten eines Strom-Oligopols, das Marktanteile verloren hat.
Solarenergie-Anteil am deutschen Strom-Mix steigt bis 2016 um 70 Prozent
Prognos AG: Stromtarife steigen dadurch um knapp zwei Prozent
Der Anteil der Solarenergie am deutschen Strom-Mix wird nach Einschätzung des Bundesverbandes Solarwirtschaft e.V. in den nächsten vier Jahren um 70 Prozent zulegen, von rund 4 Prozent im Jahr 2012 auf etwa 7 Prozent im Jahr 2016. Die Strompreise steigen dadurch nach Angaben der Prognos AG um knapp 2 Prozent (Vgl. akuelle infografik). Dies ist das zentrale Ergebnis eines heute gemeinsam mit der Prognos AG in Berlin vorgestellten Kurzgutachtens. "Durch die bereits realisierten Förderkürzungen sind die Kosten für den Ausbau der Photovoltaik unter Kontrolle", so Carsten Körnig, Hauptgeschäftsführer des Bundesverbandes Solarwirtschaft (BSW-Solar).
zum Vergleich: Der Verband kommunaler Unternehmen (VKU) schätzt die Kosten für den Stromnetzausbau bis 2050 auf 2.49 Euro/Monat (= 0.014 Euro/kWh x 1000 kWh/(Jahr Person) 2.13 Personen/Durchschnittshaushalt x 1 Jahr/(12 Monate))
"Die Energiewende kostet Geld, vor allem in der Anschubphase. Die mit dem weiteren Ausbau der Solarenergie verbundenen Investitionen steigen jedoch kaum noch und zahlen sich aus", sagte Körnig heute in Berlin. Vielen, die jetzt eine weitere Kürzung der Förderung forderten, sei nicht bewusst, dass der starke Zubau von Solarstromanlagen in den vergangenen drei Jahren bereits zu einer Halbierung der Fördersätze geführt habe. 2012 wird die Solarstromförderung nach dem erst im Sommer 2011 verschärften Fördergesetz EEG um nochmals 27 Prozent gekürzt. Damit sinkt jetzt die Solarförderung doppelt so stark wie im Vorjahr (Förderreduktion 2011: 13 Prozent). Körnig: "Die Kostenbremse des Gesetzgebers bei der Solarförderung funktioniert."
Die Prognos AG hat auch die möglichen Auswirkungen einer festen Mengenbegrenzung ("Deckelung") auf die Stromtarife untersucht, die derzeit politisch diskutiert wird. Ergebnis: Die Einsparung bis 2016 würde gerade ein Prozent am Verbraucherstromtarif ausmachen. "Dem stehen drastische Verluste bei Arbeitsplätzen, Anlageinvestitionen, Branchenumsatz, Technologievorsprung und Steuereinnahmen gegenüber", so Frank Peter, Projektleiter Energiewirtschaft bei der Prognos AG.
Die Photovoltaik mit ihren Vorteilen sei für die Energiewende unverzichtbar, so Körnig. "Verbrauchernahe Erzeugung, hohe Akzeptanz beim Bürger, schneller Ausbau und das bei rasant sinkenden Kosten. Die Solarbranche erfüllt ihr Versprechen, die Kosten radikal zu senken. In einem nächsten Schritt werden wir 2013 mit dem Förderniveau großer Windkraftanlagen auf dem Meer gleichziehen", sagte Körnig. Bis 2020 will die Solarbranche ihren Anteil am deutschen Stromverbrauch auf über 10 Prozent steigern und wettbewerbsfähig werden.
"There's another way to approach the problem: start with supply instead of demand, and work backward from there. In his book Sustainable Energy - Without the Hot Air (Contents, Synopsis in cache), physicist David J.C. MacKay calculates how much energy could sustainably be produced in the United Kingdom with a massive expansion of existing technology. The total turns out to be less than the nation's energy consumption, which suggests to MacKay that the only path forward is to reduce demand -- through energy efficiency improvements, for example -- until it balances with supply.
Renewable energy advocates typically support conservation efforts, but they don't make reducing consumption their primary goal. Panicked by the urgency of the climate crisis, and rightfully so, their knee-jerk response is a "just do it" approach to technology. "Why don't we just build more solar panels and wind turbines?" they ask.
To which I say: Why don't we just not do it?
Let's not build any new power plants except to replace old, inefficient ones.
Let's not dig up all the oil.
Let's not drive to work alone.
Let's not eat meat every day.
Let's not turn the thermostat up so high.
Let's not buy so many things we don't really need.
And above all, let's not accept continued energy growth as a necessary or even desirable way of life."
Im Positionspapier fehlt bei den Forderungen an die Politik, meines Erachtens,die dringende Aufforderung, dass die groben Behinderungen beim Ausbau der erneuerbaren Energien sofort zu beenden sind.
Da sind einerseits die viel zu drastischen Absenkungen der Vergütungssätze für Photovoltaik-Strom, wodurch die ganze PV-Branche in Deutschland an den Rand des Zusammenbruchs gedrängt wird(!),
anderseits werden noch immer in einigen Bundesländern und in vielen Kommunen die Genehmigungen für Inland-Windparks sehr restriktiv gehandhabt.
Nach wie vor gibt es keine konkrete Strategie, um die Möglichkeit von Windrädern entlang der Autobahntrassen, auf öffentlich-rechtlichen Flächen und in geeigneten Waldgebieten zu realisieren.
Auch der unbedingt und dringend notwendige Aufbau von Langzeitspeichern für erneuerbaren Strom mittels erneuerbarem Wasserstoff (und der Produktion von Methan und Methanol) wird von der schwarz-gelben Koalition abgeblockt!
Ich bin der Meinung, dass die gesamte Bevölkerung über diese gravierenden Missstände aufgeklärt werden sollte!
Der Solarenergie-Förderverein Deutschland e.V. hat, wie ich finde, eine ebenso einfache wie effektive Maßnahme vorgeschlagen, wie mit einer Erhöhung der Mehrwertsteuer für Strom ein individuelles "Energiegeld" ausgezahlt werden kann, welches die einzelnen Familien substanziell entlasten würde, und wodurch ebenfalls die Soziallasten der kleinen und mittelständischen Unternehmen drastisch abgesenkt werden könnten. Siehe dazu hier.
"Unsere Volkswirtschaft unterliegt einem laufenden Rationalisierungszwang, d.h. dem Zwang, teures Personal durch billige Energie zu ersetzen. Diese Ersetzung erfolgt jedoch nicht nur dort, wo es vernünftig und sinnvoll ist, sondern auch dort, wo es zu erheblichen gesellschaftlichen Nachteilen führt. Aus Kostengründen wird auch dort die Zahl der verfügbaren Stellen immer weiter abgebaut. Das geschieht besonders in den Bereichen Ausbildung und Erziehung, soziale Betreuung, Qualitätssicherung, handwerkliche Fertigung, Materialerhaltung, Instandsetzung im industriellen und handwerklichen Maßstab, im künstlerischen Bereich und bei der Grundlagenforschung für die Zukunftssicherung."
"Der Solarenergie-Förderverein Deutschland setzt sich deshalb für eine Verringerung der Personalkosten und eine Erhöhung der Energiekosten ein. Er schlägt eine drastische Senkung der Lohnnebenkosten vor. Dazu soll in einem ersten Schritt der Arbeitgeberanteil der Sozialabgaben zukünftig vom Staat bezahlt werden. Zur Gegenfinanzierung empfehlen wir eine deutliche Erhöhung der Energiesteuern."
"Ziel ist eine Verbesserung der Rahmenbedingungen für die oben erwähnten personalintensiven Wirtschaftszweige gegenüber den derzeit überwiegenden energieintensiven und ressourcevergeudenden Wirtschaftszweigen. Eine auf diese Weise umstrukturierte Wirtschaft verliert weniger Arbeitsplätze durch Rationalisierung und gewinnt auf der anderen Seite sogar zusätzliche Arbeitsplätze durch Ausweitung des personalintensiven Bereichs. Gleichzeitig erhöht sich allgemein die Energieeffizienz." (Quelle, mehr.)
"Die Energiesteuer bringe auch bei den nichtelektrischen Energieträgern einen Preisanstieg: 100 Cent pro Liter bei Diesel, Benzin und Heizöl, 120 Cent pro Kubikmeter Erdgas wären mehr zu zahlen. Dieser Anstieg werde durch ein "Energiegeld" ausgeglichen, das aus der Energiesteuer abzweigt werde. "Das Energiegeld erhält jeder, der mit seinem ersten Wohnsitz in Deutschland gemeldet ist, vom Säugling bis zum Greis. Die Höhe ist für alle gleich und entspricht den Durchschnitts-Mehrkosten infolge der Energiesteuer. Wer sparsamer mit Energie umgeht als der Durchschnitt, hat somit einen finanziellen Vorteil, wer mehr Energie verbraucht, hat Nachteile. Dies ist ein Anreiz zum Energiesparen auch im persönliche Bereich", so von Fabeck, Geschäftsführer des Solarfördervereins. Grob geschätzt würde die Steuer auf privaten Energieverbrauch dann knapp die Hälfte der Steuereinnahmen auf gewerblichen Verbrauch ergeben, d.h. etwa 97 Mrd. Euro. Aufgeteilt auf knapp 80 Millionen Einwohner seien dies über 1200 Euro jährlich. So ergebe sich ein Energiegeld von knapp 100 Euro pro Monat und Person." (Quelle), mehr)
Berlin, 01.03.2013. Der Verband kommunaler Unternehmen (VKU) hat heute ein Gutachten zur zukünftigen Ausgestaltung des Energiemarktes vorgestellt, das die Beratungsunternehmen enervis und BET im Auftrag des Verbandes erarbeitet haben. Zu den zentralen Elementen des Modells gehören:
ein Leistungsmarkt, über den derjenige, der gesicherte Stromerzeugung (Kraftwerke, Speicher) anbietet, zukünftig ein Entgelt für die Bereitstellung erhält,
ein neues und wettbewerbliches Fördersystem für die erneuerbaren Energien mit Hilfe eines Auktionsverfahrens sowie
eine Neugestaltung der Regulierungsbedingungen für die Stromnetze.
VKU-Präsident Ivo Gönner: "Für die kommunale Energiewirtschaft und den VKU steht fest: Die Energiewende kann nur durch einen grundlegenden Systemumbau in Richtung Markt und Wettbewerb gelingen. Und dieser Umbau braucht einen integrierten Ansatz, der erneuerbare Energien, konventionelle Erzeugung und Netze sowie deren Wechselwirkungen gleichermaßen berücksichtigt. Wir haben deshalb ein Marktmodell entwickelt, das ein Höchstmaß an volkswirtschaftlicher Effizienz generiert, Versorgungssicherheit bietet und dabei nachhaltig ist."
"Die Kostenabschätzungen für den Netzausbau auf allen Spannungsebenen liegen bei rund 40 - 45 Mrd. Euro bis zum Ende des Betrachtungszeitraumes (2050)." (Quelle: Kurzfassung des EMD-Gutachtens)
Anmerkung: Der gesamte Netzausbau kostet also 1.4 Cents pro kWh:
45 Mrd. Euro verteilt auf die in Deutschland in 40 Jahren verbrauchten kWh (80 Mio. Einwohner mit einem järlichen Pro-Kopf Stromverbrauch von 1000 kWh verbrauchen in 40 Jahren 3200 Mrd. kWh) ergibt 0.014 Euro/kWh.
"Die Mehrheit der Bevölkerung will, dass gefährliche Atomkraftwerke schnell vom Netz genommen und klimaschädliche Kohlekraftwerke abgeschaltet werden. Deshalb muss die Energiewende ein Erfolg werden. Das Erneuerbare-Energien-Gesetz (EEG) ist mit Abstand die erfolgreichste Klimaschutzmaßnahme in Deutschland - und damit Motor für die Energiewende.
Im ersten Halbjahr 2012 erreichten die Erneuerbaren Energien bereits einen Anteil von 25 Prozent an unserer Stromversorgung. Alle Vorschläge, das EEG zu deckeln, abzuschaffen oder seine Anwendung an Bedingungen beim Netzausbau zu koppeln sind Gift für die Energiewende.
Es ist sinnvoll, das EEG zu optimieren, vor allem aber ist es wichtig, die Kosten für die Energiewende gerechter zu verteilen und die Ausnahmen für die Industrie auf ein sachlich begründbares Maß zu reduzieren. Wer jetzt an den Grundprinzipien des EEG rüttelt, der verhindert die Energiewende - und damit auch die "Energiewende von unten", die von den Bürgerinnen und Bürgern vor Ort vorangebracht wird.
Wir fordern
Die Energiewende zu beschleunigen anstatt sie auszubremsen. Erforderlich sind verbindliche Regelungen fürs Stromsparen und für mehr Energieeffizienz.
EEG (Erneuerbare-Energien-Gesetz) optimieren - nicht abschaffen. 3. Die Kosten der Energiewende fair verteilen!
Ein Ausbau des Stromnetzes ist erforderlich, um Strom aus Erneuerbaren Energien zu den Zentren des hohen Verbrauchs transportieren zu können. Dies macht das Stromsystem flexibler und reduziert den Bedarf an neuen fossilen Kraftwerken. Allerdings ist der Ausbau der Netze nur dort sinnvoll, wenn dies zur Transformation des Energiesystems auf die effiziente Nutzung Erneuerbarer Energien beiträgt.
Bislang war es eine bloße Behauptung, dass neue Stromnetze dem Ausbau der Erneuerbaren Energien dienen. Im Sommer letzten Jahres wurde das Verfahren der Stromnetzplanung neu geregelt. Mehr Transparenz und Beteiligung der Öffentlichkeit waren die erklärten Ziele.
Der von den Übertragungsnetzbetreibern angegebene Netzausbaubedarf geht aus Sicht des BUND weit über den Bedarf der Energiewende hinaus. Die Planungen sind viel zu sehr auf einen starken Ausbau von Offshore-Windparks in der Nord- und Ostsee ausgelegt. Ein Ausbau der Windenergie an Land, gerade in Süddeutschland, wird nicht ausreichend berücksichtigt. Gleichzeitig dient der vorgeschlagene Netzausbau eben nicht nur wie behauptet dem Ausbau der Erneuerbaren Energien, sondern auch dem europäischen Stromhandel und der höheren Auslastung klimaschädlicher Kohlekraftwerke. Viele Flexibilisierungsmöglichkeiten, die den Ausbaubedarf reduzieren könnten, bleiben hingegen unberücksichtigt.
Die Herausforderungen der Energiewende und die Gefahren des Klimawandels sind groß. Doch die Mühlen in Berlin, in Brüßel oder New York mahlen langsam. Nicht selten stehen sie still. Wir können also die Energiewende nicht "denen da oben" - rückwärtsgewandten Interessengruppen und politischen Bremsern - überlassen und die Hände in den Schoß legen. Packen wir es selbst an. Zu Hause, in der Kommune, am Arbeitsplatz; allein oder besser noch zusammen mit Freunden oder Umweltgruppen und Bürgerinitiativen.
BUND-Aktive und -Gruppen engagieren sich seit langem für die Energiewende und den Schutz des Klimas. Oft waren sie Vorreiter und Wegbereiter für Entwicklungen, die inzwischen selbstverständlich sind. Sie initiieren und betreiben Windkraftanlagen oder Bürgersolarparks. Sie bieten Beratung zum Energiesparen und zur wärmeeffizienten Gebäudesanierung und setzen dies zusammen mit AnwohnerInnen, kommunalen Einrichtungen, Kirchen und lokalen Unternehmen um. Für viele BUND-Gruppen war der Widerstand gegen Atomkraft und gegen Kohlekraftwerke eine Initialzündung und ist bis heute zentraler Bestandteil ihres Engagements.
Stellvertretend für viele BUND-Projekte in ganz Deutschland stellen wir zwei vor: Mach mit."
Wie entwickelt sich die Umlage für den Strom aus Erneuerbaren Energien bis 2017? Damit sich jeder diese Frage beantworten kann, hat Agora Energiewende eine Software entwickeln lassen, die mit wenigen Mausklicks ausrechnet, wie politische Entscheidungen die EEG-Vergütung beeinflussen. Das Programm ist Excel-basiert und erfordert zur Bedienung nur geringe Vorkenntnisse.
Die Software liefert nicht nur die Höhe der EEG-Umlage für die Jahre bis 2017 in Sekundenschnelle, sondern zeigt in Form von Diagrammen auch die Verteilung der Zahlungsströme und die Zusammensetzung der Vergütungssummen auf.
Amid all the news about coal and pollution problems in China you might have missed this one: According to new statistics from the China Electricity Council, China"s wind power production actually increased more than coal power production for the first time ever in 2012.
Thermal power use, which is predominantly coal, grew by only about 0.3 % in China during 2012, an addition of roughly 12 terawatt hours (TWh) more electricity. In contrast,
wind power production expanded by about 26 TWh.
Result
This rapid expansion brings the total amount of wind power production in China to 100 TWh, surpassing
China"s 98 TWh of nuclear power.
The biggest increase, however, occurred in hydro power, where output grew by 196 TWh, bringing total hydro production to 864 TWh, due favorable conditions for hydro last year and increased hydro capacity.
In addition, the growth of power consumption slowed down - in Chinese terms a modest increase of 5.5 % - influenced by slower economic growth, and possibly the energy use targets for provinces set by the Chinese central government.
Coal still accounts for 79 % of electricity production in China, but fortunately that dominance is increasingly challenged by competition from cleaner energy, as well as government policies and public concerns about air pollution.
The Chinese government"s 12th five year energy plan (2011-2015) aims for coal to be reduced from 70 % to 65 % of energy production by 2015. In contrast,
the Chinese government has ambitious targets for wind, solar, and hydro, and plans to increase the share of non-fossil fuels to 30 % of installed electricity generating capacity by the end of 2015.
Auf der heutigen Sitzung des Wirtschafts- und Energieausschusses des Deutschen Bundestages haben der Vorsitzende des SRU, Prof. Dr. Martin Faulstich, und Herr Prof. Dr. Harald Bradke das Sondergutachten des Sachverständigenrates für Umweltfragen (SRU) zur Diskussion gestellt. Dabei wurde auch der Referentenentwurf zur Novelle des EEG kommentiert.
Das Sondergutachten des SRU "Den Strommarkt der Zukunft gestalten" entwickelt Vorschläge für den Übergang zu einer vollständig erneuerbaren Stromversorgung bis 2050. Kontinuierliches Wachstum der erneuerbaren Energien, mehr Effizienz, Versorgungssicherheit und eine bessere politische Steuerung der Energiewende sind dabei die wichtigen Erfolgsbedingungen.
Einige der Vorschläge werden bereits in der anstehenden Novelle des EEG aufgegriffen, so insbesondere der Übergang zur Direktvermarktung. Der SRU begrüßt die Bemühungen des Wirtschaftsministeriums, die Kosten des EEG auf mehr Schultern zu verteilen. Hierzu gehören die Novellierung der Besonderen Ausgleichsregelung und die Befreiungen bei der Eigenstromerzeugung. Wichtig ist auch, die Höhe der Förderung auf ein Niveau zu begrenzen, das die Refinanzierungslücke zum Markterlös deckt.
Dennoch sieht der SRU auch Anlass für Kritik. Der SRU hat Zweifel daran, dass ein "atmender Deckel" für den wichtigsten und kostengünstigsten Leistungsträger des Ausbaus der erneuerbaren Energien, die Onshore-Windenergie, zielführend ist, zumal ohnehin alle anderen Technologien aus guten Gründen gedeckelt werden. Mit Kostengründen ist dieser Schritt nicht zu rechtfertigen. Netzengpässe können dafür vorerst auch nicht glaubwürdig angeführt werden.
Zudem sollte die Einführung von Auktionierungsverfahren nicht überstürzt erfolgen. Bei der Ausgestaltung von Auktionierungen sollten vorab von den Erfahrungen und Fehlern anderer Länder gelernt werden, die zum Teil zu höheren Vergütungssätzen oder Fehlsteuerungen führten. Zunächst sollten daher eigene Pilotprojekte für eine effiziente Ausgestaltung der Verfahren ausgewertet werden. Dies müsste auch der Europäischen Kommission vermittelbar sein.
Die Energiewende wird nicht gelingen, wenn nicht ein Konzept für mehr Flexibilität und deutlich geringere Treibhausgasemissionen des im Übergang notwendigen fossilen Kraftwerksparks verfolgt wird. Der Wiederanstieg der CO2-Emissionen in Deutschland schädigt den internationalen Ruf der Energiewende. Besonderer Anlass zur Sorge ist der zu hohe Sockel der Braunkohleverstromung. Letztlich muss der schrittweise Ausstieg aus der Kohle in Angriff genommen werden.
Der Energiemarkt der Zukunft
Der SRU geht davon aus, dass Windkraft und Photovoltaik in einigen Jahrzehnten die Leittechnologien eines zukünftigen Energiesystems sein werden. Zu Starkwindzeiten oder bei Sonnenwetter wird die Erzeugung aus erneuerbaren Energien sehr hoch, bei anderen Wetterlagen oder zu bestimmten Tages- und Jahreszeiten kann sie niedrig sein. Die Schwankungen können sehr schnell erfolgen, ein erhebliches Spektrum aufweisen und sind nur begrenzt vorhersehbar. Das gesamte Energiesystem muss sich auf solche qualitativ neuen Anforderungen einstellen, indem es flexibler wird. Hierfür muss die Marktordnung die richtigen Signale senden.
Langfristig bestehen zahlreiche Anpassungsmöglichkeiten an diese Herausforderungen:
Zunächst sollte die Stromnachfrage - insbesondere die industrielle und gewerbliche Stromnachfrage flexibler auf die Erzeugungsschwankungen reagieren und damit zum Lastausgleich beitragen können.
Darüber hinaus sollte der weitere Ausbau des fernräumlichen Stromnetzes einen großräumigen Ausgleich von Angebot und Nachfrage ermöglichen. Von besonderer Bedeutung ist hierfür neben der nationalen Netzoptimierung auch der grenzüberschreitende Netzausbau. Eine stärkere EU-weite Integration der Stromnetze kann dafür sorgen, dass unterschiedliche nationale Angebots- und Nachfrageprofile sich vermehrt gegenseitig ausgleichen.
Die Energienachfrage aller Verwendungsbereiche (Wärme, Verkehr und industrielle Prozesse) sollte zur Erreichung der Klimaziele verstärkt auf Elektrizität als wichtigste Energieform umgestellt werden. Damit löst sich die heutige Trennung der Verwendungsbereiche auf. Es entsteht ein zunehmend integriertes Gesamtsystem mit vielen neuen Flexibilitätsoptionen. So können zeitweilige Erzeugungsüberschüsse an Strom in andere Verwendungsbereiche (z. B. Wärme oder Elektromobilität) verschoben werden. Hierdurch kann auch eine temporär sehr hohe Erzeugungsmenge im Markt aufgenommen werden.
Schließlich bestehen weitere langfristige Flexibilitätsoptionen in der wechselseitigen Überführbarkeit verschiedener Energieformen (z. B. Power-to-Gas) und durch vielfältige inländische und ausländische Speicheroptionen. Diese erlauben einen weiteren Lastausgleich.
Aus der Kombination dieser unterschiedlichen Optionen für den Lastausgleich folgt für den Strommarkt, dass es selbst in Zeiten hoher Erzeugung Verwendungsmöglichkeiten für Strom außerhalb des Strommarktes im engeren Sinne gibt (z. B. zur Gaserzeugung). Durch die entstehende Nachfrage wird es auch in einer von erneuerbaren Energien geprägten Zukunft fast immer einen positiven Marktpreis geben. Erneuerbare Energien werden damit am Markt zwar erhebliche Erlöse erzielen, aber sehr wahrscheinlich ihre Kapitalkosten nicht vollständig decken können. Versicherungsähnliche Lösungen, wie Reserven oder Speicher für selten eintretende längere Perioden sehr niedriger Einspeisung, werden sich aller Voraussicht nicht über den Strommengenmarkt refinanzieren können.
Insgesamt wird daher langfristig, das heißt auch in mehreren Jahrzehnten, noch eine kombinierte Vergütung für erneuerbare Energien, versicherungsähnliche Reserve- Leistungen und ergänzende Infrastruktur notwendig sein. Diese besteht zum einen aus einem Arbeitspreis, der über den bestehenden Strommarkt bestimmt wird, zum anderen aus einem Beitrag zur Deckung des weiteren Finanzierungsbedarfes. Der Rahmen zur Festlegung dieses Beitrages hängt ebenso wie die Anteile der beiden Vergütungselemente von den Kosten, Technologien und Marktbedingungen der Zukunft ab und kann daher noch nicht prognostiziert werden.
Aus diesen langfristig absehbaren Strukturelementen eines Strommarktes für erneuerbare Energien lassen sich erste Schritte für einen behutsamen Übergang in Richtung "
mehr Markt"
ableiten.
...Der SRU empfiehlt daher der Bundesregierung,
sich für ein europäisches Klimaschutzziel für das Jahr 2030 einzusetzen, das eine Verminderung der Treibhausgasemissionen durch Maßnahmen innerhalb der EU von mindestens 45 % gegenüber 1990 anstrebt.
Der Anteil der erneuerbaren Energien am Primärenergieverbrauch sollte auf mindestens 40% gesteigert werden.
Das vorhandene Energieeffizienzpotenzial, das eine Verminderung des Primärenergieverbrauchs um bis zu 50 % gegenüber 2010 erlaubt, sollte ausgeschöpft werden. Beides sollte in verbindlichen Zielen verankert werden.
Je nach eigenen nationalen Zielen und Vermeidungskosten können und müssen einzelne Länder, wie zum Beispiel Deutschland, diese Ziele übertreffen.
... Die Einführung von Kapazitätsmärkten birgt Risiken. Bei falscher Ausgestaltung, so zum Beispiel, wenn der Neubaubedarf überschätzt wird oder Vorgaben zur Flexibilität oder zur Begrenzung der CO2-Intensität fehlen, besteht die Gefahr, dass die Transformation der Stromversorgung blockiert wird oder hohe Förderkosten entstehen. Dennoch kann nicht ausgeschlossen werden, dass ein Kapazitätsmarkt für die Versorgungssicherheit mittelfristig notwendig sein wird. Jede neue Marktintervention bedarf aber vorab einer sorgfältigen Prüfung, um eine falsche Ausgestaltung zu vermeiden.
Insgesamt erachtet der SRU den Vorschlag einer strategischen Reserve als das geeignetere Instrument, da dieser den geringsten Eingriff in den Energiemarkt darstellt. (Die strategische Reserve ist eine Absicherung gegen Situationen mit Versorgungsengpässen. In solchen Situationen stehen die ansonsten aus dem Markt genommenen Kraftwerke bereit.)Durch die Herausnahme von Kraftwerken aus dem Strommarkt, die nur bei Versorgungsengpässen in Betrieb gesetzt werden, werden die Ertragsmöglichkeiten in diesem Markt verbessert.
Die Kostendebatte versachlichen
Die grundlegende Reformbedürftigkeit des EEG wird in der öffentlichen Diskussion oft damit begründet, dass das EEG hohe Stromkosten verursache, deren weiteres Anwachsen gestoppt werden müsse. Allerdings werden in dieser Diskussion verschiedene Argumentationsebenen vermengt.
wird der Strompreisanstieg der letzten Jahre einseitig mit dem Ausbau der erneuerbaren Energien erklärt.
konzentriert sich die Auseinandersetzung auf einen Indikator, der zur Ermittlung der tatsächlichen Förderkosten der erneuerbaren Energien ungeeignet ist.
werden die resultierenden sozialen Probleme und die gesamtwirtschaftliche Bedeutung der Entwicklungen überzeichnet.
Der SRU warnt ausdrücklich vor solchen Fehldeutungen.
Die Verdoppelung des Haushaltsstrompreises im Laufe der letzten Dekade war vor allem durch den Kostenanstieg der fossilen Energieträger getrieben.
Zudem ist die EEG-Umlage als Indikator für die Kosten der erneuerbaren Energien untauglich. Die Umlage - als Differenz zwischen Einspeisevergütung und Marktpreis - steigt unter anderem, weil die großzügigen Befreiungen für eine Reihe von Industriekunden auf alle anderen Stromkunden umgelegt werden. Zu einer Steigerung führt paradoxerweise auch, dass der Börsenstrompreis wegen sinkender CO2-Preise und der wachsenden Einspeisung erneuerbarer Energien fällt. Beide Effekte stellen aber keine Förderkosten für die erneuerbaren Energien dar. Fehlerhafte Indikatoren können zu fehlerhaften Reformen führen, die den Ausbau der erneuerbaren Energien bremsen und damit das Gesamtziel der Energiewende gefährden würden.
Der SRU empfiehlt daher zum einen, einen besseren Indikator dafür einzuführen, ob das Portfolio der erneuerbaren Energien kostengünstiger wird oder nicht. Hierfür eignet sich die durchschnittliche EEG-Vergütung für Neuanlagen. Zudem sollte ein umfassender volkswirtschaftlicher Kostenbegriff verwendet werden. Dieser muss die gesamten, den erneuerbaren Energien zuzuordnenden Kosten mit den - insbesondere auch externen - Kosten vergleichen, die beim Aus- und Umbau der fossilen Energieversorgung entstehen (Differenzkostenansatz).
Die gleitende Marktprämie weiterentwickeln
Die erneuerbaren Energien wurden im EEG ursprünglich durch eine Festvergütung refinanziert. Dies ist kritisiert worden, weil in diesem Modell die Erzeugung nicht flexibel auf Marktsignale reagiert. Bereits im Jahre 2012 ist daher die Wahlmöglichkeit zu einer gleitenden Marktprämie eingeführt worden. Die gleitende Marktprämie vergütet den Teil der Kosten der erneuerbaren Energien, der nicht über die Markteinkommen gedeckt wird. Da die Marktpreise stark schwanken und schwerlich über Jahrzehnte prognostiziert werden können, passt sich die Höhe der gleitenden Marktprämie an die durchschnittlichen Börsenpreise an und federt damit einen Teil der langfristig kaum kalkulierbaren Marktrisiken für die erneuerbaren Energien ab.
Andere Modelle der Direktvermarktung (z. B. die fixe Marktprämie oder die Auktionierung) wälzen zu hohe Marktrisiken auf die erneuerbaren Energien ab, erhöhen die Refinanzierungskosten und damit die Förderkosten erheblich. Einen Entwicklungsbruch riskieren noch weiterreichende Vorschläge wie Quotenmodelle. Sie sind im Übrigen auch kostspieliger als eine technologiedifferenzierte Förderung.
Der SRU empfiehlt deshalb die gleitende Marktprämie für alle neuen Anlagen verpflichtend einzuführen. Seit ihrer Einführung im Jahre 2012 ist bereits die Hälfte der Leistung aus erneuerbaren Quellen in die Direktvermarktung übertragen worden, bei der Onshore- Windenergie sind es sogar 80%. Es bestehen damit Praxiserfahrungen, die einen bruchfreien Übergang versprechen.
Der SRU empfiehlt jedoch, die Berechnungsgrundlage der Prämie so zu ändern, dass die Anreize gestärkt werden, Anlagen auf die Erhöhung des Marktwertes anstelle der erzeugten Strommenge auszurichten. Die gleitende Marktprämie soll nach Vorstellung des SRU so berechnet werden, dass die Erzeuger unter realistischen Bedingungen mindestens mit den gleichen Erlösen rechnen können wie bisher mit der festen Einspeisevergütung. Dabei sollten die realisierbaren Markterlöse sowie die Marktprämie technologie- und standortspezifisch auf Basis geeigneter Indikatoren berechnet werden. Anstelle einer 20- jährigen Förderbegrenzung soll ein Gesamtkilowattstundenkonto vorgesehen werden. Bislang konnte durch eine Auslegung der Anlage, die die Anzahl der produzierten Kilowattstunden im 20-jährigen Förderzeitraum maximiert, die absolute Fördersumme gesteigert werden. Das Kilowattstundenkontingent impliziert dagegen für alle Anlagen eine ähnliche absolute Fördersumme. Damit wird ein Gesamterlös gesichert, auch wenn nicht eingespeister Strom nicht mehr vergütet wird. Gleichwohl muss das Niveau der Marktprämie kontinuierlich der tatsächlichen Technologiekostenentwicklung folgen und auf ein energiewirtschaftlich sinnvolles und kostengünstiges Portfolio von erneuerbaren Energien ausgerichtet werden.
Wegen der zusätzlichen gravierenden ökologischen Folgen sowie unerwünschter Verlagerungseffekte sollte die Beendigung der Förderung von Anbau-Biomasse unbedingt erwogen werden.
Der SRU empfiehlt, die Vergütungshöhe durch eine Behörde festlegen zu lassen. Diese sollte, auf der Basis politisch gesetzter Ziele zu Ausbau und Portfolio, nach klaren Regeln und in einem transparenten Verfahren arbeiten. Auf Markt- und Kostenentwicklungen konnte durch die Festlegung der Vergütungssätze im EEG in den letzten Jahren nicht flexibel genug reagiert werden. Dies kann durch eine Behördenlösung besser erreicht werden.
Ein Klimaschutzgesetz verabschieden
Gerade wegen der Vielfalt der beteiligten Akteure und Ebenen und der konkret sehr unterschiedlichen Interessen benötigt die Energiewende ein klar definiertes Leitbild und einen verbindlichen Orientierungspunkt für die unterschiedlichen, im Einzelnen nicht zentral steuerbaren Prozesse. Aus diesem Grunde empfiehlt der SRU ein Klimaschutzgesetz zu verabschieden, in dem die Klimaschutzziele für Deutschland bis 2050 festgelegt werden. Das Klimaschutzgesetz sollte diese Ziele in Zehnjahresschritten festschreiben. Zudem sollten Sektorziele für die klimaschutzrelevanten Sektoren Verkehr, Landwirtschaft, Industrie, Gewerbe, Handel und Dienstleistungen (GHD) und Wärme formuliert werden. Das Treibhausgas-Emissionshandelsgesetz (TEHG) sowie weitere klimaschutzrelevante Gesetze sollten mit dem Klimaschutzgesetz zusammengefasst werden. Die Ziele des Gesetzes sollten zudem durch ein untergesetzliches Programm, dessen Aufstellung verpflichtend sein sollte, untermauert werden. In diesem Programm sollten Maßnahmen und regelmäßige Monitoringprozesse festgelegt werden. Durch ein Klimaschutzgesetz kann die Konsistenz der politischen Entscheidungen verbessert und die breite öffentliche Akzeptanz für klima- und energiepolitische Maßnahmen gestärkt werden."
Koordination im Bundeskanzleramt bündeln
Sinnvoller als die Einrichtung eines Energieministeriums ist ... die institutionelleUnterlegung der Richtlinienkompetenz des Bundeskanzlers bzw. der Bundeskanzlerin. DerSRU spricht sich dafür aus, im Bundeskanzleramt eine Steuerungseinheit im Range einesStaatsministers mit entsprechender Ressourcenausstattung zu installieren, deren Aufgabeder Interessensausgleich zwischen den Ressorts sowie eine Optimierung der Abstimmungzwischen Bund, Ländern und der EU ist. Hierdurch kann die Energiewende in ihrerBedeutung als übergreifende Querschnittsaufgabe und als staatspolitischeKoordinationsaufgabe zwischen Bund, Ländern und EU gestärkt werden.
Derzeit wird 16% der deutschen Stromerzeugung in Kraft-Wärme-Kopplung (KWK) produziert; das Ziel der Bundesregierung für 2020 ist allerdings ein Anteil von 25%. Die Studie schlägt vor, die Ziele der Strom-Versorgungssicherheit und der gekoppelten Erzeugung von Strom und Wärme teilweise gemeinsam zu verfolgen. Dafür ist die KWK auszubauen und (nach und nach auch im Bestand) von einer wärme- auf eine strom(preis)orientierte Fahrweise umzustellen. Weiter sollte die KWK genutzt werden, um Systemdienstleistungen für die Netzstabilität zu erbringen; dadurch kann der Bedarf nach konventionellen Kapazitäten für diese Aufgabe reduziert werden. ... Eine zusätzliche KWK-Kapazität von rund 4 bis 6 Gigawatt (GW) bis 2020 kann hier einen substanziellen Beitrag leisten und voraussichtlich zu Kosten von 300 bis 450 Mio. Euro pro Jahr erzielt werden bzw. mit einer Erhöhung der KWK-Umlagekosten für einen durchschnittlichen Haushalt von derzeit 3,80 Euro auf 9 bis 10 Euro pro Jahr.
Details
zum Vergrößern auf Bild klicken
Verlauf des Stromverbrauchs um die Stunden der Höchstlast für die Jahre 2006 bis 2012. Quelle: IZES 2013
Grundsätzlich ist der Stromverbrauch in Deutschland im Winter generell deutlich höher als im Sommer. So lag die höchste Last im Winterhalbjahr 2012 während knapp 140 Stunden über 78 Gigawatt (GW, ENTSO-E Consumption data), während dieses Niveau im Sommerhalbjahr nur ein einziges Mal erreicht wurde. Interessant für Betrachtungen der längerfristigen Versorgungssicherheit sind insbesondere die Zeiten der Jahreshöchstlast. Typischerweise liegt diese an einem Werktag zwischen Dezember und Februar am frühen Abend.
zum Vergrößern auf Bild klicken
Auftreten von Stunden in den Wintermonaten 2020, in der Wind und PV weniger als 10% der Gesamtlast (bezogen auf die jährliche Spitzenlast) im bundesdeutschen Netz abdecken. Quelle: IZES 2013 (im Cache)
Diese Abbildung zeigt den Tageslastverlauf um die Stunden der Höchstlast für die Jahre 2006 bis 2012. Die Jahreshöchstlast lag hier zwischen 80 und 88 GW. Der klassische Tageslastgang ist klar erkennbar: bereits am Mittag erreicht die Last ein hohes Niveau, nach Erreichen der Höchstlast fällt sie rasch ab. Während der Mittagsstunden liegt die Last an diesen Tagen nur um 3-4 GW unter der Höchstlast, dieser Abstand ist in den vergangenen Jahren noch kleiner geworden. Diese Zusammenhänge sind von Bedeutung, wenn der Frage nachgegangen wird, welche Technologien besonders geeignet sind, die Deckung der Höchstlast abzusichern.
Auch die Betrachtung der Residuallast-Gradienten illustriert den Flexibilitätsbedarf: Krzikalla et al (Krzikalla, Norbert; Achner, Siggi; Brüh, Stefan et al.: Möglichkeiten zum Ausgleich fluktuierender Einspeisungen aus erneuerbaren Energien. Studie des Büros für Energiewirtschaft und technische Planung GmbH (BET) im Auftrag des Bundesverbandes Erneuerbare Energien. Aachen 2013, S. 24) erwarten für das 47%-Szenario des BEE eine maximale Veränderlichkeit der Residuallast in Höhe von rund +13 und -10 GW pro Stunde (d.h. dass aufgrund zurückgehender FEE-Einspeisung binnen einer Stunde höchstens 13 GW durch Hochfahren konventioneller Erzeugung bzw. durch Nachfragemanagement ausgeglichen werden muss). VDE (Erneuerbare Energie braucht flexible Kraftwerke - Szenarien bis 2020. Verband der Elektrotechnik Elektronik Informationstechnik e.V. (VDE), Frankfurt, 2013, S. 106) erwartet (für ein etwas anderes Szenario mit 40% EE in 2020) maximale Residuallastgradienten von +13 und -15 GW pro Stunde.
Entsprechend lässt sich für die künftigen Kapazitäten zur Residuallastdeckung konkretisieren, dass sie künftig nur noch selten über Tage oder Wochen hinweg ohne Unterbrechung benötigt werden und besonders im Winter und hier vor allem am frühen Abend sicher verfügbar sein müssen. Zugleich ist ihre rasche Regelbarkeit erforderlich, um schnelle Einspeiseschwankungen der FEE-Anlagen ausgleichen zu können. Systematisch in diesen Zeiten auftretende Verbräuche erhöhen den Bedarf nach gesicherter Leistung.
Die Förderung der gekoppelten Erzeugung von Strom und Wärme (KWK) findet ihre Rechtfertigung in der anstehenden Phase der Systemtransformation nicht mehr allein in der hohen Energieeffizienz. Als neue Bedingung kann gefordert werden, dass die Kraft-Wärme-Kopplung eine tragende Rolle bei der Gewährleistung der Strom-Versorgungssicherheit und Netzstabilität übernimmt. Dafür sind ein Schub beim Ausbau der KWK und eine Flexibilisierung ihrer Betriebsweise notwendig. Hierfür können durch eine strukturelle Neuordnung der KWK-Förderung Anreize gesetzt werden, ohne dass KWK-Anlagen mit höheren Beträgen als bisher gefördert zu werden brauchen. Begleitend sind Anpassungen an den Regelenergiemärkten erforderlich sowie eine Verpflichtung zu Wärmenutzungsplanungen für die Kommunen sehr sinnvoll. Hierdurch erscheint bis 2020 eine zusätzliche KWK-Leistung von 4 bis 6 GW erreichbar, zu Kosten von abgeschätzt 300 bis 450 Mio. Euro jährlich bzw. einer Erhöhung der KWK-Kosten für einen durchschnittlichen Haushalt von derzeit 3,80 Euro auf 9 bis 10 Euro im Jahr.
Die Flexibilisierung, d.h. die Umstellung von einem wärme- auf einen stromgeführten Betrieb von KWK-Anlagen, erfordert eine entsprechende Infrastruktur:
Es muss die entsprechende Regelungstechnik installiert sein, die die Strompreissignale an die Betriebssteuerung der Anlage übermittelt.
Es ist ein Wärmespeicher erforderlich, der die erzeugte Wärme über Stunden oder ggf. über einen Tag hinweg speichert (zur optimalen Größe von Wärmespeichern).
Ein Heizkessel kann die Wärmeerzeugung übernehmen, wenn niedrige Strompreise die Stromerzeugung in der KWK-Anlage unwirtschaftlich machen.
Soll aufgrund der flexibleren Fahrweise in weniger Stunden dieselbe Wärmemenge erzeugt werden, ist auch eine Erhöhung der Generatorleistung notwendig.
Je nachdem, welche Rolle für die KWK als Beitrag zur Versorgungssicherheit angestrebt wird, ist darauf zu achten, dass die Anlage auch ungekoppelt Strom erzeugen kann. Größere BHKW lassen sich hierfür beispielsweise mit so genannten "Notkühlern" nachrüsten, die die Funktion eines Kühlturms in einem Kondensationskraftwerk übernehmen.
Wolfgang Schulz in Wärmespeicher für die Energieeffizienz, Energiespeichersymposium, Stuttgart 2012, 07. März 2012 schlägt darüber hinaus vor, ähnlich wie in Dänemark in Fernwärmegebieten größere zentrale Wärmepumpen zu installieren, die in Zeiten überschüssiger FEE-Stromerzeugung die Wärmeerzeugung übernehmen können, ohne jedoch einen zusätzlichen Strombedarf zu generieren, da bei niedrigerer FEE-Erzeugung (und entsprechend höheren Strompreisniveaus) das BHKW die Wärmeerzeugung übernimmt.
Wind and solar power peaked at 59.1 % of German power generation earlier this month. It happened at noon on a very windy and sunny October 3 -- the German holiday commemorating reunification. (Germany hit 61 %, a record, and 59 % peaks earlier this year.)
Solar and wind provided 36.4 % of total electricity generation over the entire day with PV accounting for 11.2 %.
The electrical grid appears intact but electricity prices took a tumble. According to an analysis by Bernard Chabot of BCCONSULT, low demand from large conventional power plants drove the electricity price index covering Germany, Austria, France and Switzerland to 2.75 cents per kilowatt hour at 2:00 pm.
Some more stats from Chabot's report
Solar and wind furnished a total of more than 436 gigawatt-hours.
At peak, solar furnished 20.5 gigawatts with wind peaking at 16.6 gigawatts.
Conventional power plants had to ramp down to 23 gigawatts at about noon.
We recently reported on an NREL study specific to one U.S. regional grid (the Western Interconnection), that found the costs of backing-up and integrating wind and solar are far less than the benefits of the renewables. We've reported on the utility model under threat by renewables. And we've heard from grid experts who see the European grid as strained and soon-to-be challenged by the onslaught of renewables.
"Greentech Media (GTM) produces industry-leading news, research, and conferences in the business-to-business greentech market. Our coverage areas include solar, smart grid, energy efficiency, wind, and other non-incumbent energy markets. For more information, visit: greentechmedia.com , follow us on twitter: @greentechmedia, or like us on Facebook: facebook.com/greentechmedia."
Die Studie "Definition und Marktanalyse von Bürgerenergie in Deutschland" des Marktforschungsinstitut trend:research und der Leuphana Universität Lüneburg zeigt: Der Beitrag der Bürger zur Energiewende ist fast viermal so groß wie der der Energieversorger. Bürgerenergie leistet einen wichtigen Beitrag zur Marktvielfalt und betreibt
fast die Hälfte der installierten Bio- und Solarenergie und sogar
mehr als die Hälfte der installierten Windenergie.
Insgesamt sind 47 Prozent der bis Ende 2012 installierten Leistung aus Erneuerbaren Energien in der Hand der Bürgerinnen und Bürger. Bürgerenergie kommt damit auf einen fast viermal so großen Anteil wie die Energieversorger, die 12 Prozent der Anlagen zur Erzeugung erneuerbaren Energie besitzen.
Bürgerenergie ist außerdem der Marktführer bei der Erzeugung von Ökostrom: Über 56.000 Gigawattstunden wurden in Erneuerbare-Energie-Anlagen erzeugt, die Bürgern gehören. Das sind 43 Prozent des produzierten Ökostroms und immerhin über 10 Prozent des gesamten Stromverbrauchs in Deutschland. Fast jede zweite Kilowattstunde Ökostrom kommt also aus Anlagen, die Bürgern gehören.
Die Studie differenziert bei der Bürgerenergie zwischen drei Akteursgruppen:
den Einzeleigentümern,
den Bürgerenergiegesellschaften und
der Bürgerenergie im weiteren Sinne.
Auf die Einzeleigentümer entfällt etwas mehr als die Hälfte der installierten Bürgerenergie.
Die Energiewende in Deutschland ist ein gesellschaftliches und wirtschaftliches Erfolgsprojekt. Dies ist auch das Verdienst der Bürgerenergie als ein wichtiger Treiber der Energiewende. Fast jede zweite Kilowattstunde Ökostrom kommt aus Anlagen, die Bürgern gehören. Eine breite Beteiligung von Bürgerinnen und Bürgern ist auch in Zukunft eine zentrale Voraussetzung für den Erfolg einer gesellschaftlich getragenen Energiewende.
Das Bündnis Bürgerenergie hat das Ziel, die Bürgerenergie als eine tragende Säule der Energiewende dauerhaft zu stärken.
Das Bündnis Bürgerenergie versteht sich als Kompetenzzentrum, das die gemeinsamen Interessen der Bürgerenergie bündelt und fokussiert. Es setzt sich ein für die politische
Interessensvertretung, die Schaffung einer "Kultur der Bürgerenergie" in der politischen Öffentlichkeit und die Förderung einer Bürgerenergie-Gemeinschaft durch bessere Vernetzung.
Am 29.01.2014 hat sich das Bündnis für Bürgerenergie auf einer Pressekonferenz in Berlin vorgestellt und seine Forderungen an die Politik deutlich gemacht: "Ohne Bürgerenergie keine Energiewende.
Bürgerbeteiligung darf nicht zu einer Frage von Ausnahmeregelungen und Bagatellgrenzen verkommen. Bürgerenergie muss im Zentrum der Politik stehen."
"Gabriels Energiepolitik übergeht Interessen von Bürgerinnen und Bürgern."
Neu gegründetes Bündnis Bürgerenergie übt scharfe Kritik am Kurs der Bundesregierung
Berlin, 29. Januar 2014.
Bürgerenergie ist der Marktführer der Energiewende. Allein im Jahr 2012 haben Bürgerinnen und Bürger über fünf Milliarden Euro in Erneuerbare Energien investiert. Fast jede zweite Kilowattstunde Ökostrom stammt aus Anlagen, die Bürgern gehören. Doch wenn in Berlin über die Zukunft der Energiewende entschieden wird, haben die Interessen der Bürgerenergie bisher keine Stimme. Dies soll sich nun ändern. Elf Organisationen haben heute in Berlin das Bündnis Bürgerenergie gegründet.
"Unser Ziel ist es, der Bürgerenergie im politischen Berlin eine kraftvolle Stimme zu verleihen", sagt Ursula Sladek, eine der Initiatorinnen des Bündnisses sowie aktuelle Trägerin des Deutschen Umweltpreises. "Die von der großen Koalition vorgeschlagenen Reformpläne sind ein Schlag in das Gesicht der Millionen Bürger, die sich für eine dezentrale Bürgerenergiewende einsetzen. Ein Schlag ins Gesicht der Millionen Menschen, die sich für aktiven Klimaschutz vor Ort, die Aufwertung ihrer Region, Generationengerechtigkeit, politische Teilhabe und langfristige Stabilität der Energiepreise engagieren."
Das neue Bündnis versteht sich als Kompetenzzentrum für alle Fragen der Bürgerenergie. "Die Bundesregierung hat noch nicht erkannt, dass vor allem die Bürgerinnen und Bürger vor Ort mehr Nachhaltigkeit in die Energieversorgung bringen. Ohne sie wäre die Energiewende noch weit von den politisch erklärten Zielen entfernt", erklärt Dietmar Freiherr von Blittersdorff, Aufsichtsrat des Bündnisses und Vertreter von "Energiewende Jetzt", einem Netzwerk für Bürgerenergiegenossenschaften. "Dieses Engagement gilt es zu erhalten und zu fördern, auch weil wir damit ein Vorbild für viele andere Länder sind."
Fordern Sie Ihre Bundestagsabgeordneten auf, sich für Bürgerenergie und die dezentrale Energiewende einzusetzen. Appellieren Sie an Ihn, dass er sich für Änderungen im EEG im Sinne der Bürgerenergie einsetzt:
Suchen Sie die Kontaktdaten Ihrer Bundestagsabgeordneten über Ihre Postleitzahl hier und finden Sie anschließend die Adresse seines Wahlkreisbüros in dieser Liste.
Schreiben Sie dem/den Abgeordneten von Ihrem Beitrag zur Energiewende und warum die aktuellen EEG-Vorschläge Bürgerenergie in Zukunft verhindern. Nutzen Sie dafür unseren Briefentwurf oder verfassen Sie selbst einen Brief.
Vereinbaren Sie einen Termin mit Ihrem Abgeordneten und sprechen mit ihm persönlich. Dafür haben wir für Sie ein Informationsblatt erstellt.
Informieren Sie Ihre Nachbarn, Freunde und Kollegen, befreundete Energiegenossenschaften u.a. und fordern sie auf, sich ebenfalls an der Aktion zu beteiligen. Posten Sie diesen Aufruf auf Facebook und anderen sozialen Medien. Stellen Sie ihn auf Ihre Website und verbreiten ihn per Newsletter.
Melden Sie sich bei uns, wen Sie kontaktiert haben und wie die Reaktion des /der Abgeordneten war: info@buendnis-buergerenergie.de
Unsere energiepolitischen Grundsätze zum Strommarkt
Energiewende ambitioniert fortsetzen:
Der Klimawandel ist weiterhin ein drängendes globales Problem. Deswegen brauchen wir eine schnelle Energiewende mit einem ambitionierten Ausbau der Erneuerbaren Energien.
Bürgerenergie als tragende Säule der Energiewende stärken:
Bürgerenergie ist der Marktführer der Energiewende. Fast jede zweite Kilowattstunde Ökostrom wird in Deutschland mit Anlagen produziert, die Bürgerinnen und Bürgern gehören. Eine erfolgreiche und akzeptierte Energiewende braucht Bürgerenergie. Bürgerenergie muss deshalb im Zentrum der Energiepolitik stehen.
Dezentralen Ausbau zur bedarfsgerechten Stromerzeugung fördern:
Erneuerbare Energien sind überall in Deutschland verfügbar. Daraus ergibt sich ein unschlagbarer Vorteil: Erneuerbare Energien können verbrauchsnah erzeugt werden. Die dezentrale Versorgung mit Strom aus erneuerbaren Quellen muss deshalb erste energiewirtschaftliche Priorität sein.
Direktversorgung mit Bürgerstrom zum Vorrang machen:
Unter Direktversorgung verstehen wir
Eigenverbrauch (d.h. den Verbrauch des selbst erzeugten regenerativen Stroms),
Direktverbrauch (d.h. Verbrauch des regenerativen Stroms in der unmittelbaren Umgebung der Erzeugung) und
Direktlieferung (d.h. die Belieferung mit Bürgerstrom aus definierten Erneuerbaren Energie-Anlagen).
Die Direktversorgung mit Bürgerstrom setzt Anreize für die bedarfsgerechte Stromerzeugung. Sie ist aus demokratischen, sozialen, ökologischen, volks- und energiewirtschaftlichen Gründen einer Vermarktung über den Graustrommarkt deutlich überlegen.
Marktoffenheit und Investitionssicherheit für Bürgerenergie - Kernforderungen zur EEG-Novelle 2014
Direktversorgung per Eigenverbrauch und Direktverbrauch ermöglichen:
Das EEG sollte den Weg zu einer echten Direktversorgung eröffnen. Entsprechend ist Strom aus Direktversorgung vollständig von der EEG-Umlage zu befreien oder zumindest in dem Umfang, dass kein wirtschaftlicher Nachteil gegenüber alten und abgeschriebenen konventionellen Kraftwerken besteht.
Verpflichtende Direktvermarktung nach Marktprämienmodell für Bürgerenergie-Akteure verhindern:
Die Pflicht zur Direktvermarktung nach dem Marktprämienmodell, verbunden mit dem Verlust der Grünstromeigenschaft, ist aus Sicht der Bürgerenergie grundsätzlich abzulehnen. Sie schädigt die Bürgerenergie und den weiteren Aufbau einer dezentralen Energieversorgung und somit auch die Bürgerenergie. Deshalb fordern wir eine garantierte Einspeisevergütung bis zu einer Anlagengröße von 10 MW und die Möglichkeit der regionalen Direktversorgung.
Ausschreibungen für Bürgerenergie-Akteure verhindern:
Ausschreibungen bevorzugen die großen Anbieter und bedeuten das Aus für Bürgerenergie. Bürgerenergie wird sich nur dann dynamisch weiterentwickeln, wenn die Förderung des Ausbaus der Erneuerbaren Energien den besonderen Anforderungen kleiner und regionaler Projekte gerecht wird. Nur so bleibt eine vielfältige Akteursstruktur im Energiemarkt erhalten. Und nur so wird die Akzeptanz und Dynamik der Energiewende gewahrt.
Vertrauensschutz für Bürgerenergie gewähren:
Das Bündnis Bürgerenergie fordert Vertrauensschutz mit vernünftigen Fristen. Die geplante, auf den 1.8.2014 abzielende Regelung macht viele für 2014 geplante Projekte unmöglich und verbrennt investiertes Bürgergeld in mehrstelliger Millionenhöhe.
Bürgerenergie-Konvent 2014: Bürgerenergiewende am Ende? Jetzt erst recht! - Pfade einer bürgernahen und dezentralen Energiewende
Am 17. und 18.Oktober 2014 fand in Fulda der 1. Bürgerenergie-Konvent statt. Rund 140 Teilnehmer diskutierten mit Vertretern aus Wirtschaft, Politik und Zivilgesellschaft zu den Aspekten der dezentralen Energiewende in Bürgerhand. 14 Experten standen Rede und Antwort in Dialogforen und Vorträgen.
Die BürgerEnergie eG bietet Bürgern die Möglichkeit, sich als Genossenschaftsmitglied aktiv beim Ausbau der erneuerbaren Energien sowie bei Aktivitäten zu Energieeffizienz und Umweltschutz zu beteiligen.
Veröffentlicht am 28. November 2013 von Nikolai Miron
Unsere Kampagne zur demokratischen, dezentralen und gerechten Energiewende in Bürgerhand endete mit den Koalitionsverhandlungen zwischen Union und SPD im November 2013. Mit Ihrer Unterstützung haben wir in den letzten Monaten eine Menge erreicht: 25.000 Menschen haben unsere Energiewende-Charta unterzeichnet, tausende EnergiebürgerInnen haben mit über 400 Aktionen im ganzen Land gezeigt, dass die Bürger die Energiewende erfolgreich gestalten.
Mit Ihrer Hilfe haben wir es geschafft, dass sich mehr als 25% der Bundestagsabgeordneten zur Energiewende in Bürgerhand bekannt haben und sich politisch hierfür stark machen wollen. Bürgerenergie ist im politischen Diskurs über die zukünftige Energiepolitik angekommen.
Wir bedanken uns für Ihre Unterstützung, Ihr Interesse und Ihre Begeisterung für die Energiewende in Bürgerhand! Erst mir Ihrer Hilfe ist der Erfolg unserer Kampagne möglich geworden!
Auch wenn die Kampagne "Die Wende - Energie in Bürgerhand" nun beendet ist, geht die Arbeit für die Bürger-Energiewende weiter. Und es wichtig, dass wir uns weiter aktiv und konstruktiv einbringen - für die dezentrale, demokratische Energiewende in Bürgerhand!
Stromexport aus Deutschland
Nach Berechnungen des Fraunhofer-Instituts für Solare Energiesysteme betrug der Saldo des deutschen Stromexportes im November 2013 rund drei Milliarden Kilowattstunden (TWh).
Zusammen mit den Vormonaten addiert sich damit der Exportsaldo für die ersten elf Monates dieses Jahres auf rund 27,5 TWh.
Damit liegt der Exportsaldo in diesem Jahr bereits jetzt weit höher als im bisherigen Rekordjahr 2012, dass auf einen Exportsaldo von 22,5 TWh kam.
Wissenschaftlicher Beirat der Bundesregierung Globale Umweltveränderungen (WBGU)
Die Wissenschaftler verweisen auf ihr Hauptgutachten "Welt im Wandel: Gesellschaftsvertrag für eine Große Transformation (im acamedia Cache, Zusammenfassung). In ihm fordern sie einen proaktiven Staat, d.h. einen, der in der kurzen uns verbleibenden Zeit (ein Jahrzehnt) die Pioniere des Wandels fördert und über eine zeitlich stabile Gesetzeslage Planungs- und Investitionsunsicherheit beseitigt.
Behinderungen der Pioniere des Wandels durch unsere christlich-soziale Regierung
EEG-Novelle
Bei der Ausarbeitung der Novelle (im Cache) des EEG-Gesetzes beteiligte oder förderte das Bundeskabinett diese Pioniere nicht. Es bremste vielmehr -im Widerspruch zum Geiste des Gutachtens- den bisher erfolgreich verlaufenen Ausbau der Erneuerbaren Energien mit der Begründung einer zu stark ansteigenden Strompreisentwicklung (einem gegenüber dem 2-Grad-Ziel nachrangigem Problem nach z.B.
Stellungnahme des BBEn anlässlich der öffentlichen Anhörung des Ausschusses für Wirtschaft und Energie im Deutschen Bundestag am 2. Juni 2014 zur Reform des Erneuerbare-Energien-Gesetzes (EEG), im Cache).
Für Saerbeck wird nicht nur ein Geschäftsmodell in Frage gestellt, sondern ein gesamtes Versorgungskonzept. Das geht davon aus, dass die Bürger selbst in die Anlagen investieren und damit nicht nur sich selbst, sondern auch die Region versorgen. Zum 1. Januar 2012 hat die Gemeinde vom Energieriesen RWE das Stromnetz gekauft. Wilfried Roos, Bürgermeister von Saerbeck: "Wir nutzen dieses Stromnetz, um den vor Ort erzeugten regenerativen Strom, den wir inzwischen im Überfluss haben, auch an die Endkunden zu liefern. Das ist das große Ziel, und das ist es, was die Bürger wollen."
Am kommenden Montag, 21. Juli, endet die Frist zur Beantragung der Registrierung für nach dem Kapitalanlagegesetzbuch nicht überwiegend operativ tätige Genossenschaften bei der BaFin. "Das ist die nächste Hürde für Bürgerenergieprojekte", kritisiert Dr. Verena Ruppert, Vorstand im Bündnis Bürgerenergie, und diese zeige bereits Wirkung. Es gibt eine deutliche Reduzierung der Investitionen von Genossenschaften. Die Unsicherheiten werden einfach zu groß.
Hinter dem juristischen Begriff verbirgt sich ein komplizierter Sachverhalt, über den die BaFin (Bundesanstalt für Finanzdienstleistungsaufsicht) im Einzelfall entscheiden muss. Denn ob das genossenschaftliche Engagement als operative Tätigkeit zu werten ist oder nicht, dazu gibt es bislang keine eindeutigen Auslegungen. Wer als Genossenschaft überwiegend operativ tätig ist, hat - vereinfacht gesagt - kein Problem; er fällt nicht unter das Kapitalanlagegesetzbuch. Wer nicht überwiegend operativ tätig, muss sich hingegen registrieren lassen - und das sind etliche Genossenschaften.
Darunter können etwa Beteiligungen an Großprojekten, die nicht rein genossenschaftlich, sondern in Kooperationen mit Stadtwerken und Kommunen umgesetzt werden, fallen. Die Genossenschaften stehen dann vor einem umfangreichen Kriterienberg mit sehr hohen und kaum zu erfüllenden Anforderungen.
So müssen z. B. Vorstände eine umfassende Qualifikation nachweisen. Das ist auch deshalb schwierig, weil viele von ihnen ehrenamtlich in den Genossenschaften arbeiten.
Dies führt dazu, dass die üblichen Beteiligungsmodelle - weil dann registrierungspflichtig - nicht mehr funktionieren.
Damit werden derzeit noch gängige und für die dezentrale Energieversorgung wichtige Kooperationsprojekte schon im Vorfeld verhindert.
Wer überdies der Registrierungspflicht unterliegt, sich aber nicht registriert, macht sich strafbar.
Eigentlich soll das Kapitalanlagegesetzbuch (KAGB) Anleger schützen. Hier würden sie jedoch so verunsichert, dass sie sich kaum mehr zu investieren trauen, sagt Ruppert.
Earth no longer provides stable boundaries for human activities. Man has become part of nature. We are massively changing the global environment.
(Sources (one of them): Johan Rockström et al, Planetary Boundaries: Exploring the Safe Operating Space for Humanity, Ecology and Society, 2009 - im Cache))
Timothy M. Lenton, Hermann Held, Elmar Kriegler, Jim W. Hall, Wolfgang Lucht, Stefan Rahmstorf, and Hans Joachim Schellnhuber, "Tipping elements in the Earth's climate system, Proc Natl Acad Sci U S Av.105(6); Feb 12 2008 (PubMedCentral PMC2538841) - in cache.
Table 1: Policy-relevant potential future tipping elements in the climate system and (below the empty line) candidates that we considered but failed to make the short list Source
"Society may be lulled into a false sense of security by smooth projections of global change. Our synthesis of present knowledge suggests that a variety of tipping elements could reach their critical point within this century under anthropogenic climate change.
The greatest threats are tipping
the Arctic sea-ice and
the Greenland ice sheet, and
at least five other elements could surprise us by exhibiting a nearby tipping point.
This knowledge should influence climate policy, but a full assessment of policy relevance would require that, for each potential tipping element, we answer the following questions:
Mitigation: Can we stay clear of ρcrit?
Adaptation: Can F be tolerated?
Notation: The parameters controlling the system can be transparently combined into a single control ρ, and there exists a critical control value ρcrit from which any significant variation by δρ > 0 leads to a qualitative change (Fqual) in a crucial system feature F, after some observation time T > 0, measured with respect to a reference feature at the critical value
The IPCC provides a thorough overview of mitigation (105) and adaptation (106) work upon which such a policy assessment of tipping elements could be built. Given the scale of potential impacts from tipping elements, we anticipate that they will shift the balance toward stronger mitigation and demand adaptation concepts beyond incremental approaches (107, 108). Policy analysis and implementation will be extremely challenging given the nonconvexities in the human-environment system (109) that will be enhanced by tipping elements, as well as the need to handle intergenerational justice and interpersonal equity over long periods and under conditions of uncertainty (110). A rigorous study of potential tipping elements in human socioeconomic systems would also be welcome, especially to address whether and how a rapid societal transition toward sustainability could be triggered, given that some models suggest there exists a tipping point for the transition to a low-carbon-energy system (111).
It seems wise to assume that we have not yet identified all potential policy-relevant tipping elements. Hence, a systematic search for further tipping elements should be undertaken, drawing on both paleodata and multimodel ensemble studies. Given the large uncertainty that remains about tipping elements, there is an urgent need to improve our understanding of the underlying physical mechanisms determining their behavior, so that policy makers are able "to avoid the unmanageable, and to manage the unavoidable""
At time 13:34 of Lecture 04, Episode 1, Dirk Messner uses Robert W. Fogel, Catching Up with the Economy, American Economy Review Vol. 89, No. 1, pp 1-21 (1999) (in cache) to correlate the growth of the world population and some major events in the history of technology.
Animation visualizes the extent of spacial and temporal variation of the electric power generated by photovoltaics (PV) and wind together. top part of figure: spatial distribution of wind speed, solar irradiance, and electric power (kW per square kilometer) from wind plus PV on day 0 (day 0 is visualized as vertical line in bottom part of figure). bottom part of figure: total PV and wind power generated in Germany as a function of time, displayed for a week (vertical line = day 0).
Between 2011 and 2015 Germany will open 10.7 GW of new coal fired power stations. This is more new coal coal capacity than was constructed in the entire two decades after the fall of the Berlin Wall. The expected annual electricity production of these power stations (76 TWh/a)
will far exceed that of existing solar panels (29.7 TWh/a in 2013) and
will be approximately the same as that of Germany's existing solar panels (29.7 TWh/a in 2013) and wind turbines (47.2 TWh/a in 2013) combined (data from Fraunhofer ISE).
Solar panels and wind turbines however have expected life spans of no more than 25 years. Coal power plants typically last 50 years or longer. At best you could call the recent developments in Germany's electricity sector contradictory.
Können Politik und Medien die Bevölkerung im gleichen Maße wie bisher missachten und desinformieren, wenn Einzelpersonen durch ihre Photovoltaik-Anlagen mehr Macht haben?
Anders formuliert: Bremsen Konservative und Sozialdemokraten den Ausbau der Photovoltaik aus, weil sie z.B. Strom-"Smart Mobs" (eine neue Art von Streik) verhindern wollen?
PV-Strom
Quelle der Daten (im Cache), Mathematica-Notebook (Zur Orientierung: x TWh/a wird jährlich von einer installierten PV-Leistung von x/0.9 GW erbracht (0.9 TWh/a = 900 h/a * 1 GW).
Figure: Between 2000 and 2012 the German annual photovoltaic (PV) electricity generation doubled every 1.6 years.
2014 energy production from PV: 35.2 TWh (in cache). Its full potential would have been reached in 2015 - 2016 had the growth rate (doubling time = 1.6 years) persisted.
Absturz der Solarwirtschaft nach der EEG-Novelle PV der Großen Koalition (im Cache)
2012 waren noch etwa 100 000 Personen in der Solarwirtschaft beschäftigt, 2015 waren es noch 31 600.
(Quelle: Bundesverband Solarwirtschaft e.V.)
line potential (UBA) 248 TWh/a: "constrained" potential,
In the case of photovoltaic energy, the "constrained" potential in Germany was
calculated by taking into account the available space of 1620 km2 to deploy solar panels5 - which includes roofs and building facades - and 900 full load hours per year
of solar radiation. 275 GW production capacities would then yield 248 TWh. Source: 2.3 Renewable Energy Potentials, in: Energieziel 2050 , Umweltbundesamt, 2010.
line UBA: in "regions network secenario" used fraction of potential 248 TWh/a.
after V. Quaschning an installable power 175 (129.5) GWp corrresponds to an annual generated energy 157 (112) TWh/a, using the above mentioned conversion Wp 900 full load hours/year = 0.9 (kWh/a).
line Quaschning shows the growth recommended by V. Quaschning. For 2040 he recommends 400 GW installed PV-power (corresponding to 360 TWh/a).
Die in Deutschland jährlich durch Photovoltaik (PV) erzeugte Strommenge verdoppelte sich alle 1.6 Jahre.
Sie betrug im Jahr 2012 26.4 TWh.
Davon kommen (geschätzt nach der Arbeit von trend:research zusammen mit der Leuphana-Universität, Lüneburg) etwa die Hälfte aus PV-Anlagen im Besitz von Einzelpersonen.
Zum Vergleich: Im Jahr 2012 insgesamt in Deutschland erzeugte Strommenge: 628.7 TWh.
Folglich kamen 2012 etwa 2% (0.02 = 1/2 26.4/628.7) der Stromerzeugung von Einzelpersonen.
Mit der Verdoppelungszeit von 1.6 Jahren würde Deutschland in 5 bis 6 Jahren 20% des Stroms von Einzelpersonen beziehen. Diese könnten daher auf die Politik Einfluss nehmen ("Strom Smart Mob").
2014 EEG: Ausbaukorridor: Variation der Degression der Einspeisevergütung nach Art. 31 (im Cache) und Art. 51 (im Cache) soll den Ausbau auf 2.4 - 2.6 GWp pro Jahr begrenzen.
Windstrom
Quelle der Daten (im Cache) (Zur Orientierung: x TWh/a wird jährlich von einer installierten Windturbinen-Leistung von x/2.42 GW erbracht (2.42 TWh/a = 2420 h/a * 1 GW).
Figure: German annual electricity generated with on-shore wind turbines doubled
potential (UBA): As estimated in (1), approximately 13.8% of the German land area are suited for wind turbine farms which would provide up to 1200 GW installed wind power with 2900 TWh/a electricity production, using 2420 full load hours per year (1200 GW x 2420 full load hours/a = 2900 TWh/a).
line UBA is the potential amount of electricity generated from wind ("constrained" potential, UBA study (2)) as given in Table 2"Rate of Utilization of Available Renewable Energy Potential in Germany" under the "Regional Networks Scenario".
"For the simulation, we assumed onshore wind power plants to have a hub height of 135 m and a nominal capacity between 1.8 and 5 MW depending on their respective location. Offshore wind power plants were assumed to be of the 5 MW category, which is commonly used today.
Excluding inter alia area under nature protection and settlement area, we arrive at the conclusion that at least 1% of Germany’s total area is suited for the construction of wind power plants. Based on this assumption we calculated an installed capacity of 60 GW as the "constrained" potential for onshore wind power. Assuming the use of very efficient installations, approximately 3000 full load hours per year can be expected as an average for Germany. Thus the potential of onshore wind energy thus amounts to 180 TWh." Source: 2.3 Renewable Energy Potentials, in: Energieziel 2050 (in Cache), Umweltbundesamt, 2010.
Growth corridors
line 2014 EEG is the "Breathing Lid" (2.4 GW growth per year), imposed by the German federal government in 2014 (EEG-Novelle 2014).
line Quaschning shows the growth recommended by V. Quaschning. For 2040 he recommends 200 GW installed on-shore windpower (corresponding to 600 TWh per year).
Die in Deutschland jährlich durch Windenergie erzeugte Strommenge verdoppelte sich
in den Jahren 1991 - 2004 alle 2.3 Jahre,
im darauf folgenden Zeitraum alle 6 Jahre.
Sie betrug im Jahr 2012 50.7 TWh.
2014 EEG: Ausbaukorridor: Variation der Degression (im Cache) der Einspeisevergütung soll den jährlichen Ausbau auf den Korridor 2.4 - 2.6 GW installierte Leistung begrenzen.
PV im deutschen Ländervergleich
Mehr bewegen: Neue Energie im Programm der Grünen zur Landtagswahl 2016 in Mecklenburg-Vorpommern.
"Wir setzen uns dafür ein, dass Mecklenburg-Vorpommern zur bundesdeutschen Energieversorgung einen
Anteil proportional zu seiner Fläche beiträgt. Das bedeutet, dass wir 6,5 Prozent des bundesdeutschen
Stromverbrauchs aus regenerativen Energien in unserem Bundesland erzeugen wollen. Dafür ist eine
Erhöhung der installierten Windkraftleistung nötig. Mit insgesamt 2.200 effizienteren Windkraftanlagen
kann diese Erhöhung erreicht werden. Derzeit stehen etwa 1.800 Anlagen im Land. ...
Damit die Energieversorgung in Deutschland sauberer und sicherer wird, brauchen wir:
landesweite Förderungsrahmen, die sich nicht nur an Wärme- und Energieeffizienz, sondern auch an Einsparzielen orientieren.
eine Verdreifachung der Strommenge aus Solaranlagen, denn bisher decken wir nicht einmal 20 Prozent unseres eigenen Energiebedarfes durch Sonnenenergie.
maximal 2% der Landesfläche für Gebiete mit Windkraftanlagen.
Im Rahmen der vorliegenden GIS-basierten Studie wurde das Potenzial der Windenergie an Land ermittelt.
Auf Basis der getroffenen Annahmen und gewählten Windenergieanlagentechnik ergibt sich ein grundsätzlich verfügbares Flächenpotenzial von rund 49.400 km2 bzw. 13.8% der Landesfläche der Bundesrepublik Deutschland.
Dies entspricht einem Potenzial von rund 1190 GW installierbarer Leistung mit einem Ertrag von 2900 TWh/a.
(Anmerkung von J. Gruber: gesamte in Deutschland installierte Kraftwerkskapazität: 163 GWe, Produktion elektrischer Energie: 509 TWh pro Jahr)
Bei der Potenzialermittlung
wurde keine Wirtschaftlichkeitsbetrachtung durchgeführt, sondern nur technische und ökologische Restriktionen berücksichtigt.
Allerdings konnten Belange, die Einzelfallbetrachtungen bedürfen (vor allem der besondere Artenschutz, aber auch z. B. Radaranlagen) im Rahmen der Studie nicht sinnvoll abgebildet werden.
Das technisch-ökologische Potenzial, bei dem u. a. auch der besondere Artenschutz zu berücksichtigen ist, fällt somit erheblich kleiner aus.
Das davon realisierbare Potenzial für die Windenergienutzung an Land ist nochmals deutlich geringer. Wesentliche Einflussfaktoren, die in der Potenzialstudie nicht berücksichtigt wurden, aber in der Praxis der konkreten Realisierung von Windenergievorhaben entgegenstehen können, sind unter anderem
räumliche Entwicklungsziele der Gebietskörperschaften (z. B. Vorranggebiete für Siedlungsentwicklung),
Einwände und Vorbehalte der Flächeneigentümer oder Anwohner vor Ort aufgrund fehlender Akzeptanz,
wirtschaftliche Bedingungen im konkreten Einzelfall (z. B. Investitionskosten im Verhältnis zur Windhöffigkeit) sowie
Nutzungsansprüche, die anhand der zugrunde liegenden Daten nicht erfasst werden konnten (z. B. zivile und militärische Funk- oder Radaranlagen sowie weitere militärische Belange).
Zudem wurden für zwei zentrale Einflussgrößen, die zu diesem hohen ermittelten Potenzial beigetragen haben, Sensitivitätsanalysen durchgeführt.
Das große ermittelte Potenzial resultiert maßgeblich aus der modernen heute verfügbaren Windenergieanlagentechnik, die wegen großer Nabenhöhen und Rotordurchmesser eine Erschließung von Standorten im Binnenland sowie aufgrund geringer Lärmemissionen auch die Einhaltung der Anforderungen des Lärmschutzes im Nahbereich von Siedlungen ermöglicht. Mit den beiden zugrunde gelegten Referenzanlagen (siehe Kapitel 4.1) können im bundesweiten Mittel 2440 Volllaststunden pro Jahr erreicht werden. Heute liegt der Bundesdurchschnitt aller Anlagen bei 1700 Volllaststunden.
Bei einer Vernachlässigung von Standorten, an denen die als Referenzanlage der Studie zugrunde gelegte Schwachwindanlage weniger als 2200 Volllaststunden erreicht, ergibt sich ein Potenzial von 930 GW installierbarer Leistung mit einem potenziellen Ertrag von 2400 TWh pro Jahr.
Einen besonders großen Einfluss auf das Potenzial haben darüber hinaus die zugrunde gelegten Schutzabstände zu sensiblen Bereichen, insbesondere zu Wohnbauflächen. So hat eine weitere Sensitivitätsberechnung am Beispiel der Wohnbauflächen ergeben, dass eine Verdopplung des angenommenen Mindestabstandes der Referenzanlagen zur Wohnbebauung das Flächenpotenzial um 75 % reduzieren würde.
Trotz der hohen Abhängigkeit der Ergebnisse der bundesweiten Windpotenzialstudie von den zugrunde gelegten Annahmen wird deutlich: Die Windenergie an Land kann ihrer Schlüsselrolle im Portfolio der erneuerbaren Energien gerecht werden auch einen erhöhten Strombedarf, z. B. im Zuge eines Einsatzes im Wärmesektor oder einer Zunahme der Elektromobilität, kompensieren. Es existieren ausreichend Standorte, die in Verbindung mit modernen Windenergieanlagen eine gleichmäßige Stromeinspeisung durch eine hohe Auslastung versprechen.
Im bundesweiten Betrachtungsmaßstab lässt das ermittelte Potenzial den Schluss zu, dass für den zukünftigen Ausbau der Windenergie an Land zunächst die Erschließung möglichst konfliktarmer und kosteneffizienter Standorte in Betracht gezogen werden kann. Ungeachtet der Ergebnisse der Studie kann in einzelnen Planungsräumen der Windenergie nur dann substanziell Raum geschaffen werden, wenn Kriterien für die Ausweisung von Windenergiegebieten entsprechend angepasst werden. In welchem Umfang das ermittelte Potenzial letztendlich ausgenutzt werden kann und soll, hängt von den oben genannten Einflussfaktoren ab und ist Gegenstand gesellschaftlicher und politischer Entscheidungen sowie planerischer Abwägung auf den verschiedenen Ebenen.
Zusammenfassung
Die Windenergie an Land kann ihrer Schlüsselrolle im Portfolio der erneuerbaren Energien gerecht werden. Grundsätzlich stehen ausreichend Standorte für die Windenergienutzung zur Verfügung. Das ermittelte Potenzial ist über ganz Deutschland verteilt. Moderne Windenergieanlagen können auch im Binnenland eine sehr hohe Auslastung erreichen. Im bundesweiten Betrachtungsmaßstab ermöglicht das Potenzial eine Nutzung der Windenergie an möglichst konfliktarmen und kosteneffizienten Standorten.
"Während Photovoltaik- und Windkraftanlagen die sogenannte EEG-Umlage entrichten müssen, wenn sie Strom aus dem Netz beziehen, sind Braunkohlebagger davon befreit. Diese Subvention beläuft sich für die klimaschädlichen Braunkohle inzwischen auf geschätzte 200 Millionen Euro. Dieses Ungleichgewicht soll sogar noch deutlich ausgeweitet werden. Während Betreiber von regenerativen Anlagen künftig auch Umlagen entrichten sollen, wenn sie ihren Strom selbst verbrauchen, bleiben Atom- und Kohlekraftwerke davon weiterhin verschont. Zahlen müssen das wie immer die Stromkunden."
"Bislang konnten alle Betreiber von Kraftwerken ihren selbst erzeugten Strom ohne jegliche Abgaben auch selbst verbrauchen. Abgaben und Umlagen wurden nur für Strom aus dem Netz fällig. Für die Errichtung neuer Photovoltaikanlagen ist dieses Eigenstromprivileg inzwischen von grundlegender Bedeutung. ... Wird ein Teil des erzeugten [PV-]Solarstroms selbst genutzt, lässt sich der Bezug von teurem Netzstrom reduzieren. Das erhöht die Wirtschaftlichkeit der [PV-]Anlagen und macht viele Solarprojekte überhaupt erst rentabel. Genau hier setzt ein weiterer Kürzungsplan der Regierung an. Neue regenerative Anlagen sollen auf selbst verbrauchten Strom künftig 70 Prozent der EEG-Umlage zahlen. Das wären derzeit 4,4 Cent pro Kilowattstunde. Nur sehr kleine Anlagen von weniger als 8 bis 10 Kilowatt sollen davon verschont bleiben. Das dürfte die Wirtschaftlichkeit vieler Photovoltaikprojekte zerstören."
"Durch die geplante Eigenverbrauchsumlage wird somit die Wirtschaftlichkeit von Solaranlagen zugunsten der Atom- und Kohlekraftwerke weiter verschlechtert. Dabei hat der Kraftwerkseigenverbrauch einen enormen Umfang. Rund 35 Milliarden Kilowattstunden werden in Deutschland von den großen Kraftwerken selbst umlagefrei verbraucht. Würde man darauf die volle EEG-Umlage von 6,24 Cent pro Kilowattstunde erheben, ließen sich über 2 Milliarden Euro erlösen. Dieser Betrag könnte direkt zur Reduktion der EEG-Umlage genutzt werden. Diese ließe sich dadurch um gut 0,5 Cent pro Kilowattstunde senken. Damit würde ein Durchschnittshaushalt bei einem Stromverbrauch von 3500 Kilowattstunden pro Jahr immerhin um 18 Euro entlastet.
Newsletter.
Die 3 folgenden Abschnitte zwischen den horizontalen Strichen sind daraus entnommen.
Studie: Regionale Verteilungswirkungen durch das Vergütungs- und Umlagesystems des EEG
Die Studie vom Thünen-Institut für Ländliche Räume in Braunschweig hat regionale Verteilungseffekte der Energiewende in Deutschland analysiert. Sie zeigt u.a., dass ländliche Regionen von den EEG-Vergütungszahlungen profitieren und höhere Wertschöpfungs- und Beschäftigungseffekte aus dem Betrieb und der Wartung der Energieanlagen erzielen. Eher städtisch geprägte Regionen profitieren hingegen von den höheren Wertschöpfungseffekten aus der Herstellung der Anlagen. Die komplette Studie finden Sie hier (im Cache).
"Die Untersuchung analysiert regionale Verteilungseffekte der Energiewende in Deutschland. Im Fokus steht die regionale Verteilung erneuerbarer Energieanlagen, des erneuerbar erzeugten Stroms sowie des EEG-Finanzierungssaldos für das Jahr 2011. Räumliche Betrachtungseinheit sind die Bundesländer, Landkreise und siedlungsstrukturelle Kreistypen. Mit Hilfe der Verteilung der Anlagen und der Herstellerfirmen werden die Wertschöpfungs- und Beschäftigungseffekte aus der Erzeugung von Strom durch erneuerbare Energieträger für ländliche und nicht ländliche Regionen abgeschätzt. Zudem werden sektorale Verteilungseffekte des EEG-Finanzierungs-systems am Beispiel des Agrarsektors untersucht.
Die Untersuchung zeigt, dass ländliche Regionen maßgeblich zur Stromerzeugung aus erneuer-baren Energien beitragen. Die Energieanlagendichte ist zumeist höher als in den nicht ländlichen Regionen. Nach wie vor gibt es auch ländliche Räume mit geringer Produktion erneuerbarer Energien. Ländliche Regionen profitieren von den EEG-Vergütungszahlungen und erzielen höhere Wertschöpfungs- und Beschäftigungseffekte aus dem Betrieb und der Wartung der Energieanlagen. Nicht ländliche Regionen profitieren hingegen von den höheren Wertschöpfungseffekten aus der Herstellung der Anlagen."
Zentrale und dezentrale Ausbaupfade der Stromversorgung aus EE im Vergleich
Ziel des Projekts, das von der Haleakala-Stiftung, der 100 prozent erneuerbar stiftung und des BVMW Bundesverband mittelständische Wirtschaft beauftragt wurde ist, die Kosten- und Wertschöpfungsunterschiede von zentral und dezentral orientierten Ausbaupfaden der EE benennen zu können und daraus Empfehlungen für die Ausgestaltung des Marktdesigns bei der Fortführung der Energiewende zu formulieren. Die Studie zeigt, dass auf einer reinen Kostenebene der dezentrale und zentrale Ausbau gleichwertig sind. Führt man zusätzliche Bewertungskriterien, wie die kommunale Wertschöpfung ein, ergeben sich aber deutliche Vorteile eines dezentralen Ausbaus. Die komplette Studie finden Sie hier (im Cache).
IWES-Studie gibt Antworten auf das "Die Kosten der Energiewende"-Argument
Das Fraunhofer Institut für Windenergie & Energiesystemtechnik hat im Januar 2014 die Studie "Geschäftsmodell Energiewende" veröffentlicht. Darin legt das IWES eine Finanzierungsstrategie für die Energiewende vor und zeigt, dass Investitionen in die Energiewende durchaus rentabel sind und wie sie bis 2050 finanziert werden könnten. Mehr hier (im Cache).
"Aktuell prägen vor allem die Kosten der Energiewende die öffentliche und politische Diskussion. Dabei wird verkannt, dass die Energiewende ein risikoarmes Investitionsvorhaben mit positiver Gewinnerwartung darstellt. Aus diesem Grund hat das Fraunhofer-IWES in dem vorliegenden Forschungsprojekt einen Vorschlag zur Finanzierung der Energiewende erarbeitet. Diese Arbeit wurde im Rahmen der "Herkulesprojekt Energiewende"-Aktivitäten des Fraunhofer IWES durchgeführt.
Den Investitionen in neue kapitalkostenintensive Technologien sind dabei die vermiedenen fossilen Brennstoffe der alten betriebskostenintensiven Technologien gegenüber zu stellen. Das neue Energieversorgungssystem wird von Wind- und Sonnenenergie bestimmt sein, die neben dem Stromsektor auch die Bedarfe im Verkehrs- und Wärmesektor decken werden. Das Ergebnis der umfangreichen Berechnungen zeigt, dass die Finanzierbarkeit des Gesamtprojekts Energiewende auch unter sehr konservativen Annahmen möglich ist (d.h. ohne steigende Brennstoffpreise und CO2-Schadenskosten). Selbst sehr ambitionierte Klimaziele, wie eine erneuerbare Vollversorgung statt nur einer Reduktion der Treibhausgase um 80% sind wirtschaftlich darstellbar. Das Kostenargument sollte somit im Kontext klimapolitischer Entscheidungen korrigiert werden auf die Bilanzierung des Gesamtgeschäfts mit Kosten und Erlösen.
Unter den Rahmenbedingungen eines gleichbleibenden Preisniveaus für Primärenergie des Jahres 2011 ergibt sich eine Verzinsung der gesamten Investitionen von 2,3% inflationsbereinigt. (Abbildung 1 und Kapitel 4 im oben genannten Bericht). Je weiter man den Betrachtungshorizont über das Jahr 2050 hinaus fortschreibt, um so höher ist die zuerwartende Rendite, da die Ausgaben für das zukünftige Repowering der Erneuerbaren-Energien-Anlagen nur noch einen Bruchteil der vermiedenen Brennstoffkosten ausmachen werden.
Wenn Preissteigerungen für Öl und Erdgas über den Betrachtungszeitraum bis 2050 angenommen werden, erhöht sich die Rentabilität weiter. Mit Berücksichtigung der Preissteigerungen (real) des Preispfads des Netzentwicklungsplans NEP 2014 (lineareFortschreibung) [BNetzA 2013] oder des BMU-Klimaschutzszenarios 2050 [Öko-Institut,ISI, 2013] ergibt sich eine Verzinsung der gesamten Investitionen von 4,0 bis 6,7% inflationsbereinigt.
Nicht berücksichtigt sind in dieser Bilanzierung die positiven Rückwirkungen auf die Gesamtwirtschaft, die durch die starke, dauerhafte Investitionstätigkeit in eineproduktive Infrastruktur ausgelöst werden (Wirtschaftswachstum, Arbeitsplätze). Nicht berücksichtigt sind weiterhin die Subventionen für konventionelle Kraftwerke und Brennstoffe, welche gegenwärtig noch geleistet werden.
C. Kemfert: Bisher wurde der Ökostrom mit garantierten Preisen vergütet, das hat Sicherheit für Investoren geschaffen. Nun sollen diese Sätze stark gekürzt und der Neubau an Solar- und Windkraftanlagen begrenzt werden. Stattdessen werden wieder neue Kohlekraftwerke gebaut. Das macht es schwer, die Klimaziele noch zu erreichen.
...
Die Verbraucherpreise sind gestiegen, das stimmt. Leider wird Ökoenergie dabei zum Sündenbock gemacht. Viele Unternehmen zahlen gar keine Umlage dafür. Deshalb müssen Haushalte mehr bezahlen und subventionieren so indirekt die Unternehmen. Dabei kostet der Strom an der Börse so wenig wie noch nie, unter 4 Cent/kWh! Nur geben die Versorger diese günstigen Preise nicht an die Kunden weiter.
...
Frage (Tagesspiegel): Sie behaupten, die Konzerne und Stadtwerke kassieren einfach vier Mal mehr bei ihren Kunden, als sie selbst bezahlen?
C. Kemfert: Ein guter Deal, nicht wahr? Der Verbraucherpreis setzt sich allerdings aus vielen Faktoren zusammen. Auch Steuern spielen eine Rolle. Die Ökostromumlage ist zwar auf mehr als 6 Cent gestiegen. Aber das liegt zum größten Teil gar nicht am Zubau von Wind- und Solaranlagen, sondern daran, dass die Stromunternehmen ihre alten Kraftwerke weiterlaufen lassen und es nun ein Überangebot gibt, das den Börsenpreis drückt. Das vergrößert den Abstand zwischen den Garantiepreisen für den Ökostrom und dem Marktpreis. Diese Differenz wird als Umlage den Kunden in Rechnung gestellt. Nur schlagen viele Versorger das einfach auf den alten Preis obendrauf, was nicht gerechtfertigt ist.
Bis vor kurzem haben die Stromkonzerne und auch so manches Stadtwerk tatsächlich extrem hohe Gewinne erzielt. Aber sie haben auch zu lange in einen überdimensionierten konventionellen Kraftwerkspark investiert. Jetzt brechen die Erlöse weg, und die Manager wollen mit großem Getöse beim Staat Zuschüsse erzwingen. Dabei hätten sie es besser wissen können, die Energiewende kam ja nicht über Nacht. Im Übrigen sind die Verluste bei RWE in erster Linie in England und Holland entstanden. Auch Eons Defizite resultierten vor allem aus überhöhten Gaspreisen durch russische Zulieferer. Mit der Behauptung, die Energiewende treibe sie in den Ruin, wollen manche nur von ihren eigenen Fehlern ablenken.
Fakt ist: Die Industrie kriegt ihren Strom so billig wie seit zehn Jahren nicht mehr. Die Großkunden können direkt an der Börse kaufen und müssen die Ökostrom-Umlage nicht zahlen. So schlecht kann es der Industrie also gar nicht gehen. Einen wirklich hohen Stromverbrauch hat beispielsweise die Aluminiumindustrie. Deren Verbandspräsident hat neulich klar bekannt, seine Branche profitiere von der Energiewende. Als in Holland kürzlich eine Aluminiumhütte geschlossen wurde, war die Begründung, gegen die niedrigen deutschen Strompreise könne das Werk nicht konkurrieren.
Tagesspiegel:Warum, bitte schön, warnen dann so viele hysterisch vor dem Niedergang wegen der Energiewende, wenn das alles gar nicht stimmt?
C. Kemfert: Das ist das, was ich Kampf um Strom nenne. Es geht darum, alte Pfründe zu sichern. Sie wollen den Wechsel von Kohle-, Gas- und Atomkraft zu regenerativen Energien nicht mitgehen.
Tagesspiegel: Es stehen viele Jobs und viel Geld auf dem Spiel.
Selbstverständlich läuft da ein Strukturwandel, der auch die Arbeitswelt betrifft. Die Kohleindustrie beispielsweise beschäftigt in Deutschland etwa 40 000 Menschen. Beim Ausbau der erneuerbaren Energien sind allerdings schon 380 000 Arbeitsplätze entstanden - und in den nächsten Jahren könnten noch mal 180 000 dazukommen, wenn wir nicht die Energiewende ausbremsen. Und wir dürfen weitere Sektoren nicht vergessen, die auch profitieren werden, wie beispielsweise die Energieeffizienz und nachhaltige Mobilität.
Tagesspiegel: Die Umlage scheint bei der Solarenergie rausgeschmissenes Geld. Wir werden am Ende mehr als 100 Milliarden Euro in deren Entwicklung stecken, produziert wird allerdings jetzt in China. Die einst prosperierende deutsche Solarindustrie ist am Ende.
C. Kemfert: Ein Mythos. Die genannte Summe bezieht sich auf einen Zeitraum von 30 Jahren. Es handelt sich hier um Investitionen, die Arbeitsplätze bringen. Für Brennstoffimporte gibt Deutschland hingegen knapp 100 Milliarden Euro aus - jedes Jahr! Die Solarförderung hat unglaublich viel erreicht. Die Kosten der Solarenergie wurden erheblich reduziert. Heute kostet der Strom aus dem neuen, weltgrößten Solarkraftwerk in Kalifornien nur 3,5 Cent pro Kilowattstunde und ist damit billiger als Kohle- und Atomstrom.
Hier wurden die Investoren [in Solarenergie] regelrecht vertrieben, indem dauernd die Bedingungen für den Betrieb von Solaranlagen verändert und verschlechtert wurden. Die chinesischen Produzenten sind nur deshalb so billig, weil sie extrem günstige Kredite von den staatlichen Banken bekommen haben und so über lange Zeit zu Dumpingpreisen anbieten konnten. Wir hätten dagegenhalten können. In anderen Sektoren geschieht das ja auch. Denken Sie nur an die Luftfahrtindustrie. Auch die Kohle wurde jahrzehntelang subventioniert.
Tagesspiegel: Warum muss Solarstrom überhaupt noch gefördert werden? Der Strom vom Dach ist für Normalverbraucher momentan schon billiger als der aus dem Netz.
C. Kemfert: Deswegen senkt man dafür jetzt auch die Vergütungssätze. Aber Minister Gabriel will nun sogar diesen privaten Ausbau bremsen, indem er für den Stromverbrauch aus eigener Erzeugung die Ökostromumlage einführen will. Das halte ich für einen Fehler.
Tagesspiegel: Bei allem technischen Fortschritt ist eines nicht geklärt: Wie soll die Versorgung gesichert werden? Es gibt nun mal dunkle Tage, an denen zudem der Wind nicht weht. Eon-Chef Johannes Teyssen sagt jetzt schon, dass mit der konventionellen Stromerzeugung kein Geld mehr zu verdienen sei, und fordert darum Subventionen dafür, dass er Kraftwerke in Bereitschaft hält, weil sonst der Blackout drohe.
C. Kemfert: Noch ein Mythos. Derartige Subventionen machen den Strompreis teuer und nützen dem Strommarkt wenig. Selbst Vattenfall bestätigt unsere Studien, dass solche Subventionen unnötig sind, weil es im kommenden Jahrzehnt in Deutschland hohe Überkapazitäten gibt. Was wir brauchen, sind ein Ausbau der Stromnetze und mehr Speicheranlagen.
Energiewende im Stromsektor erfolgreich fortführen: Gemeinsames Positionspapier der Umwelt- und Erneuerbaren Energienverbände zur Novelle des EEG
Zu den notwendigen Maßnahmen neben der Weiterentwicklung des Förderrahmens für die Erneuerbaren Energien zählen:
die Verankerung ambitionierter Klimaschutzziele und konkreter Mindestziele für den Ausbau der Erneuerbaren Energien in der deutschen und europäischen Gesetzgebung
eine stärkere technische Integration der deutschen Energiewende in eine europäische Energiewirtschaft
eine baldige Klärung mit der EU-Kommission, dass das EEG keine Beihilfe ist
eine Stärkung der Instrumente für den Klimaschutz wie den EU-Emissionshandel. Notwendig ist eine angemessene Einspeisung von Klima- und anderen externen Kosten. Dies würde aucvh die EEG-Umlage senken. Solange dies nicht gegeben ist, bedarf es neuer zusätzlicher nationaler Instrumente.
die Entwicklung eines neuen Marktdesigns, das sich an den Erneuerbaren Energien als Leittechnologie orientiert und den Ausstieg aus der Atomenergie sowie die schrittweise Reduzierung des Einsatzes der klimaschädlichen Kohlekraft umsetzt. Zur Entwicklung eines angepassten Marktdesigns fordern wir einen transparenten Prozess mit breiter Beteiligung unterschiedlicher Interessengruppen, der einen Aktionsplan für Flexibilitätsoptionen incl. Zeitplan zur Absicherung der Versorgungssicherheit mit CO2-armen Anlagen erarbeitet.
ein zügiger Netzaus- und -umbau. Dabei muss sich der Netzausbau an der Geschwindigkeit orientieren, mit der die Erneuerbaren Energien ausgebaut werden und nicht umgekehrt.
Systemdienstleistungen wie z.B. die Bereitstellung von Regelenergie müssen dabei zukünftig in immer stärkerem Maße durch EE-Anlagen erbracht werden Das Energieversorgungssystem muss dabei aber einen regenerativen Energiemix hervorbringen, der dies ermöglicht.
Da auch die Fotovoltaik inzwischen kostengünstig ist, ist ein dynamischer und naturverträglicher weiterer Ausbau ohne den bestehenden 52 GW-Deckel notwendig. Der bestehende "atmende" Degressionsmechanismus für die PV-Vergütung muss so angepasst werden, dass er einen Markteinbruch unterhalb des politisch gewünschten Ausbaukorridors rechtzeitig auffangen kann. Zudem sollte eine begrenzte Flächenöffnung im EEG für Solarkraftwerke ermöglicht werden, wenn diese von energiewirtschaftlicher Relevanz (z.B. durch Bereitstellung von Systemdienstleistungen oder bei Verbundeinspeisung mit anderen Erneuerbaren Energien) sind und landwirtschaftliche und naturschutz-fachliche Belange berücksichtigt werden.
(in cache)
An analysis of new wind, solar, nuclear and CCS based on current support schemes in the UK and Germany
New wind and solar can provide carbon-free power at up to 50 % lower generation costs than new nuclear and Carbon Capture and Storage. This is the result of a conservative comparison of current feed-in tariffs in Germany with the agreed strike price for new nuclear in the UK (Hinkley Point C) and current cost estimates for CCS, neglecting future technology cost reductions in any of the four technologies.
A reliable power system based on wind, solar and gas backup is 20 % cheaper than a system of new nuclear power plants combined with gas. A meaningful comparison of the costs of different energy technologies should take into account the need for backup capacities and peak load plants. Such a comparison shows that while additional costs arise for backup gas capacity in a system based on wind and solar PV, these costs are small compared to the higher power generation cost of nuclear.
BY KILEY KROH MAY 13, 2014 AT 11:16 AM UPDATED: MAY 14, 2014 AT 8:35 PM
Wind turbines and transmission lines in Nauen near Berlin, Germany.
CREDIT: AP Photo/Ferdinand Ostrop
On Sunday, Germany’s impressive streak of renewable energy milestones continued, with renewable energy generation surging to a record portion — nearly 75 % — of the country’s overall electricity demand by midday. With wind and solar in particular filling such a huge portion of the country’s power demand, electricity prices actually dipped into the negative for much of the afternoon, according to Renewables International.
In the first quarter of 2014, renewable energy sources met a record 27 % of the country’s electricity demand, thanks to additional installations and favorable weather. “Renewable generators produced 40.2 billion kilowatt-hours of electricity, up from 35.7 billion kilowatt-hours in the same period last year,” Bloomberg reported. Much of the country’s renewable energy growth has occurred in the past decade and, as a point of comparison, Germany’s 27 % is double the approximately 13 % of U.S. electricity supply powered by renewables as of November 2013.
Observers say the records will keep coming as Germany continues its Energiewende, or energy transformation, which aims to power the country almost entirely on renewable sources by 2050.
“Once again, it was demonstrated that a modern electricity system such as the German one can already accept large penetration rates of variable but predictable renewable energy sources such as wind and solar PV power,” said Bernard Chabot, a renewable energy consultant based in France, via email. “In fact there are no technical and economic obstacles to go first to 20 % of annual electricity demand penetration rate from a combination of those two technologies, then 50 % and beyond by combining them with other renewables and energy efficiency measures and some progressive storage solutions at a modest level.”
CREDIT: Bernard Chabot
To reach the lofty goal of 80 % renewables by 2050, Germany had to move quickly. Despite being known for gray skies, the country has installed an astonishing amount of solar photovoltaic (PV) power — setting multiple solar power generation records along the way. At the end of 2012, Germany had installed considerably more solar power capacity per capita than any other country. The rapid growth has slowed, however, with 3.3 GW of PV installed in 2013, compared to 7.6 in 2012. And as countries like the U.S., Japan and China catch up, installations have continued to drop in 2014.
Regardless, a recent analysis by the consulting firm Eclareon found that solar power has reached grid parity in Germany, meaning once all of the costs are accounted for, the price of commercial solar power is now equal to retail electricity rates.
And wind power reached record output levels last year — producing a massive 25.2 GW and accounting for 39 % of the electricity supply on a single day in December.
The unprecedented growth of solar PV in particular has been fueled in large part by policies that incentivize clean energy. Germany's simple feed-in tariff (FIT) policy, which pays renewable energy producers a set amount for the electricity they produce under long-term contracts, has driven the solar power boom. But as installations continued to outpace government targets, Germany announced last year that it would begin scaling back its feed-in tariff.
The FIT is financed by a surcharge paid by utility customers, but a major part of the problem stems from the fact that industry is largely exempt from the renewables surcharge — meaning the burden falls on households. Rather than adjust the industry exemption, the government instead proposed a “PV self-consumption charge” on new photovoltaic systems, something Germany’s Solar Industry Association recently announced it plans to challenge in court.
The equity of the renewables surcharge isn’t the only criticism of Germany’s power transformation. Along with cutting out fossil fuel-generated energy to a large extent, the transition to renewables includes completely phasing out nuclear power. These goals are only achievable in combination with greatly reduced energy demand. Instead, coal imports are increasing in order to meet the country’s baseload power demands. And retail electricity rates are high and rising, putting pressure on lower income individuals in particular.
But many of the criticisms are largely overblown, according to Amory Lovins of the Rocky Mountain Institute. The modest uptick in coal-fired generation was substituting for pricier natural gas, not representative of a return to coal as it’s often mischaracterized. In fact, last December, as renewable energy production continued to grow and energy demand shrank, Germany’s largest utility chose not to renew two long-term contracts for coal-fired power.
And while much is made of rising industrial electricity prices, Lovins points out that in fact, “giant German firms enjoy Germany's low and falling wholesale electricity prices, getting the benefit of renewables' near-zero operating cost but exempted from paying for them.”
And as for the impact on the consumer, “the FIT surcharge raised households' retail price of electricity seven % but renewables lowered big industries' wholesale price 18 %. As long-term contracts expire, the past few years' sharply lower wholesale prices could finally reach retail customers and start sending households' total electricity prices back down.”
What’s more, “in Germany you have the option of earning back your payments, and far more, by investing as little as $600 in renewable energy yourself,” Lovins writes. “Citizens, cooperatives, and communities own more than half of German renewable capacity, vs. two % in the U.S.”
Challenges aside, Energiewende — rooted in the acknowledgement that a fossil fuel-based energy system is not sustainable — is remarkable for its scope and its widespread support, particularly in a heavily industrialized country like Germany. “Don't forget what Germany is doing right now. It's changing its power supply,” Paul Hockenos, a Berlin-based energy expert and journalist, told Voice of America earlier this year. “The last time when an energy supply was changed was the industrial revolution; this is something that has never been done before.”
The analysis is the third installment in a regular report by the consulting firm Eclareon, done on behalf of an international group of sustainable energy interests. This installment was also the first to look at solar power in the commercial sector rather than the residential sector. It looked at a standard 30 kilowatt solar photovoltaic system for your average commercial building, and the built a methodology to assess its “leveled cost of energy” (LCOE) in seven different countries: Brazil, Chile, France, Germany, Italy, Mexico and Spain.
The LCOE of any source of power — solar, natural gas, coal, wind, etc — accounts for everything that goes into determining that electricity’s cost:
installation,
maintenance,
investment,
the electricity itself,
depreciation, and so forth.
The goal is to give a more complete picture of each power source’s economic position vis-a-vis its rivals.
According to Eclareon’s analysis, solar’s LCOE in Italy and Germany is now at “grid parity,” meaning it’s even with retail electricity prices in general in those countries. Spain’s already gotten there as well, and Mexico and France are coming up.
Solar’s LCOE actually dropped significantly from 2012 to 213 in every country but Germany — between 20 and 25 %. Even Germany saw a drop of just over 10 %. But these drops don’t always translate into grid parity (the Y axis in the graph), since the prices of other sources are always moving as well.
The analysis also looked at the level of regulatory support solar enjoys in each country. (The X axis.) This does not mean subsidies. Right now, regulatory law in both European countries and the states isn’t set up to handle a world in which electricity consumers also generate and sell their own electricity. Sometimes there are added fees for people who generate their own solar power, sometimes they aren’t legally allowed to sell their excess power back to the grid, and sometimes laws can rocket back and forth from solar-friendly to solar-unfriendly in short order. As a result, meaningful market competition between solar power and other forms of electricity is really hard to come by, even when their respective prices have pulled alongside one another.
None of the countries have an ideal circumstance. But some — those in the top right-hand quadrant — get closer to a world in which electricity is generated not just by a small number of really big suppliers, but by lots and lots of little suppliers as well, and everyone can buy and sell electricity to everyone else as they see fit.
The value and structure of the electricity rates in each location will have an impact on the economic decision of self-consuming PV electricity or buying electricity from the utility. The structure of a utility rate can range from a simple flat charge to a complex combination of charges that depend on various factors:
Energy costs, which increase with electricity demand (kWh).
Capacity costs, which vary with peak power demand (kW).
Availability of rates that vary with the time of the day and/or month within a year (i.e. TOU rates).
Availability of rates that increase with the amount of electricity purchased (i.e. tiered rates).
Generally, PV self-consumption will be attractive whenever LCOE is lower than the energy costs charged by the utility for each kWh consumed from the grid. Moreover, if PV self-consumption results in a change on the consumption pattern of the user, the additional avoided costs should also be accounted for within the LCOE calculation. In this regard, capacity costs can decrease as a result of a reduction of peak demand from the grid. However, for this to happen, several conditions must be met. The following illustration exemplifies this situation:
As the above Figure shows, for a commercial consumer it is not easy to save on capacity costs on a given month. This is due to the following reasons:
On some months, PV generation is interrupted by the presence of clouds.
On other months, peak load reduction is limited by the magnitude of the (second highest) peak demand, which does not coincide with PV generation.
In this analysis, the capacity charge will not be included, but the reader should bear in mind that throughout the lifetime of the PV system it is possible that some savings of capacity charges can be reached, albeit small.
"Für das Erreichen der Klimaschutzziele sind fallende Preise für Kohlestrom eine Katastrophe. Eigentlich sollte der CO2-Zertifikatehandel den Preis für Strom aus klimaschädlichen Kraftwerken verteuern und damit zu einem Rückgang der Nachfrage und damit der Emissionen führen. Die Wirtschaftskrise in Europa, eine viel zu großzügige Zuteilung der Zertifikate und der schnelle Ausbau erneuerbarer Energien haben aber zu einem enormen Überangebot an Zertifikaten und damit einem dramatischen Preisverfall im Jahr 2013 geführt. Die Klimafolgekosten durch den ungezügelten Kohlendioxidausstoß müssen künftig aber auch bezahlt werden. Rücklagen dafür gibt es keine. Das Umweltbundesamt beziffert die realen Klimafolgekosten auf 70 Euro je Tonne Kohlendioxid [UBA07b]. Anfang 2013 lag der Preis für CO2-Zertifikate unter 5 Euro je Tonne Kohlendioxid. Die nicht umgelegten Klimafolgekosten entsprechen damit alleine in Deutschland einer Subvention von über 20 Milliarden Euro für fossile Kraftwerke."
Entwicklung der Preise für Haushaltsstrom, Heizöl und Benzin. Erzeugung von PV-Strom und Wndstrom in Deutschland
"Eine Studie vom Fraunhofer Institut für Solare Energiesysteme zeigt zwar eindrucksvoll, dass ein vollständig erneuerbares Energiesystem nicht teurer sein wird als die heutige Versorgung [ISE12]. Das gilt aber erst für die Phase des Endausbaus. Die Investitionen für den Umbau verursachen in der Übergangszeit zwangsläufig höhere Kosten. Wirklich überraschend ist das nicht. Auch bei der Einführung der Kernenergie mussten die Strompreise erhöht werden. Während die noch hohen Preise für erneuerbare Energien kontinuierlich sinken, kennen die Preise für fossile Energieträger nur eine Richtung: nach oben. Die Preise für Heizöl haben sich zwischen 2000 und 2013 rund verdreifacht und sind damit erheblich stärker als die Strompreise angestiegen. Im gleichen Zeitraum ist der Preis für Solarstrom auf ein Viertel gefallen (Abbildung 4.23). Es ist nur eine Frage der Zeit, bis erneuerbare Energien überall preiswerter sein werden als konventionelle Energien. Die Länder, die sich zuerst von Erdöl, Kohle, Erdgas und Uran sowie den damit verbundenen Preissteigerungen entkoppelt haben, werden erheblich davon profitieren."
Quelle: Marian Klobasa, Dr. Mario Ragwitz, "Gutachten zur CO2-Minderung im Stromsektor durch den Einsatz erneuerbarer Energien", Bericht für die Arbeitsgruppe Erneuerbare Energien Statistik (AGEE-Stat) im Auftrag des Zentrum für Sonnenenergie- und Wasserstoff-Forschung Baden-Württemberg (ZSW), Fraunhofer Institut für System- und Innovationsforschung Karlsruhe, Januar, 2005
Spezifische Lebenszyklusemissionen von rund
25 g CO2eq pro kWhe Strom (WBGU, 2009a; 6,8 - 68 g CO2 pro kWhe) verursacht dabei Windenergie
gefolgt von Solarenergie mit etwa 75 g CO2eq pro kWhe.(12,5 - 360 g CO2 pro kWhe).
Auch Wasserkraft kann mit sehr niedrigen Emissionen um die 25 g CO2eq pro kWhe (WBGU, 2009a; 3,5 - 120 g CO2 pro kWhe) verbunden sein, wobei dies allerdings standotabhängig ist. In Einzelfällen können bei flachen Stauseen in produktiven tropischen Regionen Methanemissionen zu höheren Emissionen aus Wasserkraftnutzung führen.
Literatur:
WBGU, 2009a: Wissenschaftlicher Beirat der Bundesregierung Globale Umweltveränderungen, "Welt im Wandel: Zukunftsfähige Bioenergie und nachhaltige Landnutzung", Hauptgutachten 2009. Berlin: WBGU.
There's a really interesting new study out that compares the carbon footprint of solar panels manufactured in Europe and China.
The basic result shows that because Chinese manufacturing is less energy efficient, and reliant on coal fired electricity, the Chinese panels have a bigger carbon footprint. In fact the footprint of Chinese panels is double that of European ones, as you can see in chart from the study to the left.
Stephen Lacey is a Senior Editor at Greentech Media, where he focuses primarily on energy efficiency. He has extensive experience reporting on the business and politics of cleantech. He was formerly Deputy Editor of Climate Progress, a climate and energy blog based at the Center for American Progress. He was also an editor/producer with Renewable Energy World. He received his B.A. in ... see complete profile
Greentech Media (GTM) produces industry-leading news, research, and conferences in the business-to-business greentech market. Our coverage areas include solar, smart grid, energy efficiency, wind, and other non-incumbent energy markets. For more information, visit: greentechmedia.com , follow us on twitter: @greentechmedia, or like us on Facebook: facebook.com/greentechmedia.
Siva Power, the CIGS thin film company that re-emerged last year with a new team and approach to the market, is out with an ambitious cost roadmap for its modules.
Before getting into the details of Siva's plan, it's worth remembering one important number related to CIGS thin film: twenty.
That's the approximate number of companies attempting to scale the technology that have either gone bankrupt, gone silent, shifted strategy or have been acquired since 2009. Very few of the venture capitalists who shoveled billions of dollars into the technology ever saw their money again.
Brad Mattson, the CEO of Siva Power, said he's learned from the mistakes of companies that tried to scale too quickly or overestimated their ability to reduce costs. In 2011, when Siva Power was still called Solexant, Mattson took the helm at the company, ditched plans to build a 100-megawatt factory, and focused on R&D. After years of experimenting with different materials and production processes, Siva eventually settled on co-evaporated CIGS on large glass substrates.
"Historically, co-evaporation has yielded the highest overall efficiency of all the CIGS deposition processes" compared to roll-to-roll, sputtering and other techniques, said Shyam Mehta, GTM Research's lead upstream solar analyst.
Mattson called the technology "a gift of physics" that offers the highest thin film efficiencies and the fastest production process. With $60 million in venture funding, Siva plans to build a 300-megawatt plant and eventually produce modules for 28 cents per watt over the next four years, assuming the facility is ever actually built.
This is the company's newly released cost roadmap, which Mehta notes is "essentially a bunch of numbers in a spreadsheet." Siva doesn't even have its pilot line fully built yet.
The projections factor in labor, energy and water requirements, equipment needs, materials and overhead. Siva says its first 300-megawatt production line will produce CIGS modules at 40 cents per watt. After another two years of operation, the company believes it can get all-in costs down to 28 cents per watt.
The Department of Energy has set a production cost target of 50 cents per watt by 2030. In March, Jinko solar reported that it was producing crystalline silicon modules for 48 cents per watt. According to GTM Research's analysis, top Chinese producers could be making solar modules for 36 cents per watt by 2017.
Mattson told GTM's Eric Wesoff that he believes those numbers are "completely unsustainable" because they don't factor in large subsidies from the Chinese government.
So is Siva's plan "sustainable," considering that the company hasn't even built out its first pilot production facility? Mattson continues to talk about the "gigawatt era" in solar. But only one CIGS company, Solar Frontier, has gotten there so far, and Siva isn't anywhere close.
"It is not outside the realm of possibility, assuming they do hit their goals for scale, efficiency and manufacturing yield, which are undoubtedly ambitious," said Mehta.
The most obvious issue is timing. Due to technical problems related to deposition, CIGS thin film producers have historically underestimated their time to scale. "History has shown that almost all thin film startups have taken significantly longer to scale up" than projected, said Mehta.
The biggest technical challenge for Siva will be ensuring uniform deposition on the large glass substrates while keeping production levels high. (Applied Materials also used large glass substrates for amorphous silicon thin film. That ended poorly, mostly due to efficiency issues.)
"This is where it's fair to be skeptical, even though Siva's team is world-class," said Mehta.
For now, Siva's cost structure will sit in a spreadsheet untested until the firm builds out its first production line.
PV-Module Prices
Source: Paul Maycock, Bloomberg New Energy Finance, FSLR filings.
click on figure to enlarge
Inflation adjustment using US PPI, R2 of c-Si regression = 0.94, R2 of FSLR regression = 0.98. Data since 2007 based on Bloomberg New Energy Solar Spot Market Price Index
72 wind turbines of Siemens' G4 product platform to deliver a total electrical generating capacity of 288 MW
Pioneering joint service plan with the neighboring DanTysk project
Specialized shared servicing ship will enable highly efficient operation
Vattenfall has awarded Siemens Energy an order for 72 Model SWT-4.0-130 wind turbines for its new Sandbank offshore wind farm. The project is being erected 90 kilometers west of the island of Sylt in water depths between 25 and 37 meters within the exclusive economic zone off the German North Sea coast. A pioneering service plan for the project will generate synergy from its close vicinity to DanTysk offshore wind farm, utilizing joint operations to drive down the maintenance costs of both projects. Vattenfall has contracted Siemens to perform maintenance services on the Sandbank installations for an initial period of five years.
Siemens' Model SWT-4.0-130 wind turbines ordered for the project represent the latest generation of the Siemens G4 platform wind turbines.
They combine the proven technology of the most-built offshore wind turbine series - over 900 units worldwide rated at 3.6 megawatts are in operation - with a significantly enhanced power output of 4 megawatts at comparable maintenance costs.
What is more, the unit's rotor - measuring 130 meters in diameter - delivers optimum energy yield even at low and moderate wind speeds.
The advanced rotor blades also contribute to efficiency: The 63-meter-long aeroelastic blades are designed to be flexible under high wind loads, and can therefore be manufactured with up to 20 % reduced mass compared to conventional rotor blades.
Hence, once commissioned at the end of 2016, Sandbank will count among the most modern offshore wind farms anywhere in the world. Construction is scheduled to commence in summer 2015.
Lighting the Way:
The Top Ten States that Helped Drive America's Solar Energy Boom in 2013
Jordan Schneider (Frontier Group), Rob Sargent (Environment America Research & Policy Center)
Released by Environment California Research & Policy Center
Figure ES-2:(Installed) Solar Electricity Capacity (MWpeak)
The amount of solar photovoltaic capacity (MWpeak) in the United States has tripled in the past 2 years.
For comparison: Germany (added by J. Gruber)
(Installed) Solar Electricity Capacity in Germany in 2012: appr. 30 000 MWpeak (= 380 Wpeak/person) (assuming a ratio generated electricity (Watt)/installed electricity (Wattpeak) = 0.1),
The Top 10 states with the most solar electricity installed per capita account for only 26 % of the U.S. population but 87 % of the nation's total installed solar electricity capacity.* These 10 states - Arizona, California, Colorado, Delaware, Hawaii, Massachusetts, Nevada, New Jersey, New Mexico and North Carolina - possess strong policies that are enabling increasing numbers of homeowners, businesses, communities and utilities to "go solar".
Other rising stars include New York, Vermont and Georgia, which have large or fast-growing solar energy markets and strong new solar policies or programs implemented since mid-2013.
Unfortunately, the success of solar power in these and other states has been threatened by recent attacks by fossil fuel interests and electric utilities on key solar policies, such as net metering. Despite those attacks, many states have reaffirmed and expanded their commitments to solar energy over the past year by increasing solar energy goals and implementing new policies to expand access to clean solar power.
Solar energy is good for the environment, consumers and the economy.
Solar photovoltaics (PV) produce 96 % less global warming pollution per unit of energy than coal-fired power plants over their entire life cycle, and 91 % less global warming pollution than natural gas-fired power plants.
Solar energy benefits consumers by reducing the need for expensive investments in long-distance transmission lines.
Solar energy can lower electricity costs by providing power at times of peak local demand.
The cost of installed solar energy systems has fallen by 60 % since the beginning of 2011.
Solar energy creates local clean energy jobs that can't be outsourced. More than 140,000 people currently work in America's solar energy industry, about half of them in jobs such as installation that are located in close proximity to the places where solar panels are installed.
Solar energy is on the rise - especially in states that have adopted strong public policies to encourage solar power.
The amount of solar photovoltaic capacity* in the United States has tripled in the past two years.
America's solar energy revolution is being led by 10 states which have the highest per-capita solar electricity capacity* in the nation. These 10 states - Arizona, California, Colorado, Delaware, Hawaii, Massachusetts, Nevada, New Jersey, New Mexico and North Carolina - account for 26 % of the U.S. population and 20 % of U.S. electricity consumption, but 87 % of total U.S. solar electricity capacity and 89 % of the solar electricity capacity installed in 2013. (See Figure ES-2 and Table ES-1.)
Table ES-1. (Installed) Solar Electricity Capacity (MWpeak>) in the Top 10 Solar States (ranked by cumulative capacity per resident; data from the Solar Energy Industries Association)
In Germany the cumulative (installed) solar photovoltaic capacity is approximately 380 Wattpeak per person, assuming a ratio generated electricity (Watt)/installed electricity (Wattpeak) = 0.1.
From 2012 to 2013, Arizona maintained its first-place ranking as the state with the largest amount of solar energy capacity per capita, with 275 Watts/person at the end of 2013. California and Massachusetts both advanced two spots in the rankings to fourth place and eighth place, respectively, significantly increasing their per-capita installed solar energy capacity. North Carolina continued its aggressive build-out of utility-scale solar energy, growing its per-capita capacity by more than 140 % since 2012.
America's leading solar states have adopted strong policies to encourage homeowners and businesses to "go solar." Among the Top 10 states:
Nine have strong [net metering policies]. In nearly all of the leading states, consumers are compensated at the full retail rate for the excess electricity they supply to the grid.
9 have strong statewide [interconnection policies]. Good interconnection policies reduce the time and hassle required for individuals and companies to connect solar energy systems to the grid.
All have [renewable electricity standards] that set minimum requirements for the share of a utility's electricity that must come from renewable sources, and eight of them have solar carve-outs that set specific targets for solar or other forms of clean, distributed electricity.
9 allow for [creative financing options] such as third-party power purchase agreements, and eight allow Property Assessed Clean Energy (PACE) financing.
States in the Top 10 are far more likely to have each of these key solar policies in place than other states, reinforcing the conclusion of U.S. Department of Energy research linking the presence of key solar policies to increases in solar energy deployment.
Beyond the Top 10 states for per-capita solar energy capacity, there are several "advancing" states that have accelerated growth of their solar energy markets by embracing solar-friendly policies.
With 250 MW of solar electricity capacity installed at the end of 2013, New York ranks ninth in the nation for cumulative solar energy capacity. New York recently expanded its commitment to solar energy by investing an additional $1 billion in its highly successful NY-Sun Initiative and extending the program through 2023. The state has also developed an innovative, market-based structure for solar energy incentives that will provide long-term funding certainty for solar energy developers.
Vermont ranked eighth for per-capita solar energy capacity installed during 2013. Though Vermont is the only state in the Northeast not to have a renewable portfolio standard, it has many other strong policies that drive solar energy development. The state continued its track record of solar energy leadership in 2013 by raising its net metering cap from four % of a utility's peak load to 15 %.
Georgia's per-capita solar energy capacity took a dramatic leap forward in 2013 after the state Public Service Commission voted to require the state's largest utility to construct or procure 525 MW of solar energy capacity by the end of 2016. The state added 9 W per person in 2013 - more than eight times as much as it added in 2012.
Strong public policies at every level of government can help unlock America's potential for clean solar energy. To achieve America's full solar potential:
Local governments should adopt policies guaranteeing homeowners and businesses the right to use or sell power from the sunlight that strikes their properties. They should also implement financing programs, such as property-assessed clean energy (PACE) financing, adopt bulk purchasing programs for solar installations, and adopt solar-friendly zoning and permitting rules to make it easier and cheaper for residents and businesses to "go solar". Municipally-owned utilities should promote solar by providing net-metering, Value of Solar rates, and by making investments in community-scale and utility-scale solar projects.
State governments should set ambitious goals for solar energy and adopt policies - including many of those described in this report - to meet them. State governments should also use their role as the primary regulators of electric utilities to encourage utility investments in solar energy, implement rate structures that maximize the benefits of solar energy to consumers, and support smart investments to move toward a more intelligent electric grid in which distributed sources of energy such as solar power play a larger role.
The federal government should continue key tax credits for solar energy, encourage responsible development of prime solar resources on public lands in the American West, and support research, development and deployment efforts designed to reduce the cost of solar energy and smooth the incorporation of large amounts of solar energy into the electric grid.
All levels of government should lead by example by installing solar energy technologies on all government buildings.
* In this report,
"solar photovoltaic capacity" refers to installed solar photovoltaic systems, both distributed and utility-scale.
"Solar electricity capacity" refers to all solar technologies that generate electricity, including concentrating solar power systems that use the sun's heat - rather than its light - to generate electricity.
The figures in this report do not include other solar energy technologies, such as solar water heating.
Quelle: WEE-Blitzumfrage unter 89 Energie-Kommunen (Juli/2014)
"Das neue EEG droht die Energiewende auszubremsen und dabei vor allem die kleinen Marktakteure wie Energiegenossenschaften zu treffen. Obwohl im Koalitionsvertrag mehr Bürgerbeteiligung versprochen wurde, wird die Aktivität von Energiegenossenschaften nun deutlich eingeschränkt", kritisiert Dr. Eckhard Ott, Vorsitzender des Vorstands des Deutschen Genossenschafts- und Raiffeisenverbands e.V (DGRV)."
Energiegenossenschaften haben bislang rund 1,35 Milliarden Euro in den Ausbau Erneuerbarer Energien investiert. Allein in diesem Jahr werden nach Schätzungen des DGRV rund 300 Millionen Euro an Investitionen zurückgehalten. Die Energiegenossenschaften kritisieren vor allem die volle EEG-Belastung von selbst produziertem Ökostrom, der an Mitglieder oder Abnehmer vor Ort verkauft wird.
Wilfried Roos, Bürgermeister von Saerbeck seit 1999: "Wir haben jetzt mit den neuen Anlagen das erste Planungsjahr hinter uns. Jetzt wird es äußerst schwierig zu sagen, wie die EEG-Rahmenbedingungen am Ende des Jahres 2015 oder 2016 aussehen werden, wenn die Windräder gebaut werden. ... Früher hatten wir verbindliche Rahmenbedingungen. In den letzten Jahren wurden diese derart oft geändert, dass selbst erfahrene Kommunen wie Saerbeck kaum noch durch den Dschungel finden. Jetzt brauchen wir inzwischen einen Fachanwalt für EEG-Recht, um einen Antrag zu stellen, damit wir eine Photovoltaikanlage planen können. Das hat Ausmaße angenommen, die nicht mehr akzeptabel sind."
Für Saerbeck wird nicht nur ein Geschäftsmodell in Frage gestellt, sondern ein gesamtes Versorgungskonzept. Das geht davon aus, dass die Bürger selbst in die Anlagen investieren und damit nicht nur sich selbst, sondern auch die Region versorgen. Zum 1. Januar 2012 hat die Gemeinde vom Energieriesen RWE das Stromnetz gekauft. Roos: "Wir nutzen dieses Stromnetz, um den vor Ort erzeugten regenerativen Strom, den wir inzwischen im Überfluss haben, auch an die Endkunden zu liefern. Das ist das große Ziel, und das ist es, was die Bürger wollen."
Bisher funktionierte das auch ganz gut. Doch mit den neuen Anlagen geht das nicht mehr. Schließlich muss Saerbeck den Strom aus solchen neuen Anlagen an der Strombörse als sog. Graustromdirekt vermarkten (GÖRG Rechtsanwälte - Das Erneuerbare-Energien-Gesetz 2014). Das passt gar nicht zum Konzept der kommunalen Energiewende, wie sie Saerbeck verfolgt. Roos: "Unsere Intention war von Anfang an, dass die Genossenscaft etwas produziert und die Genossen selbst daran teilhaben. Im Sinne der Daseinsvorsorge halten wir das für sehr wichtig. Der Ursprungsgedanke, der Genossenschaftsgedanke, ist eine Interessensgemeinschaft zu gründen, um den Ertrag direkt den Genossen zukommen zu lassen. Die Bürger suchen mit ihren Investitionen kein Abschreibungsmodell. Sie möchten am Ende eine schwarze Null in der Bilanz sehen."
Es ist für die Bürger wichtig, als Versorger den Mehrwert und die finanziellen Aufwendungen zum Erwerb der Energie vor Ort zu halten. Dazu müssen die Bedingungen in ein Gesamtkonzept passen, bei dem die lokale und regionale Direktvermarktung den Vorrang bekommt... Berlin regiert gnadenlos an den Konzepten der Kommunen vorbei. Dabei haben die Saerbecker kein Problem mit der Direktvermarktung. Derzeit nutzen sie die Marktprämie und verkaufen den Strom aus dem Bioenergiepark an ein regionales Stadtwerk, Die dafür zusätzlich gezahlte Managementprämie bekommt zu einem Teil das Stadtwerk. Der Rest bleibt in Saerbeck und wird in weitere Anlagen gesteckt - unter anderem auch in die [7] neuen Windenergieanlagen. Der Zwang zur Direktvermarktung an der Börse widerspricht jedoch dem eigentlichen Ansatz der Saerbecker, den Strom regional zu vermarkten und damit auch die gesamte Wertschöpfung in der Region zu halten. Roos: "Statt den Strom an der Börse zu verramschen, könnte mit dem Gesetz ganz bewusst die regionale Direktvermarktung gefördert werden. Das könnte z.B. über die Befreiung von der Stromsteuer passieren oder indem man die EEG-Umlage nur zum Teil auf den regional vermarkteten Strom erhebt. Schließlich muss für regional vermarkteten Strom niemand große Stromtrassen bauen."
Die vorhandenen Resourcen können sogar noch besser genuzt werden, wenn die Übernahem der Stromnetze durch die Kommunen wieder stärker unterstützt wird. Roos: "Das ist aber sicherlich im Rahmen einer dann zu erwartenden Lobbypolitik für die großen Energieversorgungsunternehmen unwahrscheinlich. Es ist schließlich kontraproduktiv für diese Energieversorger, weil sie damit viele kleine Versorgungsnetze verlieren würden. Aber trotzdem ist das für die Energiewende von unten absolut unabdingbar."
Eine riesige Hürde sieht Roos aber vor allem mit den Ausschreibungen auf die Gemeinde zukommen. Ähnlich wie Energiegenossenschaften haben die Saerbecker nicht so viel Geld, um an den Ausschreibungen teilzunehmen. Roos: "Wir als kleine Gemeinde können uns unter den Rahmenbedingungen des EU-Rechts die Teilnahme an Ausschreibungen gar nicht leisten. Wir müssen ein Fachbüro einschalten, um die ganzen förderrechtlichen Rahemenbedingungen einzuhalten. Dagegen sind die großen Energieversorger mit ihren riesigen Rechtsbateilungen viel zu stark aufgestellt."
Dazu kommt noch das Risiko, riesige Investitionen in die Projektentwicklung zu stecken und dann bei den Ausschreibungen zu verlieren. Damit blockiert das neue EEG weitere Investitionen.
Die Bürger von Saerbeck sind bereit, in weitere Anlagen zu investieren. Eigentlich wären auch die Möglichkeiten vorhanden. Die Gemeinde ist eine von 6 KWK-Modellkommunen in NRW, die von Düsseldorf gefördert wird. Geplant ist neben dem Bau eines Vanadium-Redox-Flow-Speichers auch eine Power-to-Gas-Anlage und der Aufbau eines Nahwärmeversorgungsnetzes.
(im Cache)
"Die Gemeinde St. Peter im südlichen Schwarzwald hat ihre Energiewende mit Solar- und Windkraft, eigenen Hackschnitzeln und Pellets umgesetzt. Die Bürger sparen dabei viel CO2 und viel Geld ein und haben zudem ihre Unabhängigkeit wiedererlangt."
"Im Zentrum von St. Peter sind bis dato ca. 50 % der Gebäude mit etwa 900 Einwohnern an das Fernwärmenetz angeschlossen worden. Die Genossenschaft betreibt das Heizwerk, der Genossenschaftsverband kümmert sich um die steuerlichen Angelegenheiten und Mitarbeiter der Gemeinde betreuen das Heizkraftwerk. Für die finanziell auf Sparflamme kochende Gemeinde war die Umstellung der Energieversorgung ein wahrer Segen, wie Hauptamtsleiter Bernd Bechtold bestätigt: "Vor dem Fernwärmeanschluss hatten Turnhalle, Schule und Hallenbad einen jährlichen Verbrauch von gut 80.000 Liter Heizöl, gut 65.000 Euro, die eigene Fernwärme aus nachwachsenden Rohstoffen kostet uns nur noch 45.000 Euro im Jahr". Darüber hinaus bleibt nicht nur die Wertschöpfung aus der eigenen Energieversorgung und der Ersparnis durch den überflüssig gewordenen Einkauf von Heizöl und Gas der Dorfgemeinschaft erhalten. Gesamt St. Peter spart derzeit jährlich ca. 850.000 l Heizöl ein, was eine Reduktion von 2.700 t CO2 bedeutet."
"... Das Fernwärmenetz wurde in der Zeit vom Juni 2009 bis November 2011 verlegt. Daran schloss man einen Hackschnitzelkessel mit einer Leistung von 1.700 kW an. Als Redundanz sowie zur Absicherung von Lastspitzen dienten zu diesem Zeitpunkt zwei Heizölkessel mit einer Leistung von 920 bzw. 1.750 kW. Zwei Pufferspeicher mit einem Fassungsvermögen von 48.000 l fangen die Lastspitzen ab und dienen der Wärmeüberbrückung."
"Das BHKW von der Firma Burkhardt in St. Peter hat ein Leistungsvolumen von 180 kW Strom und 270 kW Wärme. ... In den ersten Monaten seit der Inbetriebnahme produzierte das BHKW im Durchschnitt 187 kWh Strom und 280 kWh Wärme bei einer Verfügbarkeit von 86 %. Die laufenden Betriebs- und Unterhaltungskosten des Heizwerks und Fernwärmenetzes können aus den Einnahmen der Wärmelieferung und der Stromeinspeisung auf EEG-Basis bestritten werden."
"Als Bioenergiedorf galt es 100 % des Strom- sowie mindestens 50 % des Wärmebedarfs aus erneuerbaren Energien und nachwachsenden Rohstoffen selbst zu erzeugen. "
"In St. Peter produzieren jährlich vier Windkraftanlagen, fünf Kleinwasserkraftwerke, PV-Systeme mit einer installierten Leistung von 1.200 kW sowie das BHKW 11 Mio. kWh an Strom, der in das öffentliche Netz eingespeist wird. Der Strombedarf liegt bei 7 Mio. kWh."
"Die Wärmebilanz ist hingegen (noch) nicht ausgeglichen: Der Produktion von 8.100 MWh aus der Genossenschaft steht ein Wärmeverbrauch von 12.000 MWh gegenüber."
"Doch den Genossen liegen bereits neue Anträge von zukünftigen Wärmekunden vor. Mit diesen haben auch die letzten Skeptiker im Dorf realisiert, dass das genossenschaftliche Modell dezentraler Energieversorgung aus eigenen, nachwachsenden Rohstoffen ebenso zuverlässig wie wirtschaftlich attraktiv funktioniert. Bis heute bezahlt jeder angeschlossene Genosse für die kWh an Nawaro-Wärme 6,43 Cent, während der Ölpreis für die kWh Wärme 10,31 Cent kostet. Und wenn das Heizwerk ebenso wie das Fernwärmenetz in ein paar Jahren abbezahlt und die Öl- bzw. Gaspreise weiter gestiegen sind, wird sich diese Spanne weiter vergrößern."
Table 21.7: An assessment of observed and projected future changes in temperature and precipitation extremes over 26 sub-continental regions as defined in the SREX report (IPCC 2012; see also Figure 21.4 and Table SM21.2). Confidence levels are indicated by colour coding of the symbols. Likelihood terms are given only for high confidence statements and are specified in the text. Observed trends in temperature and precipitation extremes, including dryness, are generally calculated from 1950, using the period 1961-1990 as a baseline (see Box 3.1 chapter 3 of IPCC (2012a)). The future changes are derived from global and regional climate model projections of the climate of 2071-2100 compared with 1961-1990 or 2080-2100 compared with 1980-2000. Table entries are summaries of information in Tables 3.2 and 3.3 of IPCC (2012a) supplemented with or superseded by material from Chapters 2 (section 2.6 and Table 2.13) and 14 (section 14.4) of the IPCC AR5 WG1 report and Table 25-1 of the IPCC WG2 report.
The source(s) of information for each entry are indicated by the superscripts a (Table 3.2 of IPCC, 2012a), b (Table 3.3 of IPCC, 2012a), c (Chapter 2 (section 2.6 and Table 2.13) IPCC AR5 WG1 report), d (Chapter 14 (section 14.4) of the IPCC AR5 WG1 report) and e (Table 25-1 of the IPCC WG2 report).
Die Energiewende lebt auch vom Engagement vieler Bürger, die sich am Ausbau der erneuerbaren Energien beteiligen. Viele Bürger-Windparks oder Solargenossenschaften wollen aber nicht nur sauberen Strom produzieren, sondern ihn auch an ihre Mitglieder und Nachbarn verkaufen dürfen. Das Grünstrom-Markt-Modell macht möglich, dass der Strom nicht anonym von der Börse kommt - sondern von der Wind- oder Solaranlage ganz in der Nähe. Das macht Sinn, denn die Kundennachfrage bei Privathaushalten, Industrie und Gewerbe nach echtem Ökostrom aus regionalen Anlagen steigt. Eine direkte Belieferung steigert zudem die Akzeptanz für die Energiewende.
Keine Belastungen fürs EEG - und mit Europarecht vereinbar
Im Grünstrom-Markt-Modell wird das EEG-Umlagesystem nicht genutzt, deshalb müssen Verbraucher keine EEG-Umlage zahlen. Ihr Versorger zahlt stattdessen dem jeweiligen Anlagen-Betreiber die volle Vergütung. Insgesamt müssen die Zahlungen dem Durchschnitt der EEG-Vergütungen entsprechen. Das ist fair und kostenneutral fürs EEG-System, egal welche Anlagen unter Vertrag genommen werden. Die Vereinbarungen zwischen der Bundesregierung und Brüssel zur Einbindung ausländischer EE-Anlagen können auf das Grünstrom-Markt-Modell angewendet werden, weshalb es europarechtlich auf einer sicheren Basis steht.
Direkte und nachvollziehbare Lieferbeziehungen zwischen EEG-Anlagen und Endkunden
Im Grünstrom-Markt-Modell schließen Stromversorger Lieferverträge mit EEG-Anlagen. Sie setzen deren Stromproduktion unmittelbar zur Versorgung ihrer Kunden ein, wobei sie bestimmte Mindestmengen einhalten müssen. Dafür erhalten sie grüne Herkunftsnachweise und können den Strom als echten Ökostrom bezeichnen, der aus ganz konkreten Wind- oder Solarkraftwerken stammt.
Die fluktuierenden erneuerbaren Energien besser in den Markt integrieren
Wenn Stromversorger Strom aus konkreten Wind- und Photovoltaik-Anlagen beziehen, so müssen sie auch mit den wetterbedingten Schwankungen der Produktion umgehen. Der Stromversorger ist dafür verantwortlich, die schwankende Erzeugung dieser fluktuierenden erneuerbaren Energien mit dem ebenfalls schwankenden Verbrauch der Kunden in Einklang zu bringen - etwa durch Lastmanagement oder Speichertechnologien.
Gelingt ihm das nicht, kann der Versorger
überschüssigen EEG-Strom zwar am Spotmarkt weiterverkaufen, er muss dann aber eine Art "Strafgebühr" zahlen, nämlich 2 Cent pro Kilowattstunde.
alternativ die Überschussmengen aber auch ohne Zusatzzahlung an andere Versorger abgeben, die ebenfalls das Grünstrom-Markt-Modell nutzen.
In jedem Fall entsteht ein Wettbewerb um die kostengünstigste Einbindung der fluktuierenden Energien. Während die Marktprämie darauf abzielt, dass Wind- und Solarkraftwerke bei negativen Börsenpreisen abgeschaltet werden, schafft das Grünstrom-Markt-Modell einen Anreiz, die Stromnachfrage an das Dargebot erneuerbarer Energien anzupassen. So geht weniger sauberer Strom verloren. Das ist nicht nur ökologischer, sondern auch volkswirtschaftlich vernünftiger.
Umwelt und Verbraucher, Deutschlandfunk, 30.8.2011
Steinar Bysveen (Executive Vice President, Generation and Industrial Ownership, Statkraft): "Um Ihnen ein Beispiel zu geben. Wir haben große Speicher, da können wir den Wasserspiegel 125 m herauf- oder herunterpegeln. Und wenn wir jetzt ein neues Stromkabel nach Deutschland legen würden, würde sich der Pegel in diesem Speichersee um gerade einmal 1 cm verringern, d.h. wir würden es gar nicht merken, weil unsere Speicherbecken so groß sind.
[J. Gruber: wahrscheinlich meint er das geplante 1400 MW Stromkabel zwischen Deutschland und Norwegen.]
Steinar Bysveen: "Die Speicherkapazität bei uns machen etwa die Hälfte aller Speicher in ganz Europa aus. Wir können über 80 TWh speichern. Das entspricht etwa 15 % der gesamten Stromproduktion in Deutschland. Das System ist zudem viel flexibler als in Deutschland, weil es sich um Wasserkraftwerke handelt, die wir sehr leicht herauf- und herunterregulieren können, um die Nachfrage jederzeit abzudecken."
CO2-Bilanz des Neukaufs eines VW Golf IV TDI im Vergleich zum Weiterbetrieb vom VW Golf II Benziner
"Wir hatten bereits in der Vergangenheit angezeigt, die Umweltschutzorganisation Greenpeace e.V. sowie Herrn Oliver Worm in derselben Angelegenheit, dem Widerruf der Betriebsgenehmigung für das AKW Brokdorf, zu vertreten. Den entsprechenden Antrag vom 12.12.2001 fügen wir als Anlage noch einmal bei.
Erweiterung des Antrags:
Auch der vorbezeichnete Antragsteller schließt sich diesen Anträgen vom 12.12.2001 an und auch für diesen stellen wir somit
sämtliche Anträge, die bereits in dem Ursprungsantrag aus dem Jahre 2001 enthalten sind.
Zur Begründung des Antrags beziehen wir uns weiter auf die Ausführungen in dem Antragsschreiben vom 12.12.2001.
...
Nach Untersuchungen von Fachleuten (vgl. insbesondere Braun/ Steinhäusler/Zaitseva, Österreichische Militärische Zeitschrift. Sonderheft 2003 - "Nuclear Material Protection", S. 15-23.) steht fest, dass nukleare Einrichtungen durch den internationalen Terrorismus erheblichen Gefahren ausgesetzt sind. Als mögliche Mittel terroristisch motivierter Angriffe auf Kernkraftwerke werden in dieser viel beachteten Studie folgende Szenarien benannt:
Selbstmordanschlag mit einem voll betankten, großen Passagierflugzeug;
Selbstmordanschlag mit einer Serie von LKW-Bomben;
Selbstmordanschlag mit Hilfe mehrerer gecharterter und mit Sprengstoff beladener Business-Jets;
Anschlag mittels fern gezündeter Autobomben;
Anschlag durch Raketen mit eingebautem Sprengstoff;
Bombenanschlag auf ein außer Betrieb befindliches Kernkraftwerk;
Geiselnahme von Schlüsselkräften und anschließender Erpressung;
Diebstahl von unbenutztem Nuklearbrennstoff.
In dem Bericht, der ihrem Haus bereits bekannt ist und der in den genannten Gerichtserfahren in Ablichtung vorgelegt wurde, sind Vorgänge geschildert, die bereits in der Vergangenheit zur Gefährdung von zivilen Nuklearanlagen geführt haben.
Die Attentäter des 11. September hatten auch erwogen, ein Kernkraftwerk anzugreifen (Fielding/Fouda, Masterminds of Terror, 2003, Die Drahtzieher des 11. September berichten, S. 130).
Weitere Gefährdungsszenarien:
In dem Prozess um das Zwischenlager Brunsbüttel hat der dortige Kläger im Zusammenhang mit der Aufbewahrung von abgebrannten Kernbrennelementen noch weitere Szenarien ins Spiel gebracht, die nach Auffassung der Antragsteller sinngemäß auch in Bezug auf die Gefährdung von Kernkraftwerken heranzuziehen sind:
Angriff auf den "Behälter" mit panzerbrechenden Waffen. Dieses Szenario könnte, wie bereits ausgeführt wurde, zu massiven Freisetzungen führen, insbesondere bei Mehrfachtreffern. Das Szenario kann auch nicht in Bezug auf ein AKW ausgeschlossen werden. Ein sog. "Innentäter" kann einen entsprechenden Angriff auf Anlagenkomponenten ausführen und hierdurch einen Kernschmelzunfall herbeiführen. Der im Bau befindliche französische Reaktor Creys-Malville ist bereits im Jahr 1982 mit einer panzerbrechenden Waffe beschossen worden.
Angriff auf den "Behälter" durch eine gut organisierte, bewaffnete Gruppe, die nach Ausschaltung der Bewacher (z.B. mit einer Bombe) Sprengladungen an dem Behälter anbringt und auslöst. Die Annahme, dass Terroristen insoweit nicht über ausreichende Mengen von Sprengstoff verfügen, ist, wie das weltweite Anschlagsgeschehen eindeutig belegt, nicht mehr haltbar. Dieses Szenario könnte zu massiven Freisetzungen führen. Umweltaktivisten in der Schweiz ist es schon in der Vergangenheit gelungen, unbemerkt auf das Gelände eines Atomkraftwerks zu gelangen und dabei auch Punkte zu markieren, an denen
Zerstörungswirkungen mit potentiell katastrophalen Auswirkungen induziert werden könnten. Amerikanische Untersuchungen zeigen, dass die üblichen Maßnahmen des "Design Basis Threat" erheblich zu wünschen übrig lassen und dass die vorhandenen Sicherungen konzentrierten Angriffen von bewaffneten Gruppen nicht standhalten würden.
Angriff auf den "Behälter" durch eine gut organisierte, bewaffnete Gruppe, die nach Ausschaltung der Bewacher den Behälter mit einer Sauerstofflanze aufschlitzt. Ein solches Szenario ist auch in Bezug auf andere sensible Komponenten einer Nuklearanlage denkbar. Derartige Szenarien könnten ebenfalls zu massiven Freisetzungen führen.
Beschuss eines "Behälters" mit einer Maschinenkanone mit 30 mm urangehärteter Munition. Maschinenkanonen mit dieser Munition gehören nachweislich zum Arsenal von Terroristen. Die baulichen Strukturen eines Kernkraftwerks und der Reaktordruckbehälter wären ebenso wenig wie ein Behälter in der Lage, einem solchen Beschuss standzuhalten. Dieses Szenario könnte zu massiven Freisetzungen führen.
Diese Szenarien sind deshalb von besonderer Bedeutung, weil in dem Klageverfahren zum Zwischenlager Brunsbüttel die Prozessbevollmächtigten der dortigen Beklagten bestätigt haben, dass sämtliche dieser Szenarien Gegenstand von Betrachtungen der Genehmigungsbehörde waren und deshalb davon ausgegangen werden kann, dass sie als vorsorgebedürftig anerkannt sind, also vermutlich Gegenstand der Lastannahmen und des Tatmittelkataloges sind.
Das BKA berichtet ... über "angebliche Attentatsplanungen zum Nachteil von Kernkraftanlagen im Ausland", die sich allerdings, so das BKA, "nach den Behördenkenntnissen noch nicht in einem konkreten Stadium befunden haben". Insgesamt gelangt das Bundeskriminalamt erstmalig in seiner Einschätzung von 2007 zu dem Ergebnis, dass die "Wahrscheinlichkeit terroristischer Anschläge"
auf kerntechnische Einrichtungen aus dem Bereich des islamistischen Terrorismus "insgesamt zwar als gering anzusehen (ist)..., aber letztlich in Betracht gezogen werden (muss)".
Gefährdung durch herbeigeführten Flugzeugabsturz nicht gebannt:
Große Gefahren gehen, wie bereits in dem Ursprungsantrag verdeutlicht wurde, von einem herbeigeführten Flugzeugabsturz aus. Auch nach dem 11. September 2001 ist es immer wieder zu Flugzeugentführungen gekommen, trotz Verschärfung der staatlichen Maßnahmen auf diesem Gebiet.
Die Internationale Länderkommission (ILK) hat bereits im Jahr 2002 festgestellt, dass ein gezielter Anflug des Reaktorgebäudes möglich ist und dass bei einem Aufprall auf das Reaktorgebäude mit schweren bis katastrophalen Freisetzungen radioaktiver Stoffe zu rechnen ist. Weiterhin hat die ILK festgestellt, dass eine bauliche Ertüchtigung aus technischen und wirtschaftlichen Gründen nicht machbar bzw. nicht sinnvoll sei. Auch die Gesellschaft für Reaktorsicherheit (GRS) hat in einer weiteren Untersuchung von 2002 festgestellt, dass keines der in Deutschland betriebenen Kernkraftwerke explizit gegen den Absturz einer vollbetankten großen Passagiermaschine ausgelegt ist. In einer auf Brokdorf bezogenen Untersuchung von Dipl. Ing Dieter Majer wird detailliert aufgezeigt, dass ein Flugzeugabsturz zu einem Versagen des Containments und zum Versagen anderer vitaler Funktionen mit der Folge einer Kernschmelze führen kann.
Effektive Abhilfe ist bis heute nicht erfolgt. Das sog. "Vernebelungskonzept" ist in Brokdorf nicht umgesetzt worden. Es wäre nach Auffassung aller Experten auch ungeeignet und würde keine relevanten Schutzwirkungen entfalten. Ursprünglich in Erwägung gezogene baulich-technische Nachrüstungen (z.B. sog. Eibl-Hut) sind am Widerstand der Betreiber gescheitert. Im Zusammenhang mit dem zweiten Atomausstieg 2011 wurde das Risiko eines Flugzeugabsturzes erneut als "Achillesferse" der Kernkraftnutzung bezeichnet und die "marginale Kosmetik" nach dem 11. September 2001 kritisiert.
...
Herbeigeführter Flugzeugabsturz kein Restrisiko:
In den bisherigen Auseinandersetzungen hat auch die Frage eine wesentliche Rolle gespielt, ob der herbeigeführte Flugzeugabsturz dem Restrisikobereich zuzuordnen ist oder ob es sich insoweit um ein vorsorgebedürftiges Szenario handelt. Auch diese Frage ist nach dem inzwischen erreichten Stand der Rechtsprechung dahingehend zu beantworten, dass eindeutig ein vorsorgebedürftiges Szenario vorliegt.
... Sowohl die Szenarien als auch die festgelegten Sicherungsmaßnahmen werden regelmäßig überprüft und zwischen dem Bundesumweltministerium, den atomrechtlichen Aufsichts- und Genehmigungsbehörden, den Innenbehörden des Bundes und der Länder, dem Bundesamt für kerntechnische Entsorgungssicherheit (BfE, früher Bundesamt für Strahlenschutz), den Sicherheitsbehörden des Bundes sowie Sicherheitsexperten abgestimmt.
Eine Änderung oder Ergänzung der Sicherungsmaßnahmen, insbesondere der baulich-technischen Maßnahmen, kann erforderlich werden, wenn sich die Gefährdungsbewertung durch die Sicherheitsbehörden ändert oder wenn sich neue Erkenntnisse, insbesondere zu den Auswirkungen der unterstellten Szenarien, ergeben.
Zu bestimmten Angriffsszenarien im Nahbereich der Transport- und Lagerbehälter, die zu Schutzzielverletzungen führen können, hat sich die Bewertung und Erkenntnislage derart verändert, dass die Sicherungsmaßnahmen optimiert werden müssen. Dazu werden bauliche Maßnahmen und - bis zu deren Umsetzung - temporäre Maßnahmen durchgeführt.
Die Nachrüstung erfolgt jedoch nicht aufgrund einer veränderten Gefährdungslage für kerntechnische Einrichtungen in der Bundesrepublik Deutschland. ...
Unter Leitung des Bundesumweltministeriums haben sich die zuständigen atomrechtlichen Aufsichtsbehörden der Länder mit Zwischenlagern, das damalige Bundesamt für Strahlenschutz (heute BfE) als Genehmigungsbehörde sowie Vertreter der Innenbehörden der Länder mit den Betreibern auf ein gemeinsames generisches Sicherungskonzept zur Nachrüstung aller Zwischenlager verständigt. Die zuständigen Gremien haben die Anforderungen an die Nachrüstung gebilligt. Die übergeordneten Gremien wurden regelmäßig informiert. Die Betreiber stimmten hochrangig den erforderlichen Maßnahmen im Dezember 2010 zu.
Die Änderungsgenehmigungen für die erforderlichen Maßnahmen sind erteilt und werden umgesetzt. Einige Zwischenlager sind bereits vollständig nachgerüstet. Bestimmender Zeitfaktor für die Nachrüstung sind die zum Teil umfangreichen baulich-technischen Maßnahmen. Zur Einhaltung des erforderlichen Schutzniveaus bis zur Fertigstellung der Nachrüstmaßnahmen gelten temporäre Maßnahmen an den betreffenden Standorten.
... Einzelheiten zu den neuen Erkenntnissen, den Lastannahmen und den Sicherungsmaßnahmen unterliegen der Geheimhaltung und können öffentlich nicht genannt werden, um ihre Wirksamkeit nicht zu gefährden.
Mit der Novellierung des Atomgesetzes im April 2002 wurde die Verpflichtung der Betreiber von Kernkraftwerken festgelegt, an den Standorten der Kernkraftwerke für die Zwischenlagerung der aus dem Betrieb entstehenden bestrahlten Brennelemente Sorge zu tragen.
Die Pflicht zum Entsorgungsvorsorgenachweis gilt unverändert weiter, wobei der Nachweis durch die Lagerung in den Standort-Zwischenlagern erbracht wird. Außerdem wurde die Abgabe von abgebrannten Brennelementen an die Wiederaufarbeitungsanlagen in Frankreich und Großbritannien mit dem 30. Juni 2005 untersagt.
Die abgebrannten Brennelemente werden in speziellen Transport- und Lagerbehältern (zum Beispiel der Bauart CASTOR) trocken aufbewahrt. Mit den in Betrieb befindlichen dezentralen Zwischenlagern wird erreicht, dass weitere Transporte in der Bundesrepublik Deutschland, etwa von den Kernkraftwerken in zentrale Zwischenlager, nicht erforderlich sind.
... Die Standort-Zwischenlager sind für genau festgelegte Mengen an abgebrannten Brennelementen (definiert in Tonnen Schwermetall) sowie für eine genau festgelegte Anzahl an Behälterstellplätzen genehmigt.
...Die genehmigten Mengen an Schwermetall bzw. Stellplätzen richteten sich ursprünglich nach der im Jahr 2002 mit dem Atomausstieg festgelegten Laufzeiten von maximal 32 Jahren. Die 2011 nach dem Reaktorunfall in Fukushima Daiichi erfolgte vorzeitige Abschaltung von insgesamt acht Kernkraftwerken und die Reduzierung der Laufzeiten der weiteren Kernkraftwerke führt voraussichtlich dazu, dass die genehmigten Stellplatzkapazitäten nicht ausgeschöpft werden. ...
Die Standort-Zwischenlager wurden als Lagerhallen aus Stahlbeton (am Standort Neckarwestheim in Form von Lagertunneln) errichtet. Beim Bau der Lagerhallen kamen drei verschiedene Konzepte zum Einsatz: das STEAG-, das WTI- und das Tunnel-Konzept.
... Im Rahmen der Forschungsplattform ENTRIA wurden Zwischenlagerkonzepte in anderen Ländern untersucht und auch eine Langzeitzwischenlagerung hoch radioaktiver Abfälle betrachtet. Sowohl das Bauwerk,
das Lagerkonzept als auch die Lagerbehälter können sicherheitstechnisch besser ausgelegt werden, als
dies derzeit in Deutschland der Fall ist.
Unsere Forderungen sind:
a)
Ein möglichst hohes Sicherheitsniveau bei der Lagerung radioaktiver Abfälle darf nicht mit der Behauptung verhindert werden, die zeitliche Lücke zwischen Ende der Genehmigungen und Einlagerung der Behälter in ein tiefengeologisches Lager wäre so gering, dass sie mit der bestehenden
Infrastruktur leicht überbrückt werden könnte.
b)
Keine Errichtung eines großen zentralen "Eingangslagers" über ein Pufferlager hinaus, insbesondere
nicht frühzeitig an einem noch nicht endgültig genehmigten Standort eines tiefengeologischen
Lagers, wie es das Nationale Entsorgungsprogramm vorsieht.
c)
Die Bundesregierung muss zeitnah ein tragfähiges Konzept für eine möglichst sichere, längerfristige
Zwischenlagerung der hoch radioaktiven Abfälle vorlegen. Ein einziges zentrales Zwischenlager lehnen wir ab.
d)
Bei einem solchen Konzept müssen die internationalen Erfahrungen und die Ergebnisse der
ENTRIA-Forschungen berücksichtigt werden. Weitere Forschung muss finanziert werden. Herausforderungen für die längerfristige Zwischenlagerung weit über die bisher betrachteten Zeiträume hinaus sind zudem u.a. der Erhalt von Know-How, die Sicherung der Dokumentation, die Verfügbarkeit
von Ersatzteilen usw.
e)
Bei einem solchen Konzept muss ebenfalls berücksichtigt werden, dass Atomtransporte mit hoch radioaktivem Atommüll nicht zuletzt angesichts der Terrorgefahren ein großes Sicherheitsrisiko darstellen.
f)
Alle Sicherheitsnachweise in Neugenehmigungen sollten sich auf eine Größenordnung von 100 Jahre beziehen.
g)
Teil dieses Konzeptes muss auch das weitere Vorgehen bezüglich eines Neubaus des Zwischenlagers Nord in Lubmin sein. Es macht keinen Sinn, hier nur für wenige Jahre einen Neubau nach
alten Standards zu genehmigen.
2.
Sicherheitsdefizite bei den existierenden Zwischenlagern
Basis für das Sicherheitskonzept der oberirdischen Trockenlagerung in Deutschland ist die Sicherheit der
Transport- und Lagerbehälter. Sie sollen einen ausreichenden Schutz vor Störfällen und gegen alle Einwirkungen von außen gewährleisten.
Die Lagerhallen der zentralen Zwischenlager in Ahaus, Gorleben, Lubmin, des Behälterlagers Jülich und die süddeutschen Zwischenlager nach dem WTI-Konzept (WTI = Wissenschaftlich-technische Ingenieurberatung) sollen lediglich einen Zugriff von außen erschweren. Eine weitere
Barrierewirkung, z.B. einen Schutz gegen einen Flugzeugabsturz bieten sie nicht.
Die Wände der Zwischenlager nach WTI-Konzept sind ca. 85 cm dick, die Decken ca. 55 cm.
Die Wände der zentralen Zwischenlager
in Ahaus und Gorleben haben sogar nur eine Stärke von 50 cm im unteren und 20 cm im oberen Bereich,
ihre Decken betragen 20 cm.
Bei den norddeutschen Zwischenlagern nach dem STEAG-Konzept soll durch
dickere Seitenwände von 1,20 m und einer Deckenstärke von 1,30 m auch das Lagergebäude eine gewisse
Schutzwirkung entfalten.
Zum Vergleich: Im niederländischen Zwischenlagerkonzept sind Wanddicken von
1,70 m umgesetzt.
Seit März 2011 sind die Zwischenlagerbetreiber aufgrund eines Erlasses des BMU aufgefordert, sogenannte
"Härtungsmaßnahmen" gegen "Störmaßnahmen und sonstige Einwirkungen Dritter (SEWD)" zu ergreifen.
Die Nachrüstungen wurden im Einvernehmen mit den Betreibern festgelegt und umfassen dementsprechend
nur solche, die diese für zumutbar halten. Im Wesentlichen bestehen sie aus der Erschwerung des Zugangs
von außen, aus Kerosin-Ablaufrinnen sowie der Errichtung einer zusätzlichen 10 m hohen Mauer. Im Detail
sind sie jedoch geheim. Nach sieben Jahren liegen erst für die Hälfte der Standort-Zwischenlager und für
das zentrale Zwischenlager Ahaus die entsprechenden Genehmigungen vor. Beim Zwischenlager Nord in
Lubmin (ZLN) sind die Maßnahmen nicht durchführbar, deshalb soll die Halle für hoch radioaktive Abfälle
neu gebaut werden.
Stephan Dörner, Wall Street Journal, 17. August 2014 (im Cache)
"Die von NSA-Whistleblower Edward Snowden aufgedeckte umfassende Überwachung des Internets hat vor allem in Deutschland und der Schweiz IT-Sicherheit und Datenschutz von Konsumentenprodukten zu einem heißen Start-up-Thema werden lassen. Einige deutsche Unternehmen haben die internationale Aufmerksamkeit um Datenschutz und Überwachung auch genutzt, ihr Produkt zu internationalisieren." ...
"Den Standort Deutschland haben sich der gebürtige Brite Franklin und sein deutscher Mitgründer Felix Müller-Irion bewusst für ihren E-Mail-Dienst Lavaboom ausgesucht. "Die Datenschutz-Gesetze in Deutschland unterstützen uns stark dabei, unseren Nutzern Privatsphäre zu bieten", sagt der Gründer. Lavaboom sei ein "Zero- Knowledge"-E-Mail-Provider - verschlüssele also die Daten beim Nutzer, ohne sie selbst zu kennen. Jedes Kind soll in die Lage versetzt werden, mit Lavaboom E-Mails zu versenden, die auch nicht von der NSA mitgelesen werden können. ... Lavaboom ist nach seinen Gründern ein "Zero- Knowledge"-E-Mail-Provider - verschlüssele also die Daten beim Nutzer, ohne sie selbst zu kennen. Jedes Kind soll in die Lage versetzt werden, mit Lavaboom E-Mails zu versenden, die auch nicht von der NSA mitgelesen werden können." (Quelle: Wall Street Journal)
ProtonMail is a free web-based encrypted email service founded in 2013 at the CERN research facility by Jason Stockman, Andy Yen, and Wei Sun. ProtonMail is designed as a zero knowledge system, using client-side encryption to protect emails and user data before they are sent to ProtonMail servers, in contrast to other common webmail services such as Gmail and Hotmail. ProtonMail servers are located in Switzerland, outside of US and EU jurisdiction. The service received initial funding through a crowdfunding campaign, and will be sustained long-term by multi-tiered pricing, although the default account setup is free. ProtonMail has approximately 250,000 users as of August, 2014. (Source: Wikipedia)
"Der Hamburger Server-Hersteller Protonet hatte im Juni dieses Jahres auf diese Weise in rekordverdächtigen 10 Stunden und 8 Minuten 1,5 Millionen Euro eingesammelt. Das Hamburger Start-up bietet Server "Made in Germany", mit denen sich kleine Unternehmen und Privatleute mit wenigen Handgriffen eine private Cloud-Lösung samt hoher Verschlüsselung einrichten können. Das Unternehmen verspricht "100%ige Datenhoheit" und plant bald den Schritt in die USA. Wegen der großen Nachfrage hat Protonet die Crowdfunding-Runde auf 3 Millionen Euro verdoppelt; das neue Fundinglimit wurde in insgesamt 133 Stunden erreicht." (Quelle: Wall Street Journal)
DIW ZUR ENERGIEWENDE: Warum Gabriels Kohle-Abgabe Sinn macht
"Der Stromangebotsüberschuss würde sinken, der Strompreis an der Börse wieder steigen und die Wirtschaftlichkeit der Kraftwerke verbessern." Zudem würde sich aus Kemferts Sicht die Klimabilanz verbessern. Kohlekraftwerke seien aufgrund ihrer Inflexibilität "eher ungeeignet" für eine Kombination mit erneuerbaren Energien, Gaskraftwerke dagegen deutlich besser geeignet. "Durch einen höheren Strombörsenpreis und einen höheren CO2-Preis würde sich die Wirtschaftlichkeit der flexiblen Kraftwerke verbessern. Zudem würde die EEG-Umlage sinken."
World Nuclear Industry Status Report 2013, 2015 (pdf)
The report's lead authors are industry analysts Mycle Schneider, based in Paris, and London-based Antony Froggatt. Both have advised European government bodies on energy and nuclear policy.
Almost half of all added electricity generating capacity in 2014 was from renewables, excluding large hydro-dams, the report said.
In output terms, China, Japan and India, which are three of the world's four largest economies, along with Brazil, Germany, Mexico, the Netherlands and Spain now generate more electricity from non-hydro renewables than nuclear, it said.
In Britain, output from renewables, including hydro, surpassed atomic generation "for the first time in decades", while in the United States the share of renewables was 13 percent, up from 8.5 percent in 2007.
Discounting Japan's moribund industry due to its long-term outage, the report said the world's operating units numbered 391 in 2014, up three from a year earlier, and 47 less than a 2002 peak.
(OAKLAND, CA, USA) — AUGUST 13, 2015 —In less than eight months, humanity has used up nature’s budget for the entire year, with carbon sequestration making up more than half of the demand on nature, according to data from Global Footprint Network, an international sustainability think tank with offices in North America, Europe and Asia.
Global Footprint Network tracks humanity’s demand on the planet (Ecological Footprint) against nature’s ability to provide for this demand (biocapacity). Earth Overshoot Day marks the date when humanity’s annual demand on nature exceeds what Earth can regenerate in that year. Earth Overshoot Day has moved from early October in 2000 to August 13th this year.
The costs of this ecological overspending are becoming more evident by the day, in the form of deforestation, drought, fresh-water scarcity, soil erosion, biodiversity loss and the buildup of carbon dioxide in the atmosphere. The latter will significantly amplify the former, if current climate models are correct. Consequently, government decision-makers who factor these growing constraints in their policy making will stand a significantly better chance to set their nation’s long-term economic performance on a favorable track.
“Humanity’s carbon footprint alone more than doubled since the early 1970s, when the world went into ecological overshoot. It remains the fastest growing component of the widening gap between the Ecological Footprint and the planet’s biocapacity,” said Mathis Wackernagel, president of Global Footprint Network and the co-creator of the Ecological Footprint resource accounting metric. “The global agreement to phase out fossil fuels that is being discussed around the world ahead of the Climate Summit in Paris would significantly help curb the Ecological Footprint’s consistent growth and eventually shrink the Footprint.”
The carbon footprint is inextricably linked to the other components of the Ecological Footprint — cropland, grazing land, forests and productive land built over with buildings and roads. All these demands compete for space. As more is being demanded for food and timber products, fewer productive areas are available to absorb carbon from fossil fuel. This means carbon emissions accumulate in the atmosphere rather than being fully absorbed.
A Second Chance
The climate agreement expected at the United Nations Conference of Parties (COP) 21 this December will focus on maintaining global warming within the 2-degrees-Celsius range over pre-Industrial Revolution levels. This shared goal will require nations to implement policies to completely phase out fossil fuels by 2070, per the recommendations of the Intergovernmental Panel on Climate Change (IPCC), directly impacting the Ecological Footprints of nations.
Assuming global carbon emissions are reduced by at least 30 percent below today’s levels by 2030, in keeping with the IPCC’s suggested scenario, Earth Overshoot Day could be moved back on the calendar to September 16, 2030 (assuming the rest of the Footprint would continue to expand at the current rate), according to Global Footprint Network.
This is not impossible. In fact, Denmark has cut its emissions over the last two decades at this rate: Since the 1990s, it reduced its carbon emissions by 33 percent. Had the world done the same (while not changing the rest of the Footprint), Earth Overshoot Day would be on October 3 this year.
This is not to say that Denmark has already reached a sustainable Ecological Footprint. Humanity would require the resources of 2.85 planets if everyone lived like the Danes, which would move Earth Overshoot Day to May 8.
Business As Usual
By contrast, business as usual would mean using the resources equivalent to two planets by 2030, with Earth Overshoot Day moving up on the calendar to the end of June.
This projection assumes that biocapacity, population growth and consumption trends remain on their current trajectories. However, it is not clear whether a sustained level of overuse is possible without significantly damaging long-term biocapacity, with consequent impacts on consumption and population growth.
Tipping Point
“We are encouraged by the recent developments on the front line of renewable energy, which have been accelerating worldwide, and by the increasing awareness of the finance industry that a low-carbon economy is the way of the future,” said Wackernagel. “Going forward, we cannot stress enough the vital importance of reducing the carbon footprint, as nations are slated to commit to in Paris. It is not just good for the world, but increasingly becoming an economic necessity for each nation. We all know that the climate depends on it, but that is not the full story: Sustainability requires that everyone live well, within the means of one planet. This can only be achieved by keeping our Ecological Footprint within our planet’s resource budget.”
About Global Footprint Network:
Global Footprint Network is an international think tank working to drive informed, sustainable policy decisions in a world of limited resources. Together with its partners, Global Footprint Network coordinates research, develops methodological standards, and provides decision-makers with a menu of tools to help the human economy operate within Earth’s ecological limits.
Biocapacity per person (Biological capacity available per person) varies each year with ecosystem management, agricultural practices (such as fertilizer use and irrigation), ecosystem degradation, and weather, and population size. Biological capacity available per person (or per capita): There were ~ 12 billion hectares of biologically productive land and water on this planet in 2011. Dividing by the number of people alive in that year (7 billion) gives 1.72 global hectares per person. This assumes that no land is set aside for other species that consume the same biological material as humans.
Footprint per person varies with consumption amounts and production efficiency.
Where a dotted line is shown, interpolation estimates have been used in place of highly unlikely outliers in the results.
While most input data for the Footprint accounts come from UN statistical sources, the quality of country results varies.
The quality of the assessment is scored on a 1-6 scale, and is provided for Germany in the upper-right corner of the graph.
How much land area does it take to support your lifestyle? Take this quiz to find out your Ecological Footprint, discover your biggest areas of resource consumption, and learn what you can do to tread more lightly on the earth.
Die Kurzstudie findet nach dem Studium der öffentlich verfügbaren Quellen - der Bundesnetzagentur, der Übertragungsnetzbetreiber (ÜNB), des Bundeswirtschaftsministeriums sowie wissenschaftlicher und technischer Beratungsinstitute - keine entscheidenden technischen Argumente dafür, dass die Atomkraftwerke heute für die Strombereitstellung notwendig sind.
Zwar besitzt Süddeutschland schon heute - also mit AKW - nicht ausreichend Erzeugungskapazitäten, um die eigene Spitzenlast zu decken. Aber die Übertragungskapazitäten im Höchstspannungsnetz für Strom aus Norddeutschland reichen heute mit oder ohne AKW bereits aus, dieses Defizit rechnerisch abzudecken.
Die möglicherweise auftretenden Probleme mit Blindleistungsbereitstellung und anderen Systemdienstleistungen können einerseits mit technischen Maßnahmen adressiert werden und werden andererseits auch erleichtert, wenn man akzeptiert, dass auch Stromimport nach Süddeutschland aus anderen, näher liegenden Ländern geschehen wird, denn Strom folgt nicht den administrativen Grenzen, sondern den Netzengpässen.
Allerdings macht die aktuelle Marktverfassung des europäischen Binnenmarktes deutlich höhere Stromflüsse und Reservekapazitäten1 zum Redispatch notwendig, die den Blick auf die technische Lage verstellen.
Für eine Abschaltung aller AKW in Deutschland wäre vermutlich eine Änderung der Marktordnung, insbesondere eine Marktteilung, sinnvoll bzw. notwendig.
Auch andere Maßnahmen können die Versorgungssicherheit im Falle einer schnellen AKW-Abschaltung unterstützen, greifen aber tendenziell eher über Zeiträume von mehreren Jahren.
II. Auszüge
II.1 Leistungsbilanz
Die Übertragungsnetzbetreiber erstellen die Leistungsbilanz jährlich seit 2012. Jede Leistungsbilanz seitdem wies deutliche Leistungsbilanzüberschüsse auf, also Kraftwerke, die auch bei der höchsten Last nicht für die Versorgungssicherheit benötigt werden. Für 2015 beträgt der Überschuss nach der aktuellsten Berechnung aus dem Herbst 2014 12,2 GW.
Das heißt, auch falls die Spitzenlast, wie für den Worst Case erwartet, eintritt und ohne einen nennenswerten Beitrag der erneuerbaren Energien (EE), steht rein rechnerisch 12,2 GW einsatzbereite und regelbare Kraftwerkskapazitgät bereit, wird aber für die nationale Versorgung im Szenario nicht genutzt.
Da die atomaren Kapazitäten (inklusive Grafenrheinfeld) 12,1 GW betragen, bedeutet dies, dass rein rechnerisch und auf nationaler Ebene betrachtet - ohne Berücksichtigung von Fragen der Netzstabilität - sofort auf alle atomaren Kapazitäten verzichtet werden könnte und die Leistungsbilanz dennoch weiterhin positiv ausfiele. ... Unter den Annahmen der Leistungsbilanz wäre damit die Stromerzeugung selbst bei einem extrem unwahrscheinlichen Worst-Case-Szenario zu jedem Zeitpunkt gesichert.
Ist die installierte Kapazität höher als die Last nach Abzug verfügbarer abschaltbarer Lasten, gilt die
Versorgung als gesichert. Die Leistungsbilanz trifft dabei möglichst pessimistische, also für die
Netzsicherheit kritische Annahmen, indem sie eine kritische Verbrauchssituation mit einer
konservativen Schätzung für die Kraftwerksverfügbarkeit in den Mittelpunkt der Betrachtung stellt.
Die Betrachtungsweise der Leistungsbilanz basiert auf einer Vielzahl von Annahmen und einer
Betrachtung eines fiktiven Extremfalls, bei dem die Leitungen nach außen gekappt sind. Die
Unsicherheiten und Abschläge auf Seiten der Lasten und der Erzeugung werden im Weiteren einzeln
diskutiert.
II.1.1 Annahmen zu Lasten und Erzeugungskapazitäten
Zwar ist die Höchstlast klar definiert als der maximale zeitgleiche Verbrauch aller Stromverbraucher in
Deutschland.
Die Messtechnik ist in Deutschland aber in zumindest einem wesentlichen
Verbraucherbereich (Haushalte) nicht so weit entwickelt, dass man den Verbrauch zu diesem Zeitpunkt
tatsächlich messen könnte: Viele Verbraucher verfügen nur über Zähler, die die gesamte dem Netz
entnommene elektrische Arbeit messen. Daher wird in der Leistungsbilanz der
Übertragungsnetzbetreiber auf die Stromerzeugung als Näherung für den Stromverbrauch
zurückgegriffen, was nach Bilanzierung mit Im- und Export eine Schätzung für den Verbrauch ergibt.
Auch für die Erzeugung handelt es sich um eine Näherung, denn die Erzeugung vieler
dezentraler Anlagen (bspw. Blockheizkraftwerke (BHKWs) und Photovoltaik-Anlagen) wird nicht in
viertelstündlicher Auflösung erfasst.
Die vier Übertragungsnetzbetreiber erfassen lediglich zwischen
97 % bis 99 % der Erzeugung.
Daher ist
die eigentliche Jahreshöchstlast nicht bekannt. Als Behelf wird der im Rückblick geschätzte Wert der
"Jahreshöchstlast" des jeweiligen Jahres dann mit der historischen Höchstlast seit der erstmaligen
Veröffentlichung des Leistungsbilanzberichtes verglichen. Im Vorausblick auf die Zukunft stehen diese
beiden Werte als Orientierungspunkt nebeneinander.
Auf der Seite der Kapazitäten wird bei der Erstellung der Leistungsbilanz von den ÜNB mit großzügigen
Abschlägen gerechnet. Diese beruhen auf konservativen Annahmen zur Verfügbarkeit von Kraftwerken.
Für konventionelle Kraftwerke werden von der installierten Leistung Revisionen und Ausfälle
abgezogen. Ausfälle durch technische Probleme werden auf Basis statistischer Daten einbezogen, dabei
wird zwischen geplanten, ungeplanten, zeitlich verschiebbaren und nicht verschiebbaren Ausfällen
unterschieden.
Die gesicherte Leistung für Erneuerbare resultiert aus dem Kriterium, dass eine Einspeisung zu
mindestens 99 % der Zeit erfolgen muss.
Dafür werden von den ÜNB historische Jahresdauerkurven als
Datengrundlage genutzt und auf die installierte Leistung der einzelnen Regelzonen bezogen. Auf dieser
Basis beziehen die ÜNB nur 1 % der installierten Kapazität von Wind und 0 % der PV auf der
Erzeugungsseite der Leistungsbilanz ein.
Mit der gleichen Logik werden nur 65 % der
Biomassekapazitäten in die Bilanz einbezogen.
Auch bei Laufwasserkraftwerken sind nur 25 % der
Kapazität mehr als 99 % der Zeit dabei, Strom zu produzieren.
Andere AutorInnen kommen für die
Verfügbarkeiten durchaus auf andere Schätzungen, so geht bspw. die dena (2010) bei der gesicherten
Leistung von Kraftwerken auf der Basis regenerativer Energiequellen und Pumpspeicher von
88 % fürBiomasse,
90 % für Pumpspeicher,
40 % für Laufwasserkraftwerke und
5-10 % für Windenergie aus.
Das
Aufsummieren der Ausfallraten der einzelnen Technologien unterstellt also ein Extremszenario, in dem
alle EE-Technologien gleichzeitig nicht verfügbar sind, in dem also Dunkelheit für PV, eine Flaute bei der
Windenergie, leere Biogasanlagen und niedrige Wasserstände gleichzeitig auftreten.
II.2 Alternativen zur Leistungsbilanz: Loss of Load Expectation (LOLE) und Expected Energy not Served (EENS)
Die Kritik am [im wesentlichen übermäßig pessimistischen Worst-Case-Szenario-] Konzept der Leistungsbilanz wird in der Fachwelt ... aus [vielerlei] Gründen ständig lauter.
Insbesondere aufgrund ihrer statischen Natur wird zunehmend anerkannt, dass die Leistungsbilanz nicht als Konzept für die Bewertung der Versorgungssicherheit unter den heutigen technischen und marktlichen Bedingungen geeignet ist. Das heutige Stromsystem ist dafür zu dynamisch und flexibel und mit ganz Europa vernetzt.
Deshalb werden zunehmend neue Indikatoren für die Messung der Versorgungssicherheit genutzt z.B. die Nutzung der Indikatoren
Loss of Load Expectation (LOLE) und
Expected Energy Not Served (EENS),
um den probabilistischen Charakter von Versorgungssicherheit umfassend zu reflektieren.
In den Berechnungen von Consentec & r2b für Deutschland in 2025, also in einer Situation ohne AKW und mit hoher Durchdringung von erneuerbaren Energien, deutet sich ein gleichbleibend hohes Versorgungsniveau an. Auch andere Szenarioberechnungen weisen auf ein gleichbleibend hohes Versorgungsniveau nach dem Atomausstieg, trotz negativer Leistungsbilanz, hin:
Die Szenarien der europäischen Netzbetreiber ergeben für Deutschland sowohl für den Winter 2015/2016 als auch für 2020/21 einen LOLE-Wert von 0.
Da sich für Deutschland in den Berechnungen eine LOLE von 0 ergibt, liegt die EENS ebenfalls bei 0 GWh; alle Stromnachfrage kann bedient werden.
II.2.1 Einzelheiten
Das Pentalaterale Forum nutzt zur Prognostizierung der Versorgungssicherheit die Lastüberhangswahrscheinlichkeit bzw. Loss of Load Expectation. LOLE basiert auf einem probabilistischen Ansatz und gibt die Stunden pro Jahr an, in denen die Last die Erzeugungskapazitäten übersteigt. Dabei handelt sich lediglich um ein statistisch konstruiertes Szenariojahr. Der Nachteil des LOLE-Indikators ist, dass er zwar die Häufigkeit und Länge des Ausfalls (in Stunden) angibt, nicht aber die Schwere des Ausfalls, also wie viel Leistung vom Ausfall betroffen ist.
Der Indikator Energy not Served (ENS) bzw. die Verbrauchsüberhangswahrscheinlichkeit drückt die Schwere des Stromausfalls aus, gemessen am Stromverbrauch in GWh, der in einem Jahr möglicherweise aufgrund von Kapazitätsengpässen nicht gedeckt werden könnte. Um die Vergleichbarkeit zwischen Ländern herzustellen, kann der Indikator als Anteil des Jahresverbrauchs (in GWh) wiedergegeben werden.
II.3 Auswirkung eines Atomausstiegs 2015 auf den Strompreis
Als ... Nebeneffekt würde das sofortige Abschalten der Atomkraftwerke zu einer Erhöhung der derzeit extrem niedrigen Börsenstrompreise führen und damit das Ausscheiden von fossilen Kapazitäten wie etwa Gaskraftwerken aus wirtschaftlichen Gründen verzögern.
Die Szenarien von Energy Brainpool (2015) zum Teilausstieg aus der Kohleerzeugung errechnen für den Abgang von 15 GW eine marktpreissteigernde Wirkung am Großhandelsmarkt von 0.9 Ct/kWh in 2015. Diese würde sich durch die damit einhergehende Reduktion der EEG-Umlage in einer Strompreissteigerung für Privatkunden von ca. 0,6 Ct/kWh auswirken (in 2015 lagen Strompreise für private Neukunden bei etwa 23 Ct/kWh).
Da der Abgang atomarer Kapazitäten mit 12 GW etwas niedriger liegt, dürfte auch der Preiseffekt etwas niedriger liegen.
II.4 Begrifsserklärung
Unter Redispatch sind Eingriffe in die Erzeugungsleistung von Kraftwerken zu verstehen, um Leitungsabschnitte vor einer Überlastung zu schützen. Droht an einer bestimmten Stelle im Netz ein Engpass, so werden Kraftwerke diesseits des Engpasses angewiesen, ihre Einspeisung zu drosseln, während Anlagen jenseits des Engpasses ihre Einspeiseleistung erhöhen müssen. Auf diese Weise wird ein Lastfluss erzeugt, der dem Engpass entgegenwirkt.
Possible changes in Atlantic meridional overturning circulation (AMOC) provide a key source of uncertainty regarding future climate change. Maps of temperature trends over the twentieth century show a conspicuous region of cooling in the northern Atlantic. Here we present multiple lines of evidence suggesting that this cooling may be due to a reduction in the AMOC over the twentieth century and particularly after 1970. Since 1990 the AMOC seems to have partly recovered. This time evolution is consistently suggested by an AMOC index based on sea surface temperatures, by the hemispheric temperature difference, by coral-based proxies and by oceanic measurements. We discuss a possible contribution of the melting of the Greenland Ice Sheet to the slowdown. Using a multi-proxy temperature reconstruction for the AMOC index suggests that the AMOC weakness after 1975 is an unprecedented event in the past millennium (p > 0.99). Further melting of Greenland in the coming decades could contribute to further weakening of the AMOC.
Wissenschaftlicher Beirat der Bundesregierung "Globale Umweltveränderungen" (WGBU) Factsheet Nr. 3 / 2011: Globale Megatrends
Die Menschheit ist zu einem dominanten Faktor im Erdsystem geworden - Forscher sprechen deshalb von einem neuen Erdzeitalter, dem Anthropozän (der "Menschenzeit"). Dabei gelangen wir zunehmend an planetarische Grenzen und gefährden unsere Lebensgrundlagen u.a. durch den fortschreitenden Klimawandel und die Zerstörung biologischer Vielfalt.
Intergovernmental Panel on Climate Change (IPCC)
Climate Change 2007
Contribution of Working Group I to the Fourth Assessment Report of the Intergovernmental Panel on Climate Change
The Physical Science Basis
2.1 Kalt- und Warmzeiten
2.1.1 Milankovitch-Theorie
2.1.2 Rückkopplungsprozesse
Die Unterschiede in der Sonneneinstrahlung durch die Schwankungen der Erdbahnparameter sind jedoch viel zu schwach, um das ganze Ausmaß der Temperaturunterschiede zwischen Kalt- und Warmzeiten zu erklären. Tatsächlich lässt sich aus ihnen nur ein Temperaturunterschied von höchstens 0,5 C ableiten, während der tatsächliche Unterschied typischerweise bei 5 C lag. Es muss also Prozesse im Klimasystem selbst gegeben haben, die durch positive Rückkopplungen den solaren Antrieb wesentlich verstärkt haben. Diese werden heute in zwei Faktoren gesehen:
in der Albedo, vor allem der Eis-Albedo,
in den Treibhausgasen der Atmosphäre, vor allem dem Kohlendioxid.
Der Entwurf hat das Ziel, den Ausbau öffentlicher WLAN-Netze in den Städten vorantreiben. Soweit Neusprech. In Wirklichkeit geht es um eine radikale Verschärfung der Haftung für WLAN-Betreiber. Personen, die anderen über ihr WLAN Zugang zum Internet gewähren, sollen nämlich nur dann nicht als Störer für Rechtsverletzungen Dritter verantwortlich sein, wenn sie "zumutbare Maßnahmen" zur Verhinderung solcher Verstöße ergriffen haben. Dazu müssen die Anbieter ihren Anschluss verschlüsseln und dürfen den Zugang nur solchen Nutzerinnen und Nutzern ermöglichen, die zuvor eingewilligt haben, keine Rechtsverletzungen zu begehen. Rein private, nicht geschäftsmäßige WLAN-Anbieter - wie z.B. die Freifunker - sollen nach dem Entwurf nur dann in den Genuss der Haftungsfreistellung kommen, wenn sie darüber hinaus auch die Namen der Nutzerinnen und Nutzer kennen. Wieso private Netzbetreiber gegenüber gewerblichen Providern so schlecht gestellt werden, versteht keiner.
... Die einzige Frage, die bleibt, ist also: Wer schreibt eigentlich solch einen Unsinn? Und wieso geht so etwas ins Kabinett? Und wer stoppt diesen Zug? Langsam wird man müde und verbittert, wenn man sich die Qualität der Gesetzgebung in Deutschland ansieht.
Caroline Baylon (Research Associate, Science, Technology, and Cyber Security, International Security Department), David Livingstone MBE DSC
(Associate Fellow, International Security), AUTHOR: Roger Brunt (Nuclear Security Consultant)
Please note that Caroline Baylon is lead author on this publication.
05 October 2015
The report finds that the trend to digitization, when combined with a lack of executive-level awareness of the risks involved, means that nuclear plant personnel may not realize the full extent of their cyber vulnerability and are thus inadequately prepared to deal with potential attacks.
Specific findings include:
The conventional belief that all nuclear facilities are 'air gapped' (isolated from the public internet) is a myth. The commercial benefits of internet connectivity mean that a number of nuclear facilities now have VPN connections installed, which facility operators are sometimes unaware of.
Search engines can readily identify critical infrastructure components with such connections.
Even where facilities are air gapped, this safeguard can be breached with nothing more than a flash drive.
Supply chain vulnerabilities mean that equipment used at a nuclear facility risks compromise at any stage.
A lack of training, combined with communication breakdowns between engineers and security personnel, means that nuclear plant personnel often lack an understanding of key cyber security procedures.
Reactive rather than proactive approaches to cyber security contribute to the possibility that a nuclear facility might not know of a cyber attack until it is already substantially under way.
In the light of these risks, the report outlines a blend of policy and technical measures that will be required to counter the threats and meet the challenges.
Recommendations include:
Developing guidelines to measure cyber security risk in the nuclear industry, including an integrated risk assessment that takes both security and safety measures into account.
Engaging in robust dialogue with engineers and contractors to raise awareness of the cyber security risk, including the dangers of setting up unauthorized internet connections.
Implementing rules, where not already in place, to promote good IT hygiene in nuclear facilities (for example to forbid the use of personal devices) and enforcing rules where they do exist.
Improving disclosure by encouraging anonymous information sharing and the establishment of industrial CERTs (Computer Emergency Response Team).
Encouraging universal adoption of regulatory standards.
Dank branchen- und länderübergreifender Kooperationen gelingt es, Kreisläufe vollständig zu schließen und somit Sekundärrohstoffe effektiv wieder der Produktion zuzuführen. Hier greift das Geschäftsmodell der ALBA Group.
Gemeinsam mit dem Institut Fraunhofer UMSICHT stellen wir in der aktuellen Studie "resources SAVED by recycling" die Ressourcenschonung durch unsere Recyclingaktivitäten im Vergleich zur Primärproduktion genau auf den Prüfstand. Durch die Kreislaufführung von rund 6 Millionen Tonnen Wertstoffen erzielten wir im Jahr 2014 eine Gesamtersparnis von über 48,3 Millionen Tonnen Primärressourcen.
Jakob Runge, Vladimir Petoukhov, Jonathan F. Donges, Jaroslav Hlinka, Nikola Jajcay, Martin Vejmelka, David Hartman, Norbert Marwan, Milan Palus & Jürgen Kurths
Identifying regions important for spreading and mediating perturbations is crucial to assess the susceptibilities of spatio-temporal complex systems such as the Earth's climate to volcanic eruptions, extreme events or geoengineering. Here a data-driven approach is introduced based on a dimension reduction, causal reconstruction, and novel network measures based on causal effect theory that go beyond standard complex network tools by distinguishing direct from indirect pathways. Applied to a data set of atmospheric dynamics, the method identifies several strongly uplifting regions acting as major gateways of perturbations spreading in the atmosphere. Additionally, the method provides a stricter statistical approach to pathways of atmospheric teleconnections, yielding insights into the Pacific-Indian Ocean interaction relevant for monsoonal dynamics. Also for neuroscience or power grids, the novel causal interaction perspective provides a complementary approach to simulations or experiments for understanding the functioning of complex spatio-temporal systems with potential applications in increasing their resilience to shocks or extreme events.
(a) Climatological variables such as sea-level pressure or surface temperature are typically provided as time series at locations on a regular grid.
(b) In the first step of our approach, a Varimax-dimension reduction yields a small set of regional components (here denoted by X, Y, …) representing climatological subprocesses with corresponding time series.
(c) In the second step of our approach, this smaller set of variables allows for a reconstruction of the causal network (black links, labels denote time lags). An important pitfall in non-causal networks (as constructed from pairwise association measures such as cross-correlation) is that links can be spurious due to a common driving by another process or due to transitivity effects leading to indirect paths (grey dashed arrows in c). Perturbations cannot propagate along common-driver links (for example, between X and Z1) affecting network measures like the degree. Further, indirect paths such as from X to Y affect shortest path lengths in non-causal networks.
(d) In the third step of our approach, the aim is to directly quantify the causal effect between pairs of components based on the causal network (Tigramite approach) and detect through which components and how much the causal effect is mediated. In the linear framework studied here this can be achieved by causal effect measures based on suitable link weights, where the weight of a link, for example XW1, indicates the causal effect of a 1 s.d. perturbation in X on W1 (see Fig. 3b for a formula relating link weights to causal effects). Binary causal networks do not properly account for different link strengths which affects classical network measures (grey highlights in d). This analysis can be used to test specific hypotheses, but also to construct aggregate node measures
(e) to identify components with high cumulative causal effect either as sources (causal gateways) or as intermediate nodes on causal pathways (causal mediators).
Perspektiven für die Klimaforschung 2015 bis 2025: Positionspapier
Auf Einladung des Deutschen Klima-Konsortiums haben sich 2013 und 2014 Wissenschaftlerinnen und Wissenschaftler aus allen führenden deutschen Klimaforschungsinstituten mit Expertinnen und Experten aus Politik und Gesellschaft zu einer Reihe von Workshops getroffen, um sich über die zukünftigen Perspektiven der Klimaforschung zu verständigen.
Das vorliegende Positionspapier beschreibt die drei Themenfelder, die in den Arbeitsgruppen bearbeitet wurden.
Die weitere Erforschung des Klimasystems bildet das erste Themenfeld, denn trotz enormer Fortschritte gibt es immer noch erhebliche Wissenslücken.
Das zweite Themenfeld betrifft den Umgang mit Klimarisiken. Diese Risiken, die durch die Folgen des Klimawandels entstehen, müssen genauer identifiziert, besser charakterisiert und -womöglich- in Bezug auf Wahrscheinlichkeit und Schadensausmaß quantifiziert werden.
Das dritte Themenfeld umfasst die unterschiedlichen Rollen der Klimaforschung in einer demokratischen Gesellschaft und ihre Möglichkeiten, sich an den zentralen Fragen einer gesellschaftlichen Transformation zu beteiligen.
Dem DKK und den beteiligten Wissenschaftlern und Experten ging es darum, innerhalb der genannten Themenfelder die wissenschaftlich zukunftsträchtigen und gesellschaftlich relevanten Fragen zu identifizieren. Mit dem vorliegenden Papier möchte das DKK den sich abzeichnenden Strukturwandel in der Klimaforschung mitgestalten und zu einer Reflexion innerhalb der Wissenschafts-Community, aber auch darüber hinaus, anregen.
European Center for Constitutional and Human Rights (ECCHR), Stand 7.11.2015
Der TÜV Rheinland ist bei dem Business Social Compliance Initiative (BSCI) Audit nicht mit der erforderlichen Sorgfalt vorgegangen. Anders ist es nicht zu erklären, dass offensichtliche Gebäudemängel nicht erkannt wurden und in dem Audit Report nicht aufgeführt sind. ...
Das European Center for Constitutional and Human Rights (ECCHR), FEMNET und die Kampagne für Saubere Kleidung, medico international und das Activist Anthropologist Collective aus Bangladesch haben heute gemeinsam Beschwerde bei der BSCI eingelegt. Die Organisationen fordern von der BSCI, den Gutachtenauftrag sowie die Berichte von TÜV Rheinland und anderen zu Rana Plaza offen zu legen und den Rahmen für die Prüfungsberichte grundlegend zu ändern (Quelle).
Wir verwenden eine zeitlich aufgelöste Simulation, innerhalb derer zu jeder Stunde des Jahres alle Energiebedarfe sicher befriedigt werden. Zusammenfassung der wichtigsten Ergebnisse der Untersuchung.
Primärenergieverbrauch,
CO2-Emissionen und
kumulative Kosten
Den größten Anteil an den Treibhausgasemissionen haben energiebedingte CO2-Emissionen; diese machen heute rund 85 % der deutschen Treibhausgasemissionen aus.
Es wurden unterschiedliche Transformationspfade auf Basis unterschiedlicher untersuchter Szenarien verglichen. Die Szenarien unterscheiden sich dabei hinsichtlich der in der Zukunft verwendeten Antriebskonzepte im Bereich der Mobilität, hinsichtlich des Umfangs der energetischen Sanierung von Gebäuden und hinsichtlich des Zeitpunkts, zu dem ein Ausstieg aus der Nutzung von Kohle zur Stromerzeugung erfolgt. Außerdem werden unterschiedliche Zielwerte der Minderung energiebedingter CO2-Emissionen - eine Minderung um
80 %, 85 % und 90 % bezogen auf den Referenzwert im Jahr 1990 - betrachtet.
Bei allen untersuchten Szenarien spielen fluktuierende erneuerbare Energien zur Stromerzeugung - also Windenergieanlagen und Photovoltaikanlagen - eine Schlüsselrolle der zukünftigen Energieversorgung. Diese Aussage gilt auch dann, wenn ein massiver Ausbau der Möglichkeit für Stromimport und Stromexport erfolgt. Allerdings liegen die notwendigen installierten Leistungen für die unterschiedlichen Szenarien weit auseinander in einem Bereich von summarisch
290 GW (für ein Szenario mit 80-prozentiger Reduktion der energiebedingten CO2-Emissionen) und
knapp 540 GW (das untersuchte Szenario mit einer Minderung energiebedingter CO2-Emissionen um 90 %).
Die notwendige Anpassung von Energieverbrauch and Energieerzeugung gelingt nur, wenn über die klassischen Anwendungen, in denen heute dominant Strom verwendet wird, hinaus neue Stromanwendungen insbesondere im Bereich der Gebäude und des Verkehrs hinzukommen. Zugleich impliziert die zunehmende Nutzung von Strom in diesen Bereichen, dass Verbrennungstechniken (Heizkessel, Verbrennungsmotoren) durch elektrische Maschinen (elektrische Wärmepumpen, Elektromotoren) ersetzt werden, die die Endenergie Strom effizienter in Nutzenergie (Wärme, Traktion) wandeln.
Bei allen untersuchten Szenarien nehmen die Erzeugung und der Verbrauch von Strom gegenüber heute, aufgrund der höheren Nachfrage in allen Sektoren, zu. Die Zunahme beträgt je nach Szenario zwischen 20 % und 40 %, und das obwohl im Bereich der klassischen Stromanwendungen wie Beleuchtung, mechanische Antriebe usw. eine Verbrauchsreduktion durch Effizienzsteigerungen um 25 % angenommen wurde.
Die CO2-Reduktionsziele sind nicht erreichbar ohne die großflächige Installation von Anlagen zur Herstellung synthetischer Energieträger aus erneuerbarem Strom, also Anlagen zur Herstellung von Wasserstoff, Methan oder flüssigen Brenn-/Kraftstoffen aus Wind- und Sonnenstrom. Auch hier schwankt die benötigte summarische installierte Leistung derartiger Anlagen stark in Abhängigkeit des betrachteten Szenarios zwischen Werten von summarisch weniger als 80 GW (Szenario mit sehr hohem Ausbaugrad an Elektromobilität) bis 180 GW (Szenario mit einer Minderung energiebedingter CO2-Emissionen um 90 %).
Die Wärmeversorgung zeichnet sich durch eine starke Elektrifizierung aus und elektrische Wärmepumpen werden in nahezu allen untersuchten Szenarien zur wichtigsten Technik zur Wärmebereitstellung in Einzelgebäuden. In allen untersuchten Szenarien mit Ausnahme des Szenarios mit einer Minderung energiebedingter CO2-Emissionen um 90 % wird das Gros des Gebäudebestands auf heutigen Neubaustandard, nicht jedoch auf einen Passivhausstandard saniert.
Alle Szenarien mit einem beschleunigten Ausstieg führen dazu, dass die Klimaschutzziele kostengünstiger erreicht werden als bei ansonsten gleichen Szenarien mit einem nicht beschleunigten Ausstieg aus der Kohleverstromung. Werden auch in 2050 noch Kohlekraftwerke betrieben, so ist eine Absenkung energiebedingter CO2-Emissionen um mehr als 80 % nur sehr schwer erreichbar.
Zwischen Transformationspfaden mit einem Zielwert der Absenkung energiebedingter CO2-Emissionen um 80 % und solchen mit einem Zielwert von 90 % ist ein Kipppunkt zu beobachten.
Die im 90-%-Szenario nur noch sehr geringe verfügbare Menge an fossilen Energieträgern bedingt, dass eine sehr große Menge an Anlagen zur Erzeugung von Strom aus Sonne und Wind und eine große Menge an Speichern und Anlagen zur Erzeugung synthetischer Energieträger benötigt wird.
Zugleich erfordert dieser Zielwert eine wesentlich weitergehende Sanierung des Gebäudebestands und führt dazu, dass im Bereich der Wärmeversorgung von Einzelgebäuden, die nicht über Fernwärme versorgt werden, nahezu ausschließlich elektrische Wärmepumpen eingesetzt werden.
Zeiten, in denen nur unzureichend erneuerbare Energien zur Stromversorgung zur Verfügung stehen - also Zeiten mit positiver Residuallast - erfordern, dass ausreichend Kraftwerke zur komplementären Stromerzeugung zur Verfügung stehen. Diese werden mit einem Mix aus fossilen, biogenen und synthetisch hergestellten Energieträgern betrieben. Sie setzen sich - je nach Szenario in unterschiedlichem Verhältnis - aus Gas- und Dampfkombikraftwerken, Heizkraftwerken und Blockheizkraftwerken sowie Gasturbinenkraftwerken zusammen.
Kosten
Für den Fall langfristig bis 2050 gleichbleibender Preise für fossile Energieträger und langfristig niedriger Kosten für die Emission von CO2 (also z. B. niedriger Handelspreise für CO2-Zertifikate) liegen die kumulativen Gesamtkosten der kostengünstigsten der untersuchten Klimaschutzszenarien für den Betrachtungszeitraum 2015 bis 2050 um rund 1100 Mrd. Euro (oder rund 25 %) höher als im Falle eines Weiterbetriebs des heutigen Energiesystems in unverändertem Zustand. Dieser Wert entspricht bei Umrechnung auf ein Jahr rund 0,8 % des heutigen Bruttoinlandsprodukts.
Die Kostensituation ändert sich in Abhängigkeit der Preisentwicklung für fossile Energieträger und der Kosten, die auf CO2-Emissionen erhoben werden. Liegt z. B. die Erhöhung der Preise für fossile Energieträger bei jährlich 3 %, so sind die kumulativen Gesamtkosten für eine Transformation des Energiesystems mit einem Minderungswert energiebedingter CO2-Emissionen von 85 % im Jahr 2050 praktisch gleich wie die Kosten für einen Weiterbetrieb des heutigen Systems. Ein ähnliche Wirkung hätte - bei als konstant angenommenen Preisen für fossile Energieträger - eine konstante Kostenbelastung von CO2-Emissionen mit 100 Euro pro Tonne.
Nach erfolgter und abgeschlossener Transformation sind die jährlichen Gesamtkosten eines Energiesystems mit signifikant (um 80 % bis 85 %) abgesenkten CO2-Emissionen nicht höher als die vergleichbaren jährlichen Gesamtkosten unseres heutigen Energiesystems, die bei summarisch rund 250 Mrd. Euro für alle Endkunden liegen. Diese Aussage gilt bei heutigen Preisen für fossile Energieträger und heutige Kosten für CO2-Emissionen im Zertifikatehandel.
Alle hier gemachten Aussagen zu Kosten basieren ausschließlich auf den reinen Systemkosten, also allen Kosten, die durch Investitionen, deren Finanzierung, den Betrieb und die Wartung von Anlagen und den Kauf von fossilen und biogenen Energieträgern entstehen, d. h. es sind keine externen Kosten einbezogen worden.
Aus volkswirtschaftlicher Perspektive bedeutet die Transformation des Energiesystems eine signifikante Verschiebung von Geldflüssen, die heute für Energieimporte verwendet werden [siehe auch KOHLEATLAS, Daten und Fakten über einen globalen Brennstoff, 1. Auflage, Heinrich-Böll-Stiftung und Bund für Umwelt und Naturschutz Deutschland, 2015 (im Cache)], zu Investitionen für Anlagen und Ausgaben für deren Betrieb, Erhalt und Wartung. Insofern bedingt ein transformiertes Energiesystem einen hohen Anteil zusätzlicher lokaler Wertschöpfung, der ebenfalls in den oben gemachten Aussagen zu Kosten keine Berücksichtigung findet.
Using multiple datasets (including data from close to a million watersheds), and more than 40,000 groundwater models, the study estimates a total volume of nearly
Der jüngste Synthesebericht des IPCC wird mit dem Aufgreifen des Treibhausgas-Budgets konkret. Er benennt die Menge an Treibhausgasen, bei der die Erwärmung mit hoher Wahrscheinlichkeit auf unter 2 Grad begrenzt werden kann. Um dies zu erreichen dürfen insgesamt nicht mehr als 2900 GtCO2eq in die Atmosphäre gelangen. Im Zeitraum 1870 bis 2011 wurden davon bereits rum 1900 GtCO2eq "verbraucht", sodass aktuell höchstens noch 1000 GtCO2eq in die Atmosphäre gelangen dürfen (siehe auch hier). In den letzten Jahren lagen die globalen Emissionen bei ca. 50 GtCO2eq pro Jahr.
Anmerkung:
Für jedes Land wird ein länderspezifisches Emissionsbudget abgeleitet, das im Gesamtzeitraum von sechs Jahrzehnten zur Verfügung steht. Zieht man von diesem Budget jeweils die bereits zwischen 1990 und 2009 erfolgten Emissionen ab, ergibt sich die Restmenge, die den Staaten bis 2050 tatsächlich noch zur Verfügung steht.
Beispielsweise
bekämen die
USA,
Deutschland und
Russland
in dieser Option negative Emissionsbudgets bis 2050 (Abb. 5.3-1, WGBU - Sondergutachten Budgetansatz, 2009), wären also bereits heute "kohlenstoffinsolvent".
Japan hätte die CO2-Emissionsrechte, die ihm für den gesamten Zeitraum 1990-2050 zustünden, schon heute nahezu aufgebraucht.
Das würde diese Staaten dazu zwingen, in erheblichem Maße Emissionsrechte von Ländern zu erwerben, die vermutlich auch künftig ihre zugewiesenen Budgets nicht voll ausschöpfen werden.
provided by the German Federal Institute for Risk Assessment (BfR), runs counter to the finding (in cache) earlier this year by the International Agency for Research on Cancer (IARC), the highly respected cancer arm of the World Health Organization, that glyphosate is a probable human carcinogen [page 78 of the report]. This IARC classification is based on a comprehensive assessment of the peer-reviewed toxicologic and epidemiologic literature undertaken over a 12-month period by a Working Group of 17 independent expert scientists. The IARC review linked glyphosate
to dose-related increases in malignant tumors at multiple anatomical sites in experimental animals and
to an increased incidence of non-Hodgkin lymphoma in exposed humans.
... It [i.e. this finding of IARC] is part of a long tradition of deeply researched and highly credible reports on the carcinogenicity of hundreds of chemicals issued over the past four decades by IARC and used today by international agencies and regulatory bodies around the world as a basis for risk assessment, regulation and public health policy. ... [IARC] Monographs are written by an ad hoc Working Group (WG) of international scientific experts over a period of about 12 months ending in an eight-day meeting. The WG evaluates all of the publically-available scientific literature on a given substance and, through a transparent and rigorous process (in cache).
In contrast, the BfR decision is not credible because it is not supported by the evidence and it was not reached in an open and transparent manner.
Bulletin of the Atomic Scientists, 23 November 2015 (in cache)
In this interview, Klein tells the Bulletin's Dan Drollette about her latest non-fiction book, This Changes Everything: Capitalism vs the Climate, published by Simon & Schuster in 2014. The book takes no prisoners, pointing at weak government efforts to address climate change; environmental groups that have compromised with industry on too many issues; what she considers to be pie-in-the-sky "techno-fixes" such as carbon sequestering; conservatives who consistently deny climate change is even happening; and corporations that Klein thinks are seeking to earn a profit by scuttling efforts to deal with the crisis.
Her solution is to rebuild society along more equitable and local lines: raising food locally; making big investments in renewable energy; and ending government subsidies for the fossil fuel industry. She offers the dramatic expansion of renewable energy use in Germany and the Scandinavian countries as examples of government and citizens coming together to forge change and calls for a broad-based citizen's movement to do the same in North America-harkening back as far as the Abolitionist movement for an example of such change. She also talks about the recent upheaval in national politics in her native Canada and how it may affect the upcoming climate change talks in Paris.
net zero emissions between 2050 and 2100: "Parties aim to reach global peaking of greenhouse gas emissions as soon as possible, recognizing that peaking will take longer for developing country Parties, and to undertake rapid reductions thereafter in accordance with best available science, so as to achieve a balance between anthropogenic emissions by sources and removals by sinks of greenhouse gases in the second half of this century." (Source: 350.org)
"... the pledge of at least $100 109 per year in aid for poorer countries didn't mean much as only $10 109 had actually been raised." (Source)
Es ist ein breites Bündnis, was sich da zusammengeschlossen hat, um der Bundesregierung zu erzählen, [was] zu tun ist, um die verschärften Klimaziele zu erreichen, die sich die Welt in Paris gesetzt hat: 40 Organisationen, von der Aktionsgemeinschaft Artenschutz bis zum WWF. Deutschland habe in Paris gut verhandelt, lobte Klaus Milke von der Umweltorganisation Germanwatch. Auch habe die Bundesregierung Umweltverbände offen einbezogen in Beratungen über das Klimaschutzprogramm, das sie im Sommer vorstellen will.
... statt weniger habe Deutschland im vergangenen Jahr wieder mehr Klimagase in die Atmosphäre geblasen. Erneuerbare Energien müssten daher stärker ausgebaut und gefördert werden, so Antje von Broock [vom Bund für Umwelt und Naturschutz Deutschland].
Die Bundesregierung wolle das Erneuerbare Energien Gesetz, kurz EEG, jedoch falsch umbauen:
Größere Sonnen- und Windkraftwerke sollen nicht mehr einfach so gefördert werden, sondern müssen erst eine Ausschreibung gewinnen.
Außerdem soll der Ausbau von Sonnen- und Windenergie gedeckelt werden:
"Deswegen sehen wir die EEG-Reform, die jetzt zum Beschluss ansteht, mit großer Sorge. Es könnte sein, dass die Beteiligung der Bürgerinnen und Bürger gestoppt wird.
Andererseits sind die Ziele, die hier für den Ausbau vorgesehen sind, zu gering. Sie sind nicht im Einklang mit den Klimaschutzzielen. Wir brauchen da andere Mindestausbaumengen."
Published on Feb 5, 2015
Speaker: Professor Jeffrey D. Sachs
Chair: Jonathan Leape
Recorded on 4 February 2015 in Sheikh Zayed Theatre, New Academic Building.
In this public lecture Professor Sachs will talk about his upcoming book, The Age of Sustainable Development, which explains the central concept for our age, which is both a way of understanding the world and a method for solving global problems - sustainable development. Sustainable development tries to make sense of the interactions of three complex systems: the world economy, the global society, and the Earth's physical environment. It recommends a holistic framework, in which society aims for environmentally sustainable and socially inclusive development, underpinned by good governance. It is a way to understand the world, yet is also a normative or ethical view of the world: a way to define the objectives of a well-functioning society, one that delivers wellbeing for its citizens today and in future generations. This book describes key challenges and solutions pathways for every part of the world to be involved in problem solving, brainstorming, and determining new and creative ways to ensure inclusive and sustainable growth.
Jeffrey D. Sachs (@jeffdsachs) is a world-renowned professor of economics, leader in sustainable development, senior UN advisor, best selling author, and syndicated columnist whose monthly newspaper columns appear in more than 100 countries. He has twice been named among Time Magazine's 100 most influential world leaders. He was called by the New York Times, "probably the most important economist in the world," and by Time Magazine "the world's best known economist." A recent survey by The Economist Magazine ranked Professor Sachs as among the world's three most influential living economists of the past decade.
Professor Sachs serves as the Director of The Earth Institute, Quetelet Professor of Sustainable Development, and Professor of Health Policy and Management at Columbia University. He is Special Advisor to United Nations Secretary-General Ban Ki-moon on the Millennium Development Goals, having held the same position under former UN Secretary-General Kofi Annan. He is Director of the UN Sustainable Development Solutions Network. He is co-founder and Chief Strategist of Millennium Promise Alliance, and is director of the Millennium Villages Project. Sachs is also one of the Secretary-General's MDG Advocates, and a Commissioner of the ITU/UNESCO Broadband Commission for Development. He has authored three New York Times best sellers in the past seven years: The End of Poverty (2005), Common Wealth: Economics for a Crowded Planet (2008), and The Price of Civilization (2011). His most recent book is To Move the World: JFK's Quest for Peace (2013). His upcoming book The Age of Sustainable Development will be published by Columbia University Press on March 10, 2015.
Jonathan Leape is the Executive Director of the International Growth Centre (IGC) at LSE.
The International Growth Centre (@The_IGC) aims to promote sustainable growth in developing countries by providing demand-led policy advice based on frontier research. Based at LSE and in partnership with Oxford University, the IGC is initiated and funded by DFID.
The Energy Payback Time for Silicon PV modules is about one year for locations in Southern Europe; thus the net clean electricity production of a solar module is 95 %.
The Energy Payback Time of PV systems is dependent on the geographical location: PV systems in Northern Europe need around 2.5 years to balance the inherent energy, while PV systems in the South equal their energy input after 1.5 years and less.
The Energy Payback Time for Concentrator PV-Systems in Southern Europe is less than 1 year.
In dem Forschungsprojekt HUCO (Human Cooperation to Protect the Global Commons) von Prof. Dr. Astrid Dannenberg (Fachgebiet Umwelt- und Verhaltensökonomik, Uni Kassel) soll herausgearbeitet werden, unter welchen Bedingungen kooperatives Verhalten in globalem Maßstab erfolgreich ist und wann nicht. Das Projekt schließt theoretische Untersuchungen, umfangreiche Erhebungen und Experimente ebenso ein wie Simulationen von internationaler Interaktion. Beteiligt sind neben der Uni Kassel die Columbia University in New York, die Princeton University in New Jersey sowie das Stockholm Resilience Centre. Das Projekt ist im August 2015 gestartet.
Für HUCO erhält Dannenberg in den kommenden fünf Jahren 1,5 Mio. Euro vom European Research Council (ERC). Die Mittel kommen aus dem sogenannten "Starting Grant"-Programm; mit dieser Linie unterstützt die EU vielversprechenden wissenschaftlichen Nachwuchs. Sie ist Teil des EU-Förderprogramms HORIZON 2020. Dannenberg, Leiterin des Fachgebiets Umwelt- und Verhaltensökonomik an der Universität Kassel, finanziert mit dem Grant ein Team mit insgesamt vier Wissenschaftlerinnen und Wissenschaftlern.
Dr. Astrid Dannenberg (37) hat seit 2014 an der Universität Kassel eine Professur für Umwelt- und Verhaltensökonomik inne. Zuvor war sie u.a. beim Zentrum für Europäische Wirtschaftsforschung in Mannheim und an der Columbia University tätig. Ihre Professur und das Projekt HUCO fügen sich in das Forschungsprofil der Universität ein, die einen ihrer Schwerpunkte auf Forschung zu Nachhaltigkeit und Umwelt setzt.
Der European Research Council (oder Europäischer Forschungsrat) ist eine Agentur der Europäischen Kommission und dient der Finanzierung von Grundlagenforschung
Im deutschen Stromsystem wurden im Jahr 2015 laut Agora Energiewende mehrere Rekorde gebrochen. So lieferten erneuerbare Energien mehr Strom als jemals ein anderer Energieträger in Deutschland: Jede dritte Kilowattstunde (32,5 Prozent), die hierzulande verbraucht wurde, stammte aus Wind-, Solar, Wasser und Bioenergiekraftwerken (2014: 27,3 Prozent). Am 23. August deckten laut Agora erneuerbare Energien in der Spitze sogar 83,2 Prozent des deutschen Stromverbrauchs. Mit insgesamt 47 Terawattstunden sei 2015 zudem mehr Strom erzeugt worden als jemals zuvor in der Geschichte Deutschlands. Mehr
EE: Ausbau stockt
2015 fiel der Zuwachs der Onshore-Windenergie in Deutschland deutlich schwächer aus als im Vorjahr. Das berichtet das Magazin erneuerbare energien.
Wurden 2014 an Land noch Anlagen mit einer Gesamtleistung von 4750 Megawatt (MW) errichtet,
dürfte dieser Wert 2015 nach vorläufigen Berechnungen um rund 1 Gigawatt gesunken sein.
Der Zubau im Bereich von Biomasse- und Photovoltaikanlagen sei 2015 derweil auch deutlich zu niedrig ausgefallen: Der politisch gewünschte Wert für die zusätzliche Photovoltaikleistung von 2500 MW sei klar verfehlt worden. Es wird damit gerechnet, dass etwa 1400 MW installiert wurden.
Nach Angaben der Bundesnetzagentur betrug der Zubau von Biomasseanlagen zur Stromerzeugung im Zeitraum November 2014 bis Ende Oktober 2015 ganze 67 MW. Damit dürfte auch für das Gesamtjahr 2015 das angestrebte Ausbauziel von 100 MW unterschritten worden sein.
Der Geschäftsführer des Bundesverbands Erneuerbare Energie, Hermann Falk, wies erst kürzlich auf den Zusammenhang mit den zuletzt erfolgten Novellierungen des Erneuerbare-Energien-Gesetzes (EEG) hin.
"2012 wurde die Photovoltaik,
2014 die Bioenergie ausgebremst", so Falk.
Mit der EEG-Novelle 2016 drohe nun auch dem Ausbau der Windenergie ein drastischer Rückgang. "Der Vorschlag des Bundeswirtschaftsministeriums macht aus dem Gesetz für den Ausbau erneuerbarer Energien ein Gesetz, das den Ausbau de facto begrenzt."
Die Bundesregierung hat für die jeweiligen Technologien Ausbau-Korridore definiert.
Für die Windenergie etwa liegt dieser momentan bei um die 2500 MW jährlich - das Repowering alter Anlagen durch neue nicht eingerechnet. Im Jahr 2014 wurde dieser Wert mit 4750 MW deutlich überschritten. Im Bemessungszeitraum der Netzagentur von November 2014 bis Oktober 2015 lag der Zubau bei 3712 MW. Durch das neuerliche Übertreffen des Ausbaukorridors sinkt die Vergütungshöhe für Strom aus Windenergieanlagen an Land zum 1. April 2016 um 1,2 Prozent.
Die Pläne der Bundesregierung für das EEG 2016 gehen aber noch weiter: Demnach soll der Windkraft-Ausbau nach der geplanten Umstellung auf Ausschreibungen nur noch bei mindestens 2000 MW liegen - Repowering inklusive.
Die Arbeitsgruppe der Krebsforschungsagentur (International Agency for Research on Cancer, IARC) der Weltgesundheitsorganisation (WHO) hat Glyphosat als "wahrscheinlich krebserregend beim Menschen" eingestuft (s. auch BfR-Link)
Damit wurde Glyphosat in die zweithöchste Risikostufe eingeordnet, zu der u. a. auch Acrylamid, Blei und Nitrosamine gehören.
Die IARC-Arbeitsgruppe hat am 20. März 2015 einen zusammenfassenden Kurzbericht zur Neueinstufung von Glyphosat und anderen Pestiziden in der wissenschaftlichen Fachzeitschrift "The Lancet Oncology" veröffentlicht; die ausführliche Monographie (im Cache) liegt noch nicht vor.
Ende des Jahres 2015 steht auf Ebene der Europäischen Union (EU) die Entscheidung über einer Zulassungserneuerung für den Herbizidwirkstoff Glyphosat an; Deutschland ist hierbei berichterstattender Mitgliedstaat.
Die neue Risikoeinschätzung durch das IARC befindet sich im Widerspruch zur Risikoeinschätzung des Bundesinstituts für Risikobewertung (BfR), das die IARC-Einstufung bzw. Anhaltspunkte für ein kanzerogenes Potenzial von Glyphosat auf Basis der vorliegenden Veröffentlichung für nicht nachvollziehbar hält.
Das BfR hat im Rahmen des Wiederzulassungsverfahrens für Glyphosat auf EU-Ebene Anfang April 2015 seinen Bewertungsbericht zu Glyphosat an die EU-Risikobewertungsbehörde EFSA (Europäische Behörde für Lebensmittelsicherheit) weitergeleitet, ohne die Publizierung der ausführlichen Monographie zur IARC-Einstufung abzuwarten und deren fundierte Prüfung und Einarbeitung in den Bewertungsbericht vorzunehmen.
Antwort
Die IARC stuft Stoffe nach ihrem grundsätzlichen Gefährdungspotential ein und bewertet nicht das mit dessen Nutzung möglicherweise verbundene tatsächlich vorliegende Risiko. Die Agentur stellt diesen Unterschied in der Präambel ihrer Entscheidungen deutlich heraus [Link?]. Insofern ist die Feststellung des IARC als Formulierung des Bedarfs zur Abklärung der grundsätzlichen Eigenschaften zu verstehen.
[Hinzufügung, J. Gruber: Aussage des IARC - Quelle: Preamble to the IARC Monographs, A General Principles and Procedures - 2. Objective and scope]
"A cancer 'hazard' is an agent that is capable of causing cancer under some circumstances, while a cancer 'risk' is an estimate of the carcinogenic effects expected from exposure to a cancer hazard. The Monographs are an exercise in evaluating cancer hazards, despite the historical presence of the word 'risks' in the title. The distinction between hazard and risk is important, and the Monographs identify cancer hazards even when risks are very low at current exposure levels, because new uses or unforeseen exposures could engender risks that are significantly higher."
Für die WHO ist das Joint Meeting on Pesticide Residues (JMPR), das die WHO gemeinsam mit der Ernährungs- und Landwirtschaftsorganisation der Vereinten Nationen (FAO) betreibt, hingegen für die Risikobewertung von Pflanzenschutzmittelwirkstoffen auf internationaler Ebene zuständig. Das JMPR legt u. a. auch die Rückstandshöchstgehalte für z. B. Pflanzenschutzmittel international fest. Dieses Gremium beurteilt Glyphosat bislang als "nicht krebserregend für Menschen" [Referenz?]. Aktuell bemüht sich die WHO darum, die unterschiedlichen Einstufungen desselben Stoffes durch zwei ihrer Institutionen zu klären [Referenz?].
[Anmerkung, J. Gruber: Vermutlich bezieht sich diese Aussage auf die Seiten 98 - 103 des vom JMPR als veraltet bezeichenten JMPR Report 178 aus dem Jahr 2004 (im Cache): Long-term intake - Estimated theoretical maximum daily intakes for the five Global Environment Monitoring System - Food Contamination Monitoring and Assessment Programme [GEMS/Food] regional diets, based on recommended maximum residue limits [MRLs], were 1% of the ADI (Acceptable Daily Intake, Annex 3). The Meeting concluded that the long-term intake of residues of glyphosate resulting from uses that have been considered by the JMPR is unlikely to present a public health concern.
[Hinzufügung, J. Gruber: Aussagen und Reports des JMPR -
Joint FAO/WHO Meeting on Pesticide Residues (JMPR) (in cache)
"JMPR is an international expert scientific group administered jointly by the Food and Agriculture Organization of the United Nations (FAO) and WHO. JMPR meets regularly since 1963 to
review residues and analytical aspects of the pesticides,
estimate the maximum residue levels,
review toxicological data and
estimate acceptable daily intakes (ADIs) for humans of the pesticides under consideration."
The task force found that the databases for IARC and JMPR monographs for glyphosate, malathion and diazinon were significantly different and that many studies, mainly from the published peer reviewed scientific literature, that had not been evaluated by JMPR were available to the IARC Monographs working group.
The task force noted that IARC Monographs working group considered studies of active substance, commercial formulations and primary metabolites and that such information is useful to the overall evaluation.
The task force noted that the future re-evaluation of glyphosate, malathion and diazinon by JMPR may need to extend beyond their residues in food resulting from their use as crop protection products.
Recommendations of the task force
The task force recommends full re-evaluation of glyphosate, malathion and diazinon by Joint FAO/WHO Meeting on Pesticide Residues (JMPR).
The task force recommends that JMPR reviews internal guidelines to consolidate the criteria for data inclusion/exclusion with respect to published and/or proprietary data sources."
Empfehlungen des JMPR mit Bewertung von Glyphosat (24 September 2015): Pesticide residues in food 2015, Joint FAO/WHO Meeting on Pesticide Residues, ISSN 0259-2517, FAO PLANT PRODUCTION AND PROTECTION PAPER 223, REPORT 2015 - (in cache - excerpt in cache)]
Glyphosate was not included in compounds tested for by the Food and Drug Adminstration's (FDA) Pesticide Residue Monitoring Program (PRMP), nor in the United States Department of Agriculture's Pesticide Data Program (PDP).
US electronic Code of Federal Regulations, Title 40: Protection of Environment, PART 180 - TOLERANCES AND EXEMPTIONS FOR PESTICIDE CHEMICAL RESIDUES IN FOOD, Subpart C - Specific Tolerances, §180.364 Glyphosate; tolerances for residues (Maximum Residue Limits, MRLs - in cache).
The US Department of Agriculture does not test food for glyphosate residues because the herbicide is considered 'safe'. The UK government includes glyphosate testing of selected foods in their reports, and levels are shown to be within the permitted ranges. Maximum glyphosate residue levels (MRLs) are set to accomodate actual levels, and are generally much higher in the USA than in Europe. Foods with the higherst permitted levels include GMOcrops, animal foods, cereal grains, oil seeds and dried pulses. Non-GMO grain crops receive doses of glyphosate immediately prior to harvesting in order to desiccate the crop.
With different MPLs set for individual groups of foods, it appears to be much less about safety, and much more about the levels being set to accommodate and reflect what actually is. There has been much criticism of this. When a breach of the MRLs is threatened, the remedy appears to be to simply increase the allowed MRLs. GMO soy in the USA is a case in point. As weed resistance to Roundup increased, heavier doses of the herbicide have been applied, leading to higher residues being detected in crops, soil and groundwater. Following US EPA simply announced in 2013 that they would increase the permitted amounts of glyphosate residue in certain crops.
Environmental Protection Agency (EPA) in April 2015: "Given increased public interest in glyphosate, EPA may recommend sampling for glyphosate in the future". Unlike in the USA, UK HSE quarterly reports produced by the Department for the Environment, Food & Rural Affairs (DEFRA’s) Expert Committee on Pesticide Residues in Food (PRiF) do check glyphosate residue levels in selected home produced and imported foods. Detected glyphosate residues are reported as within the permitted ranges ...
Perhaps the main reason that grains, seeds and pulses are at the top of the list is because these are the types of crops that receive a dose of Roundup immediately prior to harvest
Among the highest MRLs permitted in the European Union are the following foods (measured as mg/kg or parts per million)
20 ppm: for soya beans (most of the soya eaten in Europe is genetically modified), sunflower seed, barley, oats and sorghum
15 ppm: for sugar beet roots
10 ppm: for wheat, rye, linseed, dried lentils, dried peas, rapeseed, mustard seed, dried lupin beans and cotton seed
3.6 ppm: for wholemeal bread
2 ppm: for dried beans, tea leaves and dried herbal infusions, bovine kidney
1.05 ppm: for white bread
1 ppm: for olive oil, maize
0.5 ppm: for potatoes, oranges and mandarins, and pig kidney.
5.1 Zur Funktionsweise allgemeiner Suchmaschinen...............................................78
5.2 Die ökonomische Bedeutung von Suchmaschinen.............................................79
5.3 Konzentrationstendenzen auf Märkten für Suchplattformen..............................80
5.3.1 Marktabgrenzung und Marktanteile...........................................................80
5.3.2 Faktoren der Marktkonzentration und Marktbeherrschung........................83
5.4 Potenzielle Wettbewerbsprobleme auf den Märkten für Suchplattformen.........88
5.4.1 Suchplattformen als "Gatekeeper" des Internets........................................88
5.4.2 Expansionstendenzen von Suchplattformen...............................................93
5.4.2.1 Einbindung von Suchdiensten in andere Software- und Geräteplattformen..............................................................................93
5.4.2.2 Einbindung neuer Dienste und Inhalte zur Steigerung der Plattformattraktivität.........................................................................94
5.5 Zur Notwendigkeit regulatorischer Maßnahmen................................................98
5.5.1 Keine Notwendigkeit einer rein präventiven Regulierung.........................98
5.5.1.1 Keine Notwendigkeit eines missbrauchsunabhängigen Entflechtungsinstruments..................................................................99
5.5.1.2 Keine Notwendigkeit einer Regulierung des Suchalgorithmus.......100
5.5.2 Keine Notwendigkeit einer Vergemeinschaftung von Suchmaschineninfrastruktur....................................................................100
5.5.3 Förderung der Entwicklung von Standards als sinnvolle Maßnahme......103
5.5.4 Weiterentwicklung des Urheberrechts an indexierten Inhalten................103
5.4.2.1 Einbindung von Suchdiensten in andere Software- und Geräteplattformen
... So könnte die Anbindung von mobilen Betriebssystemen und Applikationen (Apps) mit zentralen Diensten wie z. B. der Google-Suche, Google-Maps oder Youtube den Wettbewerb zwischen verschiedenen Betriebssystemen, Verkaufsportalen für Apps (AppStores) oder unterschiedlichen App-Herstellern beeinträchtigen.
241. Konkret wurde Google in diesem Zusammenhang unter anderem vorgeworfen, im Rahmen des Mobile Application Distribution Agreements (MADA) den Wettbewerb auf dem Markt für die Entwicklung von Apps zu behinder. So ist für die Hersteller von Mobilgeräten (OEMs) die Vorabinstallation bestimmter Google-Apps an den Erwerb einer unentgeltlichen Lizenz geknüpft, die vorsieht, ein Bündel von mehreren Google-Apps, die sogenannte Google Mobile Application Suite (GMS) zu installieren. Zudem müssen unter anderem das Google Search Widget prominent auf dem Startbildschirm platziert und bestimmte Google-Dienste als Standard eingestellt werden.
242. Ob es hierdurch zu Wettbewerbsbeschränkungen kommt und ein Verfahren eröffnet werden muss, wird derzeit durch die Europäische Kommission geprüft. Dabei wird auch die Frage zu klären sein, ob die Bündelung verschiedener Apps zu einer wettbewerbswidrigen Verschließung des Marktes führt und unter Berücksichtigung möglicher Effizienzen negativ zu beurteilen ist.
5.5 Zur Notwendigkeit regulatorischer Maßnahmen 259. Die Monopolkommission ist der Ansicht, dass eine missbrauchsunabhängige, rein präventive Regulierung, insbesondere durch eine Regulierung des Suchalgorithmus oder regulatorische Entflechtungsinstrumente, derzeit nicht zu befürworten ist (dazu 5.5.1). Bei regulatorischen Maßnahmen, die darauf abzielen würden, Suchplattformen einen gleichartigen Zugang zu Nutzerdaten zu ermöglichen oder diesen durch Einrichtung eines staatlich finanzierten Webindex entbehrlich zu machen, überwiegen aus ihrer Sicht die Risiken gegenüber den möglichen Vorteilen (dazu 5.5.2). Allenfalls sollten Maßnahmen erwogen werden, welche die Entwicklung von Standards zur Vernetzung von Plattformen und zur Erhöhung der Interoperabilität fördern (dazu 5.5.3).
260. Eine Regulierung von Internetplattformen, die darauf abzielt, Missbräuche präventiv zu verhindern, ist aus Sicht der Monopolkommission allenfalls sehr eingeschränkt zu befürworten und erscheint jedenfalls derzeit nicht erforderlich.
Andrea Thompson, Climate Central, 18 January, 2017 (im Cache)
"2016 was the hottest year in 137 years of record keeping and the third year in a row to take the number one slot, a mark of how much the world has warmed over the last century because of human activities, U.S. government scientists announced Wednesday.
2016 is a "data point at the end of many data points that indicates” long-term warming, Deke Arndt, chief of the monitoring branch of the National Centers for Environmental Information, said.
[Es] steht der systemische, gesamtheitliche Ansatz der Projekte gegenüber der Förderung von Einzeltechnologien im Vordergrund. Hier verfolgt das Bundesministeriums für Bildung und Forschung (BMBF) einen neuen Ansatz in der Ausgestaltung der Energieforschungspolitik. In dessen Kern steht die Initiierung von Innovationen für die Energiewende. Es sollen Forschungsfelder von starker Komplexität, mit einem hohen Forschungsrisiko und besonderen Potenzialen für die Umstellung des Energiesystems bis 2025 wirtschaftlich nutzbringend erschlossen werden. Die Forschungsprojekte haben eine Gesamtlaufzeit von 10 Jahren, die in Förderperioden mit steigender Industriebeteiligung eingeteilt sind. So werden Ergebnisse aus der Grundlagenforschung bis hin zur Anwendung geführt. Das BMBF stellt für die erste Förderphase bis 2018 bis zu 120 Millionen Euro bereit. Bis 2025 sollen weitere 280 Millionen Euro zur Verfügung stehen.
In einem breit angelegten gesellschaftlichen Dialogprozess von Vertretern aus Wissenschaft, Wirtschaft und Zivilgesellschaft, die in der Dialogplattform Forschungsforum Energiewende (koordiniert von acatech, IASS und Max-Planck-Gesellschaft) zusammengearbeitet haben, sind die folgenden Themen herausgearbeitet worden:
Neue Netzstrukturen
In ausgewählten Stadt- und Landregionen werden Projekte zur Erprobung des Zusammenspiels intelligenter dezentraler und europäisch integrierter Versorgungsnetze aufgebaut, die Versorgungssicherheit und Datenschutz gewährleisten.
Flexiblere Nutzung erneuerbarer Ressourcen/Power-to-X
Ziel ist die Entwicklung der großtechnischen Voraussetzungen für die Auskopplung von Erneuerbare-Energien-Überschüssen aus dem Stromsektor in die Bereiche Wärme, Mobilität und chemische Grundstoffe. Dadurch wird die Möglichkeit geschaffen, die Erneuerbaren-Energien-Überschüsse zu weit über 90 Prozent zu nutzen.
Ausrichtung von Industrieprozessen auf fluktuierende Energieversorgung
Es sollen ausgewählte Industrieprozesse mit der volatilen Einspeisung der Erneuerbaren Energien verknüpft werden. Damit sollen die Voraussetzungen geschaffen werden, dass Deutschland bis zum Jahr 2030 Leitanbieter für diese angepassten Technologien und Prozesse wird.
Systemintegration/Transformation und Vernetzung der Energieversorgung
Ziel ist die Erarbeitung konsistenter Konzepte zur Gestaltung eines nachhaltigen deutschen Energiesystems. Anhand von systemanalytischen Untersuchungen in Modellregionen werden diese überprüft. Dabei sind soziale, ökologische, ökonomische und technische Aspekte sowie der gesamteuropäische Kontext zu berücksichtigen.
Die Kosten der fortschrittlichsten Batterietechnologie, Lithium-Ionen-Batterien, sinken rasch. Heute sind Lithium-Ionen-Akkus für rund 300Euro pro kWh erhältlich, während sie vor einem Jahr noch 500Euro pro kWh kosteten. Bis zum Jahr 2020 wird der Preis höchst wahrscheinlich auf Euro 100 pro kWh sinken. Wenn diese Entwicklung tatsächlich eintritt, dann werden die Gesamtbetriebskosten - die Summe aus Kaufpreis und Betriebskosten - von Elektrofahrzeugen so stark sinken, dass sie unter denen von Verbrennungsmotoren liegen werden. Dies wird den Verkauf von Elektrofahrzeugen ankurbeln, was sich wiederum stark auf das Stromnetz auswirken wird. Wenn es Deutschland gelingt, den Meilenstein von einer Million neuen Elektroautos bis 2020 zu erreichen, dann könnte das Land über eine ans Stromnetz angeschlossene Speicherkapazität von knapp unter 25 GWh verfügen. Dies würde ausreichen, um ganz Deutschland eine halbe Stunde lang mit Strom zu versorgen.
Die Fahrzeugelektrifizierung ist eine einmalige Chance und könnte zu einem entscheidenden und kostengünstigen Eckpfeiler der Energiewende werden. Durch neue Ladestrategien und die Schwarmaggregation der Elektrofahrzeuge (EVs) werden die EVs die operative Verwaltung und die Struktur des Stromnetzes auf noch nie da gewesene Art und Weise verändern. Dadurch wird es nicht nur zu einem Anstieg der Stromnachfrage und einer Zunahme der Belastungen für das Stromnetz kommen, sondern die BMWs und Teslas werden wahrscheinlich durch Energieverträge mit den Autobesitzern die Stromflüsse in und aus den Batterien kontrollieren.
Eine weitere interessante Auswirkung wird darin bestehen, dass in unseren Haushalten und Unternehmen wahrscheinlich kostengünstige, rekonditionierte Batterien, sogenannte Second- Life-Batterien, zum Einsatz kommen werden. Wenn die Batterien der ersten Elektroautos das Ende ihrer Nutzungsdauer erreicht haben, werden die Automobilunternehmen vor der Entscheidung stehen, diese zu recyceln oder ihnen eine andere Verwendung zu geben. Eine Alternative zum Recyceln der Batterien ist, sie zu rekonditionieren und für solche Anwendungen wiederzuverwenden, in denen sie weniger Belastungen ausgesetzt sind. Das wären z.B. stationäre Anwendungen, wo die Batterien in der Regel in kleinen Raten ge- und entladen und in einer kontrollierten und sicheren Umgebung eingesetzt werden. Auf diese Weise kann der Recyclingprozess verzögert und die Lebensdauer um bis zu 10 Jahre verlängert werden, wodurch zugleich neue Umsätze generiert werden.
Dies bedeutet, dass Second-Life-Batterien die gleichen Leistungen erbringen können, aber zu einem Bruchteil der Kosten. Außerdem werden Second-Life-Batterien durch den Anstieg des Lebensdauerwerts der Batterie die Kosten sowohl für die Primär- als auch für die Sekundärnutzer senken.
Und dies könnte dazu führen, dass die Batterien einen Übergang zu einer Wirtschaft basierend auf erneuerbaren Energien in einem kürzeren Zeitraum ermöglichen werden, als dies derzeit im Plan der deutschen Bundesregierung vorgesehen ist.
Die Preise für Second-Life-Batterien sind bereits sehr überzeugend und liegen bei 150 Euro pro kWh. Mit der zunehmenden Anzahl von Elektrofahrzeugen werden mehr und mehr dieser Batterien auf den Markt kommen. Bis zum Jahr 2025 könnten allein in Deutschland bis zu 25 GWh an Second-Life-Batterien pro Jahr auf den Markt kommen.
Claudia Kemfert äußert sich im Interview mit Jörg-Rainer Zimmermann
(im Cache)
...
Wer investiert denn eigentlich in die Energiewende? Das sind mittelständische, kleinere Unternehmen. Oder Privatpersonen. Die großen Vier investieren immer noch auf ihre Weise, im großen Stil, in Großprojekte wie Offshore-Parks – und das zu größten Teilen im Ausland. Bei der Umstrukturierung der Geschäftsmodelle sind sie eher behäbig. Dabei gibt es auf den Finanzmärkten großen Bedarf an klimafreundlichen Investitionsmöglichkeiten, immer mehr Anleger wollen sich finanziell im Zukunftsund Wachstumsmarkt erneuerbare Energien engagieren und finden leider nicht die politischen Rahmenbedingungen, um ihr Geld in Deutschland anzulegen. Ein professionelles Energiewende-Management würde Kapital aus aller Welt nach Deutschland lenken.
...
Ich beschäftige mich seit über 20 Jahren mit Energiemärkten und Klima-
schäden und muss zu dem Schluss kommen, dass die Energiewende ökonomisch sinnvoll ist. Den Gegnern werfe ich vor, dass sie sehr ideologisch argumentieren, was alles andere als nachvollziehbar ist. Es geht um die Offenlegung der Wertvorstellungen, der ökonomischen Betrachtung und um eine offene gesellschaftliche Debatte. Auf allen Ebenen.
... Das Gute ist, dass die Mehrheit der Bevölkerung die Erneuerbaren befürwortet. Das darf man nicht unterschätzen. Es gibt eine Bereitschaft für den Umbau des Energiesystems. Aber es gibt diese Kampagne, die die Angst schüren soll vor Blackout und Strompreissteigerungen. An dieser Stelle sind wir Wissenschaftler gefragt, die immer wieder verdeutlichen müssen, wie man bestimmte Annahmen einordnen muss.
... Das EEG hat den großen Vorteil, dass es Investoren Planungssicherheit gibt. Mehr als 40 Prozent der Geldgeber kommen aus dem mittelständischen Bereich, plus Banken, Fonds und Versicherungen. Ein weiterer Vorteil ist, dass man die Vergütungssätze flexibel anpassen kann, auch wenn das politisch vielleicht manchmal schwierig ist. Entsprechend erfolgt eine Anpassung an die jeweils erzielten Kostensenkungen, wie das etwa bei Solar der Fall war. Das Instrument ist zudem so ausgerichtet, dass irgendwann die Förderung von selbst endet. Weil das EEG so gestrickt ist, wurde es ja auch in rund 60 Länder gewissermaßen exportiert. Allerdings müssen wir jetzt darüber nachdenken, wie der ErneuerbareEnergien-Markt künftig aussehen muss, mit Speichern, intelligentem Netz, Lastmanagement, damit eine dauerhafte Versorgungssicherheit möglich ist. Das wäre bei der Erweiterung des EEG zu leisten.
... Ohne Quote. Dieses Instrument ist völlig ungeeignet, das System zu steuern, es kann sogar alles viel teurer werden. Empirische Untersuchungen aus anderen Ländern zeigen, dass die Risikoaufschläge weiter in die Höhe gehen. Auch in Deutschland ausschließlich Onshore-Wind auszubauen, um Kosten zu senken, wäre absurd. Ein abrupter Wechsel des Systems würde einen Schock auslösen und die Energiewende komplett abwürgen.
... Wir können nicht täglich neue Themen auf die Tagesordnung setzen, das Marktdesign ständig ändern, plötzlich von Kapazitätsoder Leistungsmärkten sprechen und dabei gigantische Regulierungsanforderungen aufstellen. Es geht darum, genau zu analysieren, in welchen Bereichen das EEG gut funktioniert, um dann zu betrachten, wo man Anpassungen vornehmen muss. Vor allem darf es nicht darum gehen, dass man das EEG abschafft und vielleicht Kapazitätsmärkte einrichtet, die dann massive Mitnahmeeffekte verursachen würden.
... Im Moment gibt es nur blinden Aktionismus, es werden wahllos Quotenregelungen oder Kapazitätsmärkte vorgeschlagen, die entweder nicht passen oder völlig überdimensioniert sind. Meine Vorschläge würden eher in Richtung der weiteren Anpassung der Vergütungssätze, netzbezogene Leistungen inklusive Lastmanagement und Speicherung gehen.
... Der CO2-Handel ist derzeit klinisch tot, wir benötigen dringend eine NotOP. Das Backloading wäre ein erster und wichtiger Schritt in die richtige Richtung gewesen, wobei wir auch weiterhin zahlreiche überschüssige Zertifikate im Markt ha-ben werden und wir daher auch dynamische Emissionsobergrenzen benötigen. Leider hat Deutschland in Brüssel nicht mit einer Stimme gesprochen und der Umweltminister den Wirtschaftsminister nicht überzeugen können. Dabei müsste auch der Wirtschaftsminister ein Interesse daran haben, dass die Energiewende wirtschaftlich gelingt. Wir benötigen einen Stopp des Ausbaus von Kohlekraftwerken, wir benötigen emissionsärmere, flexible Gas-KWK-Anlagen, die gut kombinierbar sind mit den erneuerbaren Energien. Diese rechnen sich nur bei einem höheren CO2-Preis. Ohne einen funktionierenden Emissionshandel ist auch die Energiewende in Gefahr.
... [In meinem Buch gehe ich] auch auf das deutsche SolarDebakel ein. [Frage ist:] Wird sich im Windbereich etwas Ähnliches wiederholen? Die Installations-Rallye ist ja voll im Gang.
Man muss zwar feststellen, dass diese Misere auch durch die internationale Marktentwicklung bedingt war. Aber der Politik fehlte es an diesem Punkt an Sensibilität. Man hätte die Probleme im internationalen Zusammenhang frühzeitig sehen und die heimische Wirtschaft stärken können. Leider hat man die Erneuerbaren aber unter den Generalverdacht der Ineffizienz gestellt. So spricht nun einiges dafür, dass die Politik im Windsektor die gleichen Fehler wie im Solarbereich machen könnte.
... Ich würde behaupten, dass diese Regierung derzeit keine effektive Wirtschaftspolitik zur Förderung der Energie-
wende betreibt. In Sachen Energieeffizienz wäre es noch einfach, marktnah zu agieren, aber auch auf diesem
Gebiet geschieht nichts. Wenn man sieht, dass es junge, innovative Unternehmen in Deutschland gibt, die viel investieren, dann ist mir unverständlich, warum man diese nicht unterstützt und die besten Marktbedingungen schafft. Leider ist auch diese Branche Opfer der Negativkampagne im aktuellen Kampf um Strom.
Inventory of U.S. Greenhouse Gas Emissions and Sinks: 1990 - 2014
The Cloud is surprisingly poisonous, a fact that few people outside of big data centers seem to be aware of. And that's before the energy hog known as Bitcoin came along.
According to a 2011 study by Greenpeace, data centers alone account for almost 2 percent of all global electricity use, and this use is projected to increase by at least 12 percent annually. In the 2014 update to this report, Greenpeace noted that if the Cloud were a country, it would rank sixth overall in national energy consumption, behind the United States, China, Russia, India, and Japan—but well ahead of Germany, Canada, Brazil, and France.
Fossil fuel & water usage for manufacturing one desktop computer
The total amount of fossil fuels used to make a desktop computer weighs over 240 kilograms.
The amount of water required is 1.5 m3.
Cooling water consumption
Cooling even a medium-size high-density server farm can require 1360 m3/day.
The National Security Agency's new Intelligence Community Comprehensive National Cybersecurity Initiative Data Center in Bluffdale, Utah, is estimated to consume 6500 m3/day.
E-waste and pollution
Western nations alone account for more than 25 million tons of e-waste every year, and the disposal of this waste -often in less environmentally regulated regions of the developing world- introduces into the environment such dangerous contaminants as Pb, Sb, Hg, Cd, and Ni, as well as polybrominated diphenyl ethers and polychlorinated biphenyls (PCBs).
In the roughly 10 by 40 mile strip of land that comprises Santa Clara County, California, there are 23 Superfund sites; most of them are contaminated by the byproducts of semiconductor manufacturing, including such highly toxic chemicals as trichloroethylene, Freon, and PCBs.
Among other dangers, these chemicals have been linked to elevated rates of miscarriages, birth defects, and cancer. So far, more than $200 million has been spent on cleaning up soil and ground-water pollution in the area, and the extent of the problem is only just starting to be addressed. Most of the well-educated and well-paid engineers and scientists who live in the area are unaware of the environmental dangers posed by their seemingly "clean” post-industrial information economy.
Crowdfunding - Back to the roots
1961 wurde die jetzige GLS Treuhand gegründet, um gemeinsam Projekte finanzieren zu können, die von Einzelnen nicht zu stemmen wären. Mit dieser Crowdfunding Plattform kehren wir zu unseren Wurzeln zurück, denn Crowdfunding heißt nichts anderes, als mit vielen Anderen die Finanzierung für Projekte sicherzustellen, die sonst nicht umgesetzt werden könnten.
Gemeinsam gute Ideen verwirklichen
Viele Menschen haben gute Ideen, wie sie das Leben für sich und andere noch besser gestalten können. Was oft fehlt, sind die nötigen finanziellen Mittel, um diese Pläne zu verwirklichen. Doch unsere Erfahrung zeigt: Wenn sich Unterstützer/innen zusammenschließen, um eine gute Idee gemeinsam umzusetzen, dann wird möglich, was vorher utopisch schien. Unsere Crowdfundingplattform bietet die Möglichkeit, Projekte vorzustellen und Menschen zu finden, die bei der Umsetzung dieses Projekt helfen wollen.
Mitmachen ist ganz leicht
Gemeinnützige Projekte haben viele Formen und brauchen z.B. Geld für Musikinstrumente in einer Schule, den Aufbau eines Schulungszentrums in Kenia, einen Segeltörn für psychisch Erkrankte oder, oder, oder. Wann immer Sie ein Projekt für einen Verein oder eine gemeinnützige Einrichtung realisieren möchten, können Sie hier finanzielle Unterstützung suchen und finden. Einfach registrieren und los geht’s.
Zwei Phasen, ein Ziel: Projekte realisieren
Jedes Crowdfunding-Projekt durchläuft zwei Phasen. Zunächst kommt es darauf an, möglichst viele Fans zu gewinnen, die dem Projekt ihre Stimme geben. Ist die nötige Anzahl von Befürwortern gefunden, startet die Finanzierungsphase, in der Geld für das Projekt gesammelt wird. Dabei gibt einfach jeder so viel, wie er möchte. Nach einem definierten Zeitraum wird geschaut, ob genügend Geld für die Realisierung des Projekts gesammelt wurde. Wenn ja, können die Initiator/innen durchstarten und die Unterstützer/innen erhalten gegebenenfalls am Ende ein kleines Dankeschön. Falls die notwendige Summe nicht erreicht wurde, bekommen die Förderer/innen ihr Geld zurück.
Bürgerenergie ist faszinierend und inspirierend. Sie wird der Politik mit dem Projekt "Hol den Energiepolitiker!" näher gebracht. Das ist dringend nötig, da tolle Projekte von Bürgerinnen und Bürgern und ihr persönlicher Einsatz Gefahr laufen, von der Politik abgewürgt zu werden. Wahrscheinlich, weil die Politiker Bürgerenergie nie persönlich erlebt haben!
Das wollen wir ändern! Wir stellen die Projekte einer breiten Öffentlichkeit vor und bringen PolitikerInnen mit EnergiebürgerInnen zusammen.
Kategorie: Erneuerbare Energien
Stichworte: Bürgerenergie, Politik, erneuerbare Energie, Bürger
Die Menschen wollen, dass wir schneller voran schreiten beim Umbau des Energiesystems zu einer humanen, dezentralen, sicheren und sauberen Energieversorgung.
Schon jetzt erzeugen Bürgerinnen und Bürger mit PV, Wind und Biomasse sauberen Strom, stellen ihn mit Mietermodellen einem größeren Teil der Gesellschaft zur Verfügung, entwickeln Nahwärmenetze genossenschaftlich, erwerben Energienetze und erschließen die Elektromobilität. In jedem Feld der Energieversorgung betätigen sich Bürgerinnen und Bürger schon heute. Und sie wollen es in Zukunft noch mehr tun … wenn ihnen von Seiten der Politik keine Steine in den Weg gelegt würden.
Ein großer und schwerer Brocken droht das neue EEG zu werden. Bürgerenergie würde durch die "gezielte" Lenkung des Ausbaus der Erneuerbaren massiv ausgebremst. Das Ausschreibungssystem ist für viele engagierte Bürgerinnen und Bürger schlichtweg eine unüberwindbare Hürde. Die Politiker würdigen die besonderen Leistungen der Bürgerinnen und Bürger nicht, sie verschließen die Augen davor, was Bürgerenergie bewegt – energiewirtschaftlich und gesellschaftlich.
Wie ändern wir dies?
Durch unser beharrliches Engagement für eine Energiewende in Bürgerhand. Bei Ihnen vor Ort, in den vielen Bürgerenergiegesellschaften und im gemeinsamen politischen Handeln.
Durch kreative Ideen, Kooperationen und dem Dranbleiben am Umbau des Energiesystems, trotz der massiven Behinderungen. Wir sind sicher: Mittelfristig wird die dezentrale Energieversorgung aus Erneuerbaren Energien nicht zu verhindern sein.
Durch Überzeugungsarbeit gegenüber der Politik. Bei Ihnen vor Ort, in Ihrem Wahlkreis, in der Landes- und Bundespolitik.
Deshalb hat das BBEn das mehrjährige Projekt "Hol den Energiepolitiker!" gestartet. Bei diesem Projekt treffen Bürgerinnen und Bürger auf die Entscheidungsträger der Energiepolitik. Sie können ihre Leistungen zeigen, unangenehme Fragen stellen. Die EnergiepolitikerInnen erfahren mehr über Bürgerenergie als demokratische und dezentrale Form der Energiegewinnung. Wir dokumentieren die Treffen, stellen Öffentlichkeit her und erhöhen damit das Bewusstsein für Bürgerenergie in der Gesellschaft sowie bei den PolitikerInnen. All das bedeutet großen Aufwand für uns, und es kostet viel Geld. Aber wir glauben, dass die Kosten von "Hol den Energiepolitiker!" eine sichere Investition in eine bürgernahe Energiewende sind.
Denn die Energiewende wird nur mit den Bürgerinnen und Bürgern erfolgreich sein. Tragen Sie dazu bei, dass den wichtigen Politikern wie Gabriel, Hendricks, Woidke (Ministerpräsident Brandenburg) und anderen deutlicher wird. Unterstützen Sie das Projekt "Hol den Energiepolitiker!".
Der SRU ist der Auffassung, dass Deutschland aus den folgenden Gründen bei einem solchen nachhaltigen Umbau der Industriegesellschaft eine Vorreiterrolle einnehmen sollte:
Deutschland steht aufgrund seiner internationalen Verflechtung in der Verantwortung. Neue Indikatoren zeigen, dass Deutschland unter Berücksichtigung des internationalen Handels erheblich auf die natürlichen Ressourcen anderer Länder zurückgreift.
Eine erfolgreiche Vorreiterpolitik schafft internationale Zukunftsmärkte. Sie ist zudem Treiber der wirtschaftlichen Modernisierung durch die Verbreitung energieund ressourceneffizienter Technologien oder neuer Systemlösungen.
Deutschland hat exzellente Voraussetzungen dafür, ein globaler "Vorreiter der Transformation" zu werden. Dazu zählen ein starkes Innovationssystem, eine große Wirtschaftskraft und eine - im Grundsatz - breite gesellschaftliche Unterstützung für aktive Umweltpolitik.
Globale Umweltpolitik benötigt nationale Vorreiter. In der Vergangenheit waren es häufig einzelne Länder, deren Vorreiterrolle eine internationale Einigung auf einem relativ hohen Schutzniveau ausgelöst hat. Eine glaubwürdige internationale Verhandlungsposition zum Erhalt der natürlichen Lebensgrundlagen setzt zudem eine national ambitionierte Politik voraus.
Eine Vorreiterpolitik wirkt nicht nur global, sondern schafft auch vielfältigen Nutzen auf der nationalen und lokalen Ebene. Beispiels-weise können Klimaschutzmaßnahmen auch die lokale Luftqualität verbessern, die städtische Lebensqualität steigern oder Brennstoffkosten einsparen.
"Mit dem WindGas-Projekt fördert die HanseWerk AG eine mögliche Schlüsseltechnologie für die Energiewende. Ab 2015 startet eine neue Anlage in Hamburg ihren Regelbetrieb."
A ... recent study by researchers from the Netherlands and the USA (Fthenakis, Kim and Alsema, 2008 (in cache)), which analyses PV module production processes based on data from 2004-2006. They find that
it takes 250kWh of electricity to produce 1m of crystalline silicon PV panel. Under typical UK conditions, 1 m2 of PV panel will produce around 100kWh electricity per year, so it will take around 2.5 years to "pay back" the energy cost of the panel.
the total greenhouse gas emission (including CO2 and other gases) for electricity from PV panel is probably between 20 and 80g CO2-equivalent per kWh under UK conditions. This is 10 times lower than the emissions for electricity from fossil fuels (UK grid average is around 500g/kWh, electricity from coal can be as high as 1000g/kWh).
Referentenentwurf des BMWi (IIIB2)
Gesetz zur Weiterentwicklung des Strommarktes, BR-Drucks. 542/15.
Die Marktanalysen sind abrufbar im Internet Beschluss des Bundesrates vom 18.12.2015, BR-Drucks. 555/15 (B)
Bearbeitungsstand: 14.04.2016 23:25 Uhr
(im Cache)
Stellungnahmen
Windwärts Energie GmbH ("Die Windwärts Energie GmbH zählt zu den Pionieren der Windenergiebranche"): Offizieller Entwurf für neues EEG veröffentlicht (02. Mai 2016 - 14:24 Uhr), (im Cache)
"Einen festen Ausbaukorridor, dessen Einhaltung durch Anpassungen der Vergütungshöhe gesteuert wird, wie es im gültigen EEG der Fall ist, soll es nicht mehr geben. Stattdessen sollen die Ausbaumengen davon abhängig sein, wie viel Erzeugungskapazitäten aus erneuerbaren Energien noch gebaut werden müssen, um das proklamierte Ziel eines Erneuerbaren-Anteils an der Stromerzeugung von 45% im Jahr 2025 zu erreichen. Um diese Menge zu errechnen, werden die bestehenden Kapazitäten und die nach weiterhin festem Ausbaukorridor zugebauten Mengen an Photovoltaik und Offshore-Windenergie von der Zielmarge abgezogen. Damit wird die Windenergie an Land als günstigste Technologie zum "Lückenfüller" - ob da eine Logik dahintersteckt, erschließt sich wohl nur Minister Gabriel und seinen Mitarbeitern. Eine Höchstmenge von 2.500 Megawatt brutto pro Jahr, die zugebaut werden darf, wird auch festgelegt, während eine Mindestmenge in der Koalition noch umstritten ist."
UDI - "Grünes Geld, Saubere Rendite": EEG-Novelle 2016 - die Eckpunkte, Stand: 2.6.2016 (im Cache):
"Solar: Zubau p.a. 2.500 MW, davon maximal 600 MW über größere Solaranlagen (per Ausschreibung) Windkraft an Land: Ausbaugrenze wird auf 2.800 MW jährlich erhöht; Repowering wird aber immer noch mit eingerechnet. Neu wegen "Vermeidung Überlastung der Stromnetze": nur maximal 60 % des durchschnittlichen Neubaus dürfen in Norddeutschland errichtet werden
Ausschreibungssystem soll kommen.
Ausschreibungsverfahren für Projekte, die bereits die Genehmigung nach dem Bundesimmissionsschutzgesetz haben. Forderung einer finanziellen Sicherheit in Höhe von 30 Euro je Kilowatt installierter Leistung. Nach Zuschlagserteilung hat der Betreiber 2 Jahre Zeit zu bauen. Danach wird eine gestaffelte Vertragsstrafe fällig, bis nach 2,5 Jahren der Zuschlag komplett verfallen würde. Ausgenommen sind Windenergie-Anlagen, die bis Ende 2016 immissionsschutzrechtlich genehmigt und bis Ende 2016 in Betrieb genommen werden, Anlagen mit einer Leistung kleiner 1 Megawatt, und Prototypen mit einem Umfang von maximal 100 Megawatt pro Jahr.
2017 gibt es 3 Ausschreibungsrunden, 2018 vier.
Als Basis dient ein einstufiges Referenzertragsmodell, wobei 7 Cent / kWh für den 100-Prozent-Referenzstandort der Höchstwert sind.
Der Ausbaukorridor für Onshore-Windkraftanlagen errechnet sich vereinfacht "aus dem, was übrig bleibt", wenn man die Leistung aus allen anderen neuen Anlagen (aus allen anderen EE plus offshore) und aus den Bestandsanlagen zusammennimmt und von der Gesamtzielmenge "Strom aus EE" abzieht. Dabei geht man von max. 2.500 Megawatt netto aus, als Mindestausschreibungsmenge sind "xxx brutto" (und das steht wörtlich im Referentenentwurf!) Megawatt vorgesehen."
Clemens Weiß – energiezukunft.eu, "EEG-Reform: Bund und Länder treten auf Ökostrom-Bremse", 1. Juni 2016: Solarenergie: Für sie soll die jährliche Zubaugrenze bei 2500 Megawatt (MW) liegen, 600 MW sollen per Ausschreibungen vergeben werden. Windkraft an Land: Der Ausbau soll auf insgesamt 2800 MW gedrosselt werden - inklusive Repowering, das in Zukunft ebenso ausgeschrieben werden muss. Zuletzt betrug der Windenergieausbau noch 3.700 MW.
Ziel der Bundesregierung ist es, bis zum Jahr 2025 einen Ökostromanteil von 40 bis 45 Prozent zu erreichen - das ist wenig ehrgeizig. Denn der Anteil liegt bereits heute bei knapp einem Drittel, innerhalb von zehn Jahren wären größere Schritte möglich. Besonders im Hinblick auf die deutschen Klimaziele bis 2020 müsste das Ausbautempo der erneuerbaren Energien beibehalten werden. Umweltschutzorganisationen und Klimaexperten sind sich einig, dass mit dieser EEG-Reform die Vorgaben wohl nicht zu erreichen sind.
Wirtschaftsminister Gabriel verwies bei der Drosselung des Windenergie-Ausbaus auf Netzengpässe besonders in Norddeutschland. Deshalb wurden zwei sogenannte Netzengpassgebiete festgelegt. Die Bundesnetzagentur kann zukünftig den Zubau von Windkraftanlagen zusätzlich ausbremsen, besonders Schleswig-Holstein und Niedersachsen könnten davon betroffen sein.
Dabei seien es gar nicht die erneuerbaren Energien, die die Netze verstopften, betonte Baden-Württembergs grüner Energieminister Franz Untersteller noch am Dienstag. Ähnlich hatte sich zuvor bereits Schleswig-Holsteins Energieminister Robert Habeck (ebenfalls Grüne) geäußert. Eine neue Analyse des Beratungsinstituts Energy Brainpool im Auftrag von Greenpeace gibt ihnen dabei Recht: Nicht die erneuerbaren Energien, sondern unflexible Kohle- und Atomkraftwerke überlasten demnach die Stromnetze in Deutschland.
Astrid Dähn, Energiepolitik_EEG-Novelle, "Die "Weltformel"", Seiten 12-15, Neue Energie 04/2016 (im Cache):
"In seinem Entwurf für das EEG 2016 hat des Bundeswirtschaftsministerium (BMWi) eine Formel vorgelegt, mit der sich berechnen lässt, wie hoch das jähriche Ausschreibungsvolumen - also die Windkraftsleistung, die pro Jahr zur Neuinstallation an Land ausgeschrieben werden soll - bis 2025 sein darf. Die Idee dabei: Man gibt vor, welchen Anteil die Erneuerbaren insgesamt im Jahr 2025 am Stromverbrauch haben sollen; das Maximalziel der Bundesregierung liegt gemäß Koalitionsvertrag bei 45%. Dann prognostiziert man, welchen Anteil davon die übrigen regenerativen Quellen wie Sonne, Wind offshore, Bioenergie und Wasserkraft liefern und welchen Anteil bereits bestehende Erneuerbaren-Kraftwerke beisteuern werden. Was übrig bleibt, wird der Windenergie an Land zugesprochen und, möglichst gleichmäßig über die Zeitspanne bis 2025 verteilt, per Ausschreibung zum Neubau.
Die Annahmen
Um die Strommenge für Wind an Land im Jahr 2025 zu ermitteln, muss das BMWi eine Reihe von Schätzwerten und Prognosedaten in die Formel aufnehmen. Die wichtigsten sind:
Der Bruttostromverbrauch in Deutschland im Jahr 2025; er wird in diesem Fall aus der Vergangenheit abgeleitet, nämlich aus einemgewichteten Mittelwert der letzten 5 Jahre von dem aktuellen Anwendungsjahr der Formel.
Die künftigen Volllaststunden der verschiedenen Anlagentypen.
Die voraussichtliche durchschnittliche Betriebsdauer von Windrädern, Solaranlaen und Bioenergie-Kraftwerken.
Eine Ausfallquote, die berücksichtigt, dass einige der ausgeschriebenen Projekte am Ende nicht realisiert werden.
Die jährlichen Zubauraten bis 2015 für alle regenerativen Energien ausgenommen die Onshoe-Windkraft. (Dabei wird zwischen leistungsstarken PV-Anlagen, die dem Ausschreibungsverfahren unterliegen, und kleinen, weiterhin über feste Einspeisetarife geförderte Hausanlagen unterschieden. Bei Wasserkraft und Geothermie geht das BMWi von einer Stagnation aus.)
Ein Verzögerungsfaktor, der abschätzt, wie viel Zeit zwischen Ausschreibung und Inbetriebnahem der Windräder vergeht.
Die lange Liste der Annahmen macht deutlich: In der Formel gibt es extrem viele Stellschrauben, an denen sich drehen lässt. Ihr Endergebnis ist demnach mit großen Unsicherheiten behaftet - je nachdem, welche Zahlenwerte man für die verschiedenen Variablen einsetzt. Unterschiedliche Werte für die Stromproduktion aus bestehenden Erneuerbaren-Anlagen im zweiten Teil der Formel können beispielsweise zu erheblichen Abweichungen bei der resultierenden Zubaumenge führen.
In einer Testrechnung hat etwa das Beratungsunternehmen Energy Brainpool die jährliche Stromproduktion aus Onshore-Windrädern über die installierte Leistung und einen Mittelwert der Volllaststunden der Jahre 2010 bis 2014 abgeschätzt. Der Windprojektierer WPD hat dagegen den Zahlenwert des statistischen Bundesamts für die Gesamtstromerzeugung aus Erneuerbaren 2015 als Ausgangsbasis genommen. Das Resultat: Die beiden Berechnungen für die auszuschreibende Strommenge für Wind an Land bis zum Jahr 2025 unterscheiden sich um 23 TWh, d.h. um eine zu installierende Gesamtleistung von rund 10500 MW - das ist ein jährlicher Unterschied im Zubau von ca. 1300 MW.
Andere Einflussgrößen können ähnliche Schwankungen bewirken."
Die Gesamtkapazität regenerativer Kraftwerke hat 2014 erstmals die 1700-Gigawatt-Marke überschritten. Angetrieben vom starken Zubau von Wind-, Solar- und Wasserkraft betrug der Anteil erneuerbarer Energien an der weltweiten Kraftwerksleistung Ende des Jahres 27,7 Prozent.
Der Renewables 2015 Global Status Report zeigt aber auch: die Subventionen für fossile Energieträger stellten 2014 erneut die Investitionen in erneuerbare Energien in den Schatten.
"Mit rund 270 Milliarden US-Dollar erreichten Investitionen in regenerative Energien und Treibstoffe im vergangenen Jahr einen neuen Höchststand.
Gleichzeitig hätte diese Summe nach Ansicht des Renewable Energy Policy Network for the 21st Century (REN21) noch höher ausfallen können, wenn im selben Zeitraum nicht mehr als 550 Milliarden US-Dollar an Subventionen in Atomenergie und fossile Energieträger geflossen wären.
"Gleiche Wettbewerbsbedingungen würden die Entwicklung und Nutzung von Energieeffizienz und Erneuerbare-Energien-Technologien stärken. Würden die Subventionen für fossile und Atomenergie gestrichen, würde deutlich, dass Erneuerbare bereits jetzt die günstigste Energiequelle sind", sagte Christine Lins, Geschäftsführerin von REN21, anlässlich der Präsentation des 10. Renewables Global Status Report des internationalen Netzwerks.
Dennoch sind die 270 Milliarden Dollar ein Beleg für den positiven Trend im Erneuerbaren-Sektor.
Insbesondere in den Entwicklungsländern verzeichnete REN21 einen starken Anstieg der Investitionen. Mit 131,3 Milliarden US-Dollar lagen sie 36% über dem Vorjahreswert und fast gleichauf mit den Gesamtinvestitionen der Industrieländer, die 2014 138,9 Milliarden US-Dollar betrugen und damit lediglich um 3% gegenüber 2013 gestiegen sind.
Größten Anteil am Aufschwung hatte China, das allein 63% zu den Investitionen der Entwicklungsländer beisteuerte.
Aber auch in Chile, Indonesien, Kenia, Mexiko, Südafrika und der Türkei flossen jeweils mehr als 1 Milliarde US-Dollar in den Ausbau der erneuerbaren Energien.
Wirtschaft wächst, ohne dass Emissionen steigen
Weltweit legten die Investitionen in erneuerbare Energien gegenüber dem Jahr 2013 um 17% zu.
Damit setzt sich der seit 5 Jahren anhaltende Trend fort, dass die Erneuerbaren bei den Netto-Investitionen die fossilen Brennstoffe überholt haben.
2014 stellten erneuerbare Energieträger bereits mehr als 59% des Netto-Zuwachses der weltweiten Kraftwerkskapazität.
Der Zubau von Solarenergie, Windkraft und anderen erneuerbare Energien lag laut Angaben von REN21 bei 135 Gigawatt (GW),
in Summe stieg die Gesamtleistung der regenerativen Kraftwerke innerhalb des vergangenen Jahres damit um 8,5% auf 1712 GW.
Neben dem deutlichen Zuwachs an Investitionen und installierter Leistung, zeigt der REN21-Report einen weiteren positiven Trend auf:
Die Entkoppelung von wirtschaftlicher Leistung und Treibhausgas-Emissionen schreitet voran. Obwohl der weltweite Energieverbrauch in den letzten Jahren durchschnittlich um 1,5% angestiegen und das weltweite Bruttosozialprodukt im Mittel um 3% gewachsen ist, sind die CO2-Emissionen gegenüber 2013 stabil geblieben. Zum ersten Mal seit 4 Jahrzehnten wuchs damit die Weltwirtschaft, ohne dass parallel die CO2-Emissionen stiegen.
TABLE 2. STATUS OF RENEWABLE TECHNOLOGIES: CHARACTERISTICS AND COSTS
Source: Table 2 of REN21
The DANDELION uses the multiplier effect to ensure its survival.
Its flower head is composed of hundreds of seeds that scatter with the smallest gust of wind and contain the necessary material to generate
and form a new flower.
Populating the landscape with efficient financial instruments can support the implementation of renewable energy systems to meet energy needs, cleanly and sustainably.
Collective behaviour and nest architecture of SOCIAL INSECTS, like bees, can inspire innovative policy design for future energy systems.
While individual social insects exhibit relatively simple behaviours, collectively, the colony can address complex issues.
Future energy systems will be based on renewables which often can be both distributed and decentralised. Policy design will need to adapt to changing conditions, integrating the different specificities of the renewables, the changing energy demands and the behaviour patterns of a wide variety of players.
Europe
European countries —at the forefront of the development of feed-in policy mechanisms— continued their recent trend of revising existing policies. Unlike in recent years, however, these changes are now being formalised in a continent-wide shift away from Feed-In_Tariffs (FITs) through guidance from the European Commission. The Commission’s new State Aid guidelines, issued in 2014, instruct EU countries to begin using tendering to allocate support to new renewable energy projects in 2015–16, with all new project support to be allocated through renewable energy tenders by 2017
Meanwhile, EU countries enacted a host of revisions to existing FIT schemes in 2014.
... Also in 2014, many European countries at the national level— including Bulgaria, Germany, Greece, Italy, and Switzerland— made FIT rate cuts, with most reductions focused primarily on solar PV and wind power.
... Degression mechanisms are now in place in some European countries, including Germany, Italy, and Switzerland. In the United Kingdom, the minimum degression rate of 3.5% was triggered for all new renewable power installations as of January 2015 (the total volume of installations failed to trigger the higher automatic reduction rates).
p 40
In Germany ... systems below 1 MW accounted for 68% of all solar PV capacity added to the country’s grid in 2014
pp 73 - 74
In Europe, declining markets due to regulatory instability and the protracted recession have forced manufacturers to devise new growth scenarios and to consider moving factories overseas.
"Auf dem G7-Gipfel im Juni 2015 wurde beschlossen, die Kohlendioxidemissionen um 40 - 70% bis zum Jahr 22050 gegenüber 2010 zu senken. Nur mit einer Senkung um 70% lässt sich überhaupt das Klimaschutzszenario RCP2.6 des IPCC erreichen, das allerdings ab 2070 mit umstrittenen CCS-Methoden negative Kohlendioxidemissionen vorsieht. Soll das 2-Grad-Klimaschutzziel auch sicher ohne CCS erreicht werden, müssten dieKohlendioxidemissionen bereits zwischen 2040 und 2050 auf Null reduziert werden. In Deutschland müsste dazu das Ausbautempo regenerativer Energien vervierfacht werden."
Quelle
"Auf dem Klimagipfel 2015 in Paris wurde beschlossen, den globalen Temperaturanstieg auf 1,5 Grad Celsius zu begrenzen. Hierzu muss unsere gesamte Energieversorgung vollständig auf regenerative Energien umgestellt werden. Beim derzeitigen Tempo der Energiewende dauert das in Deutschland aber noch 140 Jahre. Nach dem Szenario RCP2.6 des Weltklimarats IPCC muss die globale Energiewende im Jahr 2070 abgeschlossen sein, wenn wir danach Kohlendioxid mit umstrittenen und teuren CCS-Verfahren wieder aus der Atmosphäre holen und Untertage endlagern. Wollen wir auf CCS verzichten, ist eine vollständig erneuerbare Energieversorgung noch vor dem Jahr 2050 nötig. Dazu müsste das Tempo der deutschen Energiewende fast um den Faktor 5 gesteigert werden. Zeit, endlich zu handeln!"
Die Ausbaukorridore in den EEG-Novellen 2014/16 zeigen, dass weder die Regierung noch die zentralen Energieversorger die Energiewende schaffen werden. Damit kann die Energiewende nur noch von den Bürgern selbst herbeigeführt werden. Und sie haben mit dem bisherigen Ausbau der Erneuerbaren Energien bewiesen, dass sie dazu in der Lage sind.
PV-Überschüsse bei 200GWp PV-Leistung (Staffelstein, Bild 6)
Mögliche Nutzung von PV-Überschüssen bei 200GWp PV-Leistung (Staffelstein, Bild 8)
Keine Kostenvorteile bei zentralen PV-Großanlagen (Staffelstein, Bild 10)
Dezentrale Kleinanlagen werden von Einzelpersonen oder kleinen Gruppen zur Eigenversorgung installiert. Einzelpersonen, die ihr Geld statt auf der Bank anzulegen und Zinsen zu bekommen, in PV investieren, verlieren nur wenig an entgangenen Zinsen. Ihre PV-Stromkosten liegen je nach Kosten der PV-Module und der Höhe des Verlusts an Zinsen zwischen 10 und 17 Cents pro kWh.
Großanlagen nehmen Kredite in Anspruch. Kredite kosten mehr Zinsen als Guthaben einbringen. Deswegen sind Großanlagen weniger profitabel als dezentrale Kleinanlagen.
Das Potenzial für dezentrale PV-Anlagen auf Dächern beträgt etwa 100 TWh/Jahr entsprechend etwa 130 GWp (im Mittel hat man in Deutschland 900 PV-Volllaststunden pro Jahr). Wenn eine Kleinanlage vom Stromnetz unabhängig ist, haben die EEG-Novellen keinen Einfluss auf sie.
Speicher verringern Abregelungsverlust: Wenn man 1 kWp auf 400 W abregeln muss, verliert man im Jahresmittel
bei einem PV-System ohne Eigenverbrauch und Speicher 27% seines PV-Stroms,
bei einem PV-System mit Eigenverbrauch aber ohne Speicher 16% seines PV-Stroms,
bei einem PV-System mit Speicher und mit fester Einspeisegrenze durch Abregelung 12% seines PV-Stroms,
bei einem PV-System mit Speicher und mit dynamischer Einspeisegrenze 3% seines PV-Stroms
Stellungnahmen zur EEG-Novelle 2016
Beate Petersen, engagierte Energiebürgerin und stellvertretende Sprecherin des Rates für Bürgerenergie
"Es ist dringend geboten, den aktuell geplanten Beschluss zur EEG-Novelle 2016 bis nach der Sommerpause zu verschieben. Dafür gibt es gute Gründe: Es stimmt zwar, dass die Energiewende Geld kostet. Weiterhin nicht oder mit angezogener Handbremse zu handeln wird aber deutlich teurer! Insbesondere BürgerEnergiE ist von unschätzbarem Gemeinwohl-Wert – für uns alle. BürgerEnergiE ist ehrenamtliches Engagement zahlreicher BürgerInnen, die sich deutschlandweit in fast 1.000 BEGs für eine saubere EnergiE-Versorgung vor Ort engagieren. Dies bringt UNS – gesamtgesellschaftlich - viele Vorteile! Last but not least ist die EEG-Novelle 2016 kein "stand-alone"-Gesetz, sondern im Gesamtkontext mit weiteren Gesetzesänderungen zu sehen, welche die Energiewende maßgeblich ausbremsen werden. Deshalb engagiere auch ich mich – gemeinsam mit dem und für das BBEn – weiter für die EnergiE-Wende in Bürgerhand!"
Jakob Müller, Experte für die Marktentwicklung bei den Energiegenossenschaften und BBEn-Vorstand
"Die erklärte Absicht von CDU/CSU und SPD zum Erhalt der Akteursvielfalt kann man zum aktuellen Zeitpunkt nur missverstehen. Denn ganz im Gegenteil fördern die Gesetzgebungsinitiativen der Bundesregierung die Energiekonzerne und machen es Bürgerenergieakteuren schwer. Bürgerenergieakteure sind seit Beginn der laufenden Legislaturperiode stark verunsichert, und diese Verunsicherung wird zunehmen. Die Neuregistrierung von Energiegenossenschaften ist im Jahr 2015 zum dritten Mal in Folge stark zurückgegangen. Nur 49 neu eingetragene Energiegenossenschaften sprechen für die anhaltende Verunsicherung bei EnergiebürgerInnen, gemeinsame Anstrengungen gegen den Klimawandel zu starten."
Dr. Hermann Falk, Geschäftsführer des Bundesverbandes Erneuerbare Energie e.V. und ehemaliges Vorstandsmitglied des BBEn
"Der Regierungsentwurf zur Novelle des EEG nützt nicht den Bürgern und dem Mittelstand. Bislang werden die Chancen für Kostendämpfung und mehr Akzeptanz nicht ausreichend genutzt, vielmehr der teure Kohle- und Atomstrom unter Schutz gestellt. Um die Energiewende und damit Millionen Akteure in den Kommunen und im Mittelstand nicht ins Abseits zu stellen, muss der Bundestag den Regierungsentwurf zur EEG-Reform korrigieren. Durch die Entbürokratisierung des staatlichen Ausschreibungsverfahrens könnten EE-Projekte von Bürgern, Kommunen und Bürgerenergiegesellschaften ihre Stärken einbringen: mehr Akzeptanz vor Ort und dezentrale, kostengünstige, häufig auch innovative Stromerzeugungslösungen. Die Regeln für die Ausschreibung von Erneuerbaren-Projekten müssen so verbessert werden, dass Bürgerenergieprojekte und der Mittelstand weiter an der Energiewende teilnehmen können."
Prof. Dr. Volker Quaschning, Professor für Regenerative Energiesysteme an der HTW Berlin und Mitglied im Rat für Bürgerenergie
"Beim bisherigen Tempo hätte die Energiewende bereits über 100 Jahre gedauert. Mit den im EEG 2016 geplanten Änderungen ist eine klimaneutrale Energieversorgung überhaupt nicht mehr möglich. Die politisch Verantwortlichen haben offensichtlich ausschließlich die Rettung der Energiekonzerne und der Kohlewirtschaft im Auge und beabsichtigen inzwischen gar nicht mehr, die Klimaschutzzusagen aus Paris einzuhalten. Die Einhaltung der Paris-Ziele aber ist möglich - dies zeigt unsere aktuelle Studie zur Sektorkopplung."
Was die Paris-Beschlüsse für den Ökostromausbau bedeuten: Sektorkopplungsstudie vorgestellt
Welchen Ausbau der Erneuerbaren und der Energieeffizienz eine klimafreundliche Versorgung mit Strom, Wärme und Mobilität im Sinne der Pariser Klimabeschlüsse wir brauchen, hat Prof. Volker Quaschning in seiner Studie "Sektorkopplung durch die Energiewende" untersucht. Die Untersuchung zeigt, dass die aktuellen Anstrengungen der Bundesregierung zum EE-Ausbau und der Sektorkopplung bei weitem nicht ausreichen. Vielmehr wird deutlich, dass die Dekarbonisierung in allen Bereichen vonnöten ist. Um den Klimaschutzverpflichtungen gerecht zu werden, müsse der Umstieg auf erneuerbare Energien um den Faktor 4 - 5 gesteigert werden.
Anlässlich der Publikation der Studie weist Marcel Keiffenheim, BBEn-Aufsichtsrat und Leiter Politik & Kommunikation bei unserem Mitglied Greenpeace Energy eG, auf den enormen Bedarf des Speicher-Ausbaus insbesondere bei Power-to-gas hin: "Um den von Professor Quaschnings Team ermittelten Energiebedarf durch erneuerbare Speicher abzusichern und den nötigen Wasserstoff zu erzeugen, brauchen wir bis 2040 eine Elektrolyseurleistung von mindestens 80 GW. Für einen wirksamen Klimaschutz müssen wir jetzt damit beginnen, diese Kapazitäten aufzubauen."
Bürgerenergie ist der große Verlierer beim Digitalisierungsgesetz
Böse Überraschung kurz vor dem Beschluss im Bundestag: In die Novelle des Gesetzes zur Digitalisierung der Energiewende ist kurz vor der Verabschiedung durch den Bundestag am 23. Juni ein weiterer dicker Brocken für die Energiewende in Bürgerhand hineingewandert. Die große Koalition hat die Grenze, ab der eine Smart-Meter-Pflicht für Erzeugungsanlagen herrscht, von 7 auf 1 kW herabgesetzt. Die Absenkung ist ein schwerer Schlag für die Energiewende von unten, da mit der Smart-Meter-Pflicht für Betreiber von Erzeugungsanlagen die Wirtschaftlichkeit der Anlagen in Frage gestellt wird. Noch gravierender im neuen Digitalisierungsgesetz allerdings ist, dass der Verbleib der Daten, die mithilfe der Smart Meter gewonnen werden, weitgehend ungeklärt ist.
Die Veränderungsdynamik der Energiewende ist immens und beschleunigt sich kontinuierlich. Es geht nicht mehr nur darum, erneuerbare Energien aus der Nische zu holen. Das Ziel ist, ein Energiesystem zu schaffen, in dem wir – über alle Sektoren hinweg – im Jahr 2050 kaum noch CO2 ausstoßen. Die Weichen dafür müssen wir jetzt stellen. Der Klimaschutzplan 2050 hat einen Rahmen vorgegeben, doch die besten Wege zur Zielerreichung müssen erst noch gefunden werden.
Deshalb arbeiten wir seit Anfang 2017 mit mehr als 50 Stakeholdern aus Unternehmen und Verbänden an der Leitstudie Integrierte Energiewende. Über einen Beirat, in dem Vertreter aus Wissenschaft, Politik und Zivilgesellschaft mitwirken, sorgen wir für eine Verankerung unseres Projektes weit über die beteiligten Stakeholder hinaus. Gemeinsam wollen wir in einem branchenübergreifenden Dialog realistische Transformationspfade entwickeln und Handlungsempfehlungen formulieren. In einer ersten Phase haben wir in den Sektoren Energieerzeugung und -verteilung, Gebäude, Industrie und Mobilität gemeinsame Grundlagen erarbeitet und gegenseitige Pfadabhängigkeiten betrachtet. Das vorliegende Zwischenfazit ist ein erster Beitrag zur Debatte, rechtzeitig zu Beginn der neuen Legislaturperiode. In der zweiten Phase wollen wir uns selbst infrage stellen und intensiv verschiedene Sensitivitäten betrachten. Am Ende, Mitte 2018, wird eine konkrete Grundlage für realistische politische Entscheidungen stehen.
Den Begriff integrierte Energiewende haben wir bewusst gewählt. Denn es geht um mehr als nur um eine simple Kopplung von Sektoren. Die Herausforderung besteht darin, die wachsende Zahl an Komponenten aus allen Sektoren aufeinander abzustimmen und in einem intelligenten und nachhaltigen Energiesystem zu integrieren. Jeder Sektor hat eigene Anforderungen, Rahmenbedingungen, Infrastrukturen, Märkte und ein spezifisches Kundenverhalten. Eine effiziente und kostenoptimale Energiewende muss sich mit dem Zusammenspiel dieser unterschiedlichen Struktu-ren auseinandersetzen. Hinzu kommen die Wechselwirkungen mit den Energiemärkten anderer europäischer Länder und das Entstehen eines europäischen Energiebinnenmarkts. Deshalb sprechen wir von der integrierten Energiewende.
Die Leitstudie ist anders als andere Studien zur Energiewende. Wir belassen es nicht bei Szenarien, wie die Welt im Jahr 2050 auszusehen hat, sondern wir beschäftigen uns vor allem mit der Frage nach dem bestmöglichen Weg zur Zielerreichung. Dabei setzen wir gezielt auf die Erfahrungen derjenigen, die die Energiewende in der Praxis umsetzen. Wir wollen mehr Bottom-up denken, weniger Top-down. Wir machen das Mögliche sichtbar und belassen es nicht bei dem Wünschenswerten. Ein komplexes Unterfangen, aber der bisherige Verlauf unseres Dialogs zeigt, dass wir auf einem sehr spannenden und produktiven Weg sind. Alle Beteiligten haben großes Interesse daran, gemeinsam Lösungen zu finden. Alle streben nach klaren, langfristig angelegten Rahmenbedingungen, die kluge Anreize setzen und Freiräume für Innovationen schaffen.
Unser Projekt ist ein Angebot an die Politik. Es gilt, den Klimaschutzplan 2050 mit Leben zu füllen. Wir setzen auf die Bereitschaft, sich mit den realen Gegebenheiten und Herausforderungen auseinandersetzen und dabei die erforderlichen Akteure konstruktiv einzubinden. Unsere bisherigen Ergebnisse zeigen: Vieles ist möglich, auch wenn es anstrengend wird. Die Mühe lohnt sich also.
...
Ausbau erneuerbarer Energien beschleunigen.
Die Erreichung der Klimaziele erfordert in allen im Rahmen der Leitstudie entwickelten Szenarios, insbesondere aber in den Elektrifizierungsszenarios, eine Vervielfachung der installierten Kapazitäten erneuerbarer Energien, allen voran PV und Onshore-Wind. Besonders die verfügbaren Flächen für Windkraftanlagen an Land werden fast vollständig genutzt werden müssen – eine Entlastung der Onshore-Windflächen durch einen signifikanten Ausbau der Offshore-Windenergie ist jedoch möglich.
Um die notwendigen EE-Kapazitäten zu erreichen, muss das in den Jahren 2010 bis 2015 [Anm. J. Gruber: bis die Ausbaukorridore des EEG 2016 diesen beendet hat] erzielte hohe Zubau-Niveau von durchschnittlich 8 GW/a netto bis zum Jahr 2050 nahezu konstant gehalten werden. Dies würde wiederum eine entsprechende Beschleunigung beim Netzausbau erfordern. Bei der Weiterentwicklung der regulatorischen Rahmenbedingungen (z. B. EEG) müssen daher Förder- und CO2-Vermeidungsmechanismen aufeinander abgestimmt werden.
Insbesondere bei Onshore-Wind wird die Akzeptanz der Bevölkerung eine zunehmend wichtige Frage werden, auf die die Politik Antworten finden muss. Die Zwischenergebnisse der Leitstudie prognostizieren Ausbaupfade, bei denen auch Flächen genutzt werden, die mit einer restriktiven "10 h"-Ab- standsregel nicht zu erschließen sind.
Die Erreichung der Klimaziele erfordert bis 2050 deutliche Mehrinvestitionen in die Stromnetze auf Übertragungs- und Verteilnetzebene im Vergleich zum Referenzszenario. Die vorliegenden Zwischenergebnisse prognostizieren kumulier- te Netzausbaukosten im mittleren zweistelligen Milliarden- bereich für das Übertragungsnetz und im unteren dreistelligen Milliardenbereich für das Verteilnetz. Hier entstehen v. a. durch die steigende Nutzung von Elektromobilität und Wärmepumpen Ausbaubedarfe, die teilweise eine Verdopplung der heutigen Leitungskapazitäten erfordern. Dies gilt insbesondere für Netzabschnitte, die bisher nicht durch den von Wind und PV getriebenen Netzausbau betroffen waren. Die aktuellen Ergebnisse zeigen, dass die bisher für den Zeithorizont 2030 bzw. 2035 identifizierten Ausbaumaßnahmen nur einen Zwischenschritt darstellen und bis zum Jahr 2050 ein erheblicher zusätzlicher Netzausbau notwendig ist. Damit droht sich das Akzeptanzproblem für den Netzausbau auf Höchst- und Hochspannungsebene weiter zu verschärfen, was die Erreichung der Energiewendeziele grundlegend gefährden könnte.
Die bestehenden Ausbau-, Umbau- und Verstärkungsmaßnahmen müssen beschleunigt werden. Hierzu gehört das kontinuierliche Werben bei der Bevölkerung für die Notwendigkeit des Netzausbaus, wie auch die Beschleunigung von Genehmigungsverfahren. Insbesondere Umbauund Verstärkungsmaßnahmen, die keinen Neubau erfordern, sollten schneller und nach bundeseinheitlichen Vorgaben genehmigt werden können. Auch sollten intelligente Lösungen zur besseren Netzauslastung und netzdienlichen Nutzung von Flexibilitäten weiter vorangetrieben werden. Auf Ebene der Übertragungsnetze ist zu prüfen, wie durch einen höheren Automatisierungsgrad bei der Systemführung zusätzliche Potenziale in der Netzauslastung erschlossen werden können.
Im Verteilnetz muss ebenfalls der Automatisierungsgrad bei der Netzführung erhöht werden, um Flexibilitätspotenziale zu erschließen und netzdienlich zu nutzen. Hierfür müssen die Verteilnetze (insbesondere die unteren Spannungsebenen) modernisiert werden. Insbesondere neue, flexible Verbraucher (Elektrofahrzeuge, Wärmepumpen) können intelligent und netzdienlich genutzt werden. Der sich durch die Digitalisierung ergebende Informationsgewinn hilft, örtliche Einspeisungen und flexible Verbraucher dynamisch zu optimieren. Voraussetzung ist ein geeigneter regulatorischer Rahmen. Eine Dynamisierung fester Kostenbestandteile (z. B. Netzentgelte) ist ebenso zu diskutieren, wie die Beseitigung der Benachteiligung von Lösungen mit hohen betrieblichen Kosten (OPEX) im Vergleich zu Lösungen mit hohen Investitionskosten (CAPEX) im Rahmen der Anreizregulierung.
Beim Pariser Klimagipfel wurde beschlossen, die globale Erwärmung möglichst auf 1.5 Grad Celsius zu begrenzen, um die Folgen des Klimawandels noch in einem vertretbaren Ausmaß zu halten. Dazu ist eine Reduktion des energiebedingten Kohlendioxidausstoßes gegen 2040 auf null erforderlich. Danach darf kein fossiles Erdgas, Erdöl und keine Kohle mehr genutzt werden oder das zu viel emittierte Kohlendioxid muss mit aufwändigen und kostenintensiven CCS-Verfahren wieder der Atmosphäre entzogen und endgelagert werden. Die Energieversorgung in den Sektoren Strom, Wärme und Verkehr sollte daher bis 2040 vollständig mit erneuerbaren Energien gedeckt werden.
Die Potenziale für Biomasse, Geothermie und Solarthermie sind in Deutschland begrenzt. Darum muss der wesentliche Anteil der künftigen Energieversorgung durch Strom aus Windkraft und Photovoltaik gedeckt werden. Bei gleichbleibenden Verhaltens- und Konsummustern steigt dadurch der Stromverbrauch von derzeit rund 600 TWh auf gut 1300 TWh an. Voraussetzung sind ambitionierte Effizienzmaßnahmen. Der motorisierte Straßenverkehr muss fast vollständig elektrifiziert werden. Gegen 2050 müssen dafür die Produktion von Fahrzeugen mit Benzin- und Dieselmotoren eingestellt und für den Güterverkehr wichtige Fernstraßen mit Oberleitungen versehen werden. Im Wärmebereich dürfen ab dem Jahr 2020 keine neuen Gas- oder Ölheizungen sowie KWK-Anlagen installiert werden. Aus Effizienzgründen wird künftig der überwiegende Anteil der Raumwärme durch Wärmepumpen gedeckt.
Werden die Effizienzmaßnahmen nicht umgesetzt, steigt der Strombedarf auf bis zu 3000 TWh/a an. Diese Strommenge in absehbarer Zeit klimaneutral zu decken ist unrealistisch. Selbst für einen Strombedarf von 1300 TWh muss das Ausbautempo von Solar- und Windkraftanlagen deutlich steigen.
Bei der Onshore-Windkraft liegt der empfohlene jährliche Nettozubau bei 6.3 GW/a,
200 GW auf Freiflächen = 1000 km^2 bei 20% Modulwirkungsgrad
landwirtschaftliche Flächen: 182 000 km^2
Wind:
76 GW offshore
200 GW onshore (installiert 53 GW, Stand: Ende 2018)
Das Ziel der Bundesregierung ist, bis 2030 rund 67 bis 71 GW onshore zu installieren.
Insgesamt beträgt das theoretische Leistungspotenzial der potenziell nutzbaren Flächen bis 2030 rund 81 GW.
Quelle: Geplante Abstandsregeln für Windräder gefährden Klimaziele, Umweltbundesamt, 20.11.2019 (mehr)
Zur kosteneffizienten Integration dieser erneuerbaren Kraftwerksleistungen muss ein Kohleausstieg bis spätestens 2030 erfolgen.
Mit den heutigen Zielvorgaben aus dem Erneuerbare-Energien-Gesetz besteht keinerlei Möglichkeit, die Pariser Klimaschutzziele zu erreichen. Das ist den politischen Verantwortlichen entweder nicht bewusst oder sie nehmen ein Verletzen der Klimaschutzverpflichtungen bewusst in Kauf oder setzen auf eine nachträgliche Korrektur durch CCS-Technologien. Da keine dieser Optionen gesellschaftlich tragbar ist, sind schnelle und einschneidende Korrekturen der Energiepolitik dringend erforderlich.
Schlussfolgerungen der Studie
Für einen erfolgreichen Klimaschutz müssen die Sektoren Strom, Wärme und Verkehr bis zum Jahr 2040 vollständig dekarbonisiert werden.
Kohlekraftwerke zählen zu den größten Verursachern von Kohlendioxidemissionen. Der Kohleausstieg sollte daher spätestens 2030 abgeschlossen sein. Hierfür ist auch die schnelle Errichtung von Speichern erforderlich.
Mit der jetzigen Energiepolitik und den Zubaukorridoren für den Ausbau der regenerativen Stromerzeugung im EEG können regernative Energien bis zum Jahr 2040 nur bis zu 35 % des erforderlichen Bedarfs decken. Das Einhalten der Pariser Klimaschutzvereinbarungen ist damit absolut unmöglich.
Künftig wird auch ein großer Teil des Energiebedarfs in den Sektoren Wärme und Transport durch elektrischen Strom aus Solar- und Windkraftanlagen gedeckt werden müssen. Dadurch steigt der Stromverbrauch von derzeit 628 TWh auf mindestens 1320 TWh.
Werden keine ambitionierten Effizienzmaßnahmen umgesetzt, kann sich der Strombedarf verfünffachen und auf über 3000 TWh ansteigen. Dieser Bedarf lässt sich bis 2040 nicht durch erneuerbare Energien in Deutschland decken.
Aus Effizienzgründen scheiden künftig Fahrzeuge mit Verbrennungsmotoren sowie Gasheizungen und KWK-Anlagen aus.
Möglichst ab 2025, spätestens aber ab 2030, sollten daher in Deutschland keine Neufahrzeuge mit Verbrennungsmotoren mehr zugelassen werden. Die wichtigsten Fernstraßen sind mit elektrischen Oberleitungen zu versehen.
Gas-Brennwertkessel und KWK-Anlagen dürfen ab dem Jahr 2020 nicht mehr neu gebaut werden. Stattdessen müssen effiziente Wärmepumpen die Gebäudewärmeversorgung und Warmwasserbereitung weitgehend übernehmen.
Durch Gebäudesanierung sollte der Wärmebedarf der Gebäude in den nächsten 25 Jahren möglichst um 30 bis 50 Prozent gesenkt werden.
Für die regenerative Stromerzeugung wird für das Jahr 2040
für Onshore-Windkraft eine installierte Leistung von 200 GW,
für die Offshore-Windkraft von 76 GW und
für die Photovoltaik von 400 GW empfohlen.
Der erforderliche Nettozubau beträgt für die Onshore-Windkraft 6.3 GW, für die Offshore-Windkraft 2.9 GW und für die Photovoltaik 15 GW pro Jahr.
Voller Verzweiflung schauen viele Macher der erfolgreichen deutschen Energiewende derzeit nach Berlin. Viele Mittelständler, Kommunale und Bürger sind fassungslos: Warum hilft gerade die SPD-Bundestagsfraktion der CDU/CSU, das Erneuerbare-Energien-Gesetz (EEG) faktisch abzuschaffen? Obwohl der Koalitionsvertrag, abgesegnet vom SPD-Mitgliederentscheid, eine Ersetzung des bewährten EEG durch Ausschreibungen gar nicht in dieser Regierungszeit vorsieht. Viele erinnern sich noch daran, dass die SPD das EEG 1998 als erste Partei im Schröder-Wahlprogramm gefordert und mit den Grünen in 2000 durchgesetzt hat. Trotz heftiger innerparteilicher Gegenwehr, die von den Leitmedien ignoriert wird, zeichnet sich nach der ersten Lesung im Bundestag ab: Die Mehrzahl der SPD-Abgeordneten wird wohl oder übel Energieminister Gabriel folgen.
... Die Gesamtberatungsdauer in Bundestag und Bundesrat beträgt gerade einmal ein Monat. Sage und schreibe innerhalb einer Woche, der ersten Juli-Woche 2016, sollen folgende wichtige Schritte der Gesetzgebung durchgezogen werden:
Sachverständigenanhörung
Beratung im Wirtschaftsausschuss des Bundestags
zweite und dritte Lesung des EEG 2016 an einem Tag im Bundestag
Befassung des Bundesrats
Wie Hinweise und Kritik von Sachverständigen in der Gesetzgebung berücksichtigt werden sollen, bleibt ein Rätsel.
Die Forderung des Bundesrats zur Einführung der von der EU-Kommission gebilligten Ausnahme von Ausschreibungen für kleine Windparks (die sogenannte De-Minimis-Regelung) würde endlich ins Scheinwerferlicht der Öffentlichkeit geraten. Es wäre ein starkes Signal. Die Grünen würden um das Schlüsselgesetz der Energiewende kämpfen. Endlich bekämen wir die nötige nationale Debatte um das Gemeinschaftswerk Energiewende, wie sie von der Energiewende-Kommission 2011 unter Vorsitz von Klaus Töpfer gefordert wurde. Derzeit wird das Gemeinschaftswerk Energiewende im Eilverfahren abgewickelt. Es kann nur gelingen, wenn sich Viele an der Energiewende beteiligen. Ausschreibungen schneiden den Stromsektor wieder auf wenige Große zu. Mittelstand, Kommunen und Bürger sollen künftig draußen bleiben. Es würde sich für die Grünen lohnen, um dieses Gemeinschaftswerk zu kämpfen. Sie hätten die Chance, das EEG zu ihrer Sache zu machen statt – wie die Große Koalition – dem Druck der Lobby der Energiekonzerne und der Besitzstandswahrer in der alten Industrie zu folgen.
Konsequenzen:
Das Szenario – kein Abschluss des Gesetzgebungsverfahrens vor der Sommerpause – fürchtet die Bundesregierung, weil sich eine öffentliche Debatte wegen der zahlreichen fehlerhaften Annahmen für das EEG 2016, zum Beispiel über vermeintliche Netzengpässe, entwickeln könnte. Wenn der Bundesrat der Bundesregierung die Option einer Vertagung des Abschlusses des Gesetzgebungsverfahrens öffentlich klar macht, bestünde ein größerer Verhandlungsspielraum zur Durchsetzung wichtiger Forderungen, zum Beispiel zur Einhaltung des Koalitionsvertrags (keine Ausschreibungen vor 2018 oder wenigstens die von der EU zugelassene De-Minimis-Regelung für kleine Windparks: 18 Megawatt ausschreibungsfrei); siehe dazu die Empfehlung der Ausschüsse des Bundesrats (BR-Drs. 310/1/16).
Grünkorn, Nehls, G., von Rönn, J., (BioConsult),
Reichenbach, M., Timmermann, H. & Weitekamp, S. (ARSU GmbH),
T., Blew, J., Coppack , T. (IfAÖ),
Krüger, O., Potiek, A. (Lehrstuhl für Verhaltenforschung, Uni Bielefeld),
2014
Unter den 11 häufigeren Kollisionsopfern entfallen nach Schätzung 71 % der Kollisionsopfer auf nur 5 Arten/Artengruppen:
Feldlerche,
Star,
Stockente,
Möwen und
Ringeltaube.
Es ist bemerkenswert, dass auf diese Arten in der zentralen Fundopferdatei der Vogelschutzwarte Brandenburg nur 28 % entfallen.
Greifvögel, die in der zentralen Fundopferdatei mit 35 % vertreten sind, erreichen nach den PROGRESS-Daten nur 11 %.
Dies verdeutlicht die Notwendigkeit für systematische Untersuchungen unter Berücksichtigung von Untersuchungsaufwand und Erfassungsfehlern. Bei Zufallsfunden und unsystematischen Kontrollen erfolgt automatisch eine Gewichtung zu auffälligen Arten und zu Arten, bei denen die Meldebereitschaft aufgrund des öffentlichen Interesses höher ist. Dies erschwert eine Bewertung der tatsächlichen Betroffenheit der verschiedenen Arten.
In Übereinstimmung mit den begleitenden Sichtbeobachtungen entfällt der größte Teil der Kollisionen auf die häufigen und ungefährdeten Arten der Agrarlandschaft, die sich in den Windparks (WP) selbst aufhalten und dort auch zur Nahrungssuche gehen. Das Kollisionsrisiko ist dabei artspezifisch, wobei eine hohe Übereinstimmung verwandter Arten zu bestehen scheint. Dies erlaubt zumindest in Grenzen eine Übertragung der Einschätzung des Kollisionsrisikos auf Arten, von denen bislang wenige Daten vorliegen.
Die Arten der häufigeren Kollisionsopfer, wie auch Greifvögel, wurden überproportional häufig im Nahbereich von WEA festgestellt und zeigten kaum erkennbare Ausweichreaktionen.
Bei Gänsen und Kranichen konnte dagegen sowohl eine Meidung der WP wie auch deutliches Ausweichverhalten beobachtet werden.
In den Funden der Kollisionsopfer sind nachts ziehende Arten deutlich unterrepräsentiert und eine Gefährdung von Arten des millionenfachen nächtlichen Breitfrontenzuges nordischer Singvögel durch WEA kann ausgeschlossen werden.
In Anbetracht des hohen Untersuchungsaufwands ist davon auszugehen, dass solche Arten, die häufig im Untersuchungsraum vorkommen, aber nicht oder nur in geringen Anzahlen als Kollisionsopfer erfasst wurden, auch nicht wesentlich vom bisherigen Ausbau der Windenergienutzung im Norddeutschen Tiefland betroffen sind.
Für seltenere Arten ist dieser Rückschluss jedoch nicht zulässig, da die Repräsentativität der Untersuchungen hier an ihre Grenzen kommt.
The Yasuni Ishpingo Tambococha Tiputini Trust Fund (Yasuni ITT Trust Fund) is established for receipt of contributions from supporters of Ecuador’s historical decision to permanently forego the extraction of the Yasuni ITT oil fields (about 846 million barrels). The contributions will finance renewable energy and sustainable development investments such as avoidance of deforestation and conservation of ecosystems.
Through this unique initiative, Ecuador is addressing the challenges of climate change and sustainable development and gradually change its energy matrix from fossil fuel to renewable energy sources. The Yasuni initiative will avoid the emission of 407 million metric tons of Carbon Dioxide (CO2) by forgoing extraction and burning of fossil fuels, protect one of the most bio-diverse regions of the world and maintain the livelihoods of the area's indigenous people. In addition, it will lead to savings of 800 million metric tons of CO2 from avoided deforestation and reforestation it will promote nationally.
In the spirit of co-responsibility, Ecuador is requesting the world community to contribute 50 percent of the income it is forgoing, amounting to US$ 3.6 billion (over a 13 year period), with the balance being the contribution of the people of Ecuador to global goods.
The Yasuni ITT Trust Fund, is administered by the Multi-Partner Trust Fund Office (MPTF Office) of the United Nations Development Programme (UNDP).
Hintergrund der Yasuni-Initiative
Unterstützung
Das Projekt wurde öffentlich von verschiedenen international anerkannten Persönlichkeiten unterstützt, u.a. Desmond Tutu, Rigoberta Menchú, Jody Williams und Muhammad Yunus, Friedensnobelpreisträger; Rita Levi Montalcini, Nobelpreisträgerin in Physiologie und Medizin; des ehemaligen Staatspräsidenten Michail Gorbatschow (ehem. UdSSR), Felipe González (Spanien), Fernando Henrique Cardoso (Brasilien), Ricardo Lagos (Chile); Prinz Charles (Großbritannien) und Danielle Mitterrand (Leiterin der Stiftung France Libertés). Außerdem hat der Deutsche Bundestag die Initiative förmlich – mit der einstimmigen Unterstützung aller dort vertretenen Parteien – gutgeheißen; ebenso die Europäische Union und andere internationale Organisationen wie u.a. das Umweltprogramm der Vereinten Nationen (UNEP), die Organisation erdölexportierender Länder (OPEC), die Andengemeinschaft (CAN), die Andean Development Corporation (CAF), die Organisation Amerikanischer Staaten (OAS) sowie zivilgesellschaftliche Organisationen wie die International Union for Conservation of Nature (IUCN).
Scheitern der Initiative
Am 16. August 2013 verkündete Ecuadors Präsident Rafael Correa in einer Fernsehansprache, dass die ITT-Blöcke für Ölbohrungen freigegeben werden. Er begründete dies mit dem Scheitern der internationalen Gemeinschaft, die erwarteten finanziellen Mittel bereitzustellen. Zum Zeitpunkt der Verkündung seien nur etwa 335 Millionen Dollar zugesagt und lediglich 13,3 Millionen tatsächlich eingezahlt worden. Die eingezahlten Beiträge sollen nun zurückgezahlt werden.[1] Anfang Oktober 2013 stimmte das Parlament mit 108 gegen 25 Stimmen dem Regierungsvorschlag zu, die Ölbohrungen unter Auflagen zu erlauben.
Nachdem das deutsche Bundesministerium für wirtschaftliche Zusammenarbeit und Entwicklung unter Heidemarie Wieczorek-Zeul bis 2009 das Projekt noch öffentlich unterstützt hatte und auch eine finanzielle Beteiligung in Aussicht gestellt hatte, wurde dieser Unterstützung 2010 unter dem neuen Entwicklungsminister Dirk Niebel offiziell eine Absage erteilt.
Auch Atomkraftwerke müssen für ihren Brennstoff Steuern zahlen – die sogenannte Brennelemente-Steuer. CDU und CSU aber wollen diese Steuer Ende 2016 abschaffen. Damit würden sie den AKW-Betreibern mehr als 5 Milliarden Euro schenken.
Was ist die Brennelemente-Steuer?
Eine Steuer auf den Brennstoff für Atomkraftwerke, auch Kernbrennstoffsteuer genannt. Pro Gramm Uran oder Plutonium, die in einem AKW zum Einsatz kommen, sind derzeit 145 Euro fällig.
Wie begründete die damalige schwarz-gelbe Regierungskoalition die Steuer bei der Einführung? Der CDU/CSU-Redner im Bundestag nannte folgende Argumente:
"Die Kernenergie ist eben nicht vom CO2- Emissionshandel betroffen und somit gegenüber anderen Energieträgern bevorzugt."
"..., weil gerade die Kosten für Endlagerung und für den Rückbau der Kernkraftwerke im Wesentlichen vom Steuerzahler in Deutschland getragen werden."
"..., weil der Strommarkt mehr Chancengleichheit braucht und gerade die großen vier nationalen Stromversorger hier einen Wettbewerbsvorteil gegenüber vielen kleinen und mittelständischen Stromanbietern haben."
Von einer "Steuer" zu sprechen, sei dabei eigentlich "irreführend", erläuterte der CDUler: "Es handelt sich im Wesentlichen (...) um einen Subventionsabbau." Ziel sei, "die direkte Bevorzugung der Kernenergiewirtschaft" zu beenden.
Kirsten Hasberg of Denmark is the Founder and CEO of Energy Democracy TV and has been passionate about renewable energy since she was 14 years old.
In April of 2013, Kirsten quit her job in Germany as manager of the European Project on 100% Renewable Energy Communities in order to launch Energy Democracy TV.
Kirsten is strongly inspired by Dr. Hermann Scheer, the father of the German Renewable Energy Act (Erneuerbare-Energien-Gesetz, EEG). And she was fortunate enough to work for Dr. Scheer as well.
Kirsten has also worked with the pioneers of the Danish renewable energy movement at the Nordic Folkecenter for Renewable Energy in Denmark, and has additionally served as an energy policy advisor to members of the Danish Parliament.
Other professional positions Kirsten has held includes work for the Danish Transmission System Operator (TSO) and Risø DTU, the Danish National Laboratory for Sustainable Energy. Kirsten has been a lecturer at universities in Kassel, Germany, and Copenhagen, Denmark, and she holds a master's degree in economics from the University of Copenhagen. She also writes satirical cabaret songs about the renewable energy transition in both German and English--and has also written the Crowdfunding Song for the Energy Democracy TV campaign.
Please watch the pitch video where Kirsten explains why Energy Democracy TV is essential to making the energy revolution happen. For after all, we must all be the renewable energy we want to see!
Ein neues Geschäftsmodell sieht Kirsten Hasberg von der Initiative Blockchain-Hub Berlin in der Idee, jedem den direkten Kauf und Verkauf von Strom ohne Mittelsmann zu ermöglichen. Für eine weiträumige Einführung der Blockchain-Technologie sind die rechtlichen und regulatorischen Unklarheiten allerdings noch zu groß.
"Blockchain liefert einen wichtigen Baustein für die dezentrale Energiewende. Datentechnologie baut auf eine zentrale Serverstruktur auf. Blockchain ist das genaue Gegenteil, mit ihr gelingt eine Dezentralisierung der Dateninfrastruktur.
Energieversorger verwalten zumeist Verträge, organisieren also Einkauf und Verkauf. "
"Mit Blockchain kann man diese Verträge als sogenannte Smart Contracts abbilden.
Transaktionsdaten werden in einer langen Kette von Datenblöcken auf Millionen am System teilnehmenden Computern dezentral und sicher gespeichert und verschlüsselt.
So werden Zwischenhändler überflüssig – ein Stromhandel ohne Mittelsmann.
Dabei wird ein Vertrag zwischen Stromverbraucher und Stromerzeuger geschlossen, der automatisch ausgeführt wird, wenn alle vereinbarten Bedingungen erfüllt sind.
Viele der Funktionen, die eigentlich der Energieversorger als dritte Partei übernimmt, erfolgen über Blockchain.
Auch die Verifizierung des Vorgangs."
"Eine Überlegung ist, einen dezentralen Stromhandel – praktisch von Maschine zu Maschine – abzubilden, der nicht über den zentralen Strommarkt läuft. Vereinfacht gesagt: Eine Photovoltaikanlage verkauft Strom an einen Toaster. Und zwar nicht im selben Haushalt, sondern an verschiedenen Orten. Diese sogenannten Mikrotransaktionen sind heute weder möglich noch wirtschaftlich." ...
... So ist theoretisch etwa ein Markt der Energieerzeugung und -belieferung darstellbar, in dem die Rolle der Energieversorger als Zwischenhändler überflüssig wird. Verbraucher könnten Strom und Wärme über automatisierte Prozesse, so genannte Smart Contracts, direkt bei den Energieerzeugern beziehen. Umgekehrt könnten Prosumer selbst erzeugte Energie direkt an andere Verbraucher vermarkten. Und auch bei der Netzsteuerung oder bei Abrechnungsprozessen könnte die Blockchain Vorteile gegenüber den aktuellen Verfahren haben.
Eine von der Verbraucherzentrale NRW beauftragte Bestandsaufnahme (Cache) zum Potential der Blockchain im Eneergiebereich zeigt, dass über den Energiekauf und -verkauf hinaus zum Beispiel bei Ablese- und Abrechnungsprozessen, der Dokumentation von Eigentumsverhältnissen und Anlagenzuständen sowie Herkunftsnachweisen, CO2- und Ökostromzertifikaten Blockchains sinnvoll eingesetzt werden können. Der klassische Strom-, Gas- und Fernwärmevertrieb und der Handel erneuerbarer Energie, die Elektromobilität, Transaktionen rund um die Netze und Messdienstleistungen sowie Ablese- und Abrechnungsverfahren könnten in Teilen oder vollständig über eine Blockchain abgebildet werden.
Man ist Mitglied in der deutschlandweiten SonnenCommunity, die sich erneuerbaren Strom teilt und -in den ganz wenigen Ausnahmefällen von deutschlandweiter Wind-, PV- und Biogasflaute- Strom auf dem Strommarkt nachkauft. Damit ist man vom lokalen Stromanbieter unabhängig und beweist, wie weit 100% erneuerbarer Strom möglich ist.
"With a sonnenBatterie and a photovoltaic system you'll completely cover your own energy needs on sunny days –
often even generating a surplus. This surplus is not fed into
the conventional power grid, but into a virtual energy pool that serves other members in times when they can not produce enough energy due to bad weather. A central software links up and monitors all sonnenCommunity members - while balancing energy supply and demand. As a sonnenCommunity member you don't need your conventional energy provider anymore - you are independent. From now on you supply yourself with renewable energy that is generated decentralized: you are part of the energy future!"
That's what you get with the sonnenCommunity
Starting now you may join the sonnenCommunity for a monthly membership fee of just 19.99 Euro. But you won't be paying the monthly basic charge to your old energy provider anymore. And you'll be able to take advantage of the following sonnenCommunity benefits:
1,875 € (gross) CommunityDiscount when purchasing a sonnenBatterie.
10 years guarantee on your sonnenBatterie.
Energy from 23 Cent
Extensive software updates for all existing functions.
Free weather forecast updates.
Free energy usage optimisation to match weather predictions for your home location.
Swantje Gährs, Bernd Hirschl, Astrid Aretz, Institut für ökologische Wirtschaftsforschung (IÖW) GmbH, Kurzstudie im Auftrag vom Bundesverband Neue Energiewirtschaft e.V. (bne), 2016
(im Cache)
Eine Erweiterung der EEG-Umlagebasis könnte für die nötige Ausweitung der Energiewende einen wichtigen Impuls geben. Die Energiewende stirbt im Heizungskeller, wenn dem Einzelnen nicht klar wird, dass die Integration von erneuerbaren Energien in sein Heizkonzept der richtige Weg ist. Jede Entscheidung für eine rein fossile Heizung zementiert Emissionen für 20 bis 30 Jahre. Die Bundesregierung hat sich mit der Ratifizierung des Klimaabkommens von Paris zur Emissionsreduktion verpflichtet. Nun geht es darum, das Umlage- und Ablagesystem im Energiebereich danach auszurichten.
Zum Hintergrund: Der Klimaschutzplan 2050 der Bundesregierung sieht vor, die Anreiz- und Lenkungswirkung bestehender Energiepreisbestandteile in Form von Abgaben, Umlagen und Steuern bis Mitte 2017 zu überprüfen.
Vier Varianten eines geänderter Verteilunsmechanismus der EEG-Umlage sehen eine Erweiterung der Basis für die EEG-Umlage vor. Zur Berechnung der EEG-Umlage wird nicht mehr nur der Stromverbrauch zu Grunde gelegt wird, sondern auch der Endenergieverbrauch im Wärme- und Verkehrssektor. Dies führt zu einer Umverteilung der EEG-Umlage zwischen den Sektoren, so dass einerseits die Umlage auf den Stromverbrauch sinken, gleichzeitig der Wärme- und Kraftstoffverbrauch mit einer zusätzlichen Umlage belastet würde. Die Intention dabei ist, eine zusätzliche ökologische Lenkungswirkung zu Lasten fossiler Energieträger in den Energiesektoren zu erhalten und damit eine Kopplung der Sektoren Strom, Wärme und Mobilität zu ermöglichen.
Jede der Varianten reduziert die EEG-Umlage auf den Strom auf weniger als die Hälfte im Vergleich zum Status Quo. Die zu erwartende EEG-Umlage für Strom läge dann zwischen 1,32 und 2,8 ct/kWh. Die Energieträger im Wärmebereich wären dagegen mit einer EEG-Umlage belastet. Bei Gas würde diese zwischen 0,62 und 1,32 ct/kWh liegen, für Öl zwischen 0,8 und 1,69 ct/kWh und für Kohle zwischen 1,09 und 2,32 ct/kWh.
Jährliche Energiekosten für einen durchschnittlichen Haushalten mit Strom-, Gas- und Benzinverbrauch Die Prozentangaben beziehen sie auf die Erhöhung der Gesamtkosten gegenüber den Status Quo.
"The rare earth elements (REE) are elements that drive the development of new technologies in many sectors, including green energy. However, the supply chain of the REE is subject to a complex set of technical, environmental, and geopolitical constraints. Some of these challenges may be circumvented if the REE are recovered from naturally abundant alternative sources, such as saline waters and brines. ..."
by Emily J. Gertz, Oct. 22 2016
High mountain ice has retreated dramatically in the Andes and could be nearly gone by the end of the century. Glaciers in the Bolivian Andes have shrunk 43 percent since 1986 as a result of rising global temperatures ... Glaciers worldwide store about 70 percent of the world’s freshwater.
Zentrale Voraussetzung für die Dekarbonisierung der Energiewirtschaft ist, dass die Bundesregierung noch in dieser Legislaturperiode einen gesetzlich verankerten Kohleausstieg auf den Weg bringt. Ein solcher Kohleausstieg muss jetzt eingeleitet und bis spätestens 2035 abgeschlossen werden, wobei ein Großteil der Kohlekraftwerke schon deutlich früher vom Netz gehen muss. Die Bundesregierung muss dazu einen eigenständigen Minderungspfad für den Stromsektor mit einem Abbaupfad für Kohlestrom festlegen, der den genannten Klimazielen entspricht. Durch eine langfristige, sozial verträgliche Planung und staatliche Unterstützung der Kohleregionen kann der Übergang zu einer zukunftsweisenden, klimage- rechten Wirtschaftsstruktur gestaltet werden.
Am 14. November hat das Bundeskabinett den Klimaschutzplan 2050 beschlossen. Es ist das erste Regierungsdokument, das den Weg in ein weitgehend treibhausgasneutrales Deutschland im Jahr 2050 aufzeigt. Der Plan enthält erstmals Klimaziele für einzelne Wirtschaftszweige und gibt so eine konkrete Orientierung für strategische Entscheidungen in den nächsten Jahren.
Das BMUB hatte am 6. September 2016 die Ressortabstimmung für den Hausentwurf des Klimaschutzplans 2050 eingeleitet. Direkt im Anschluss wurden die Bundestagsfraktionen informiert, zudem wurden Bundesländer und Verbände um Stellungnahme gebeten. Für Verbände fand zudem am 27. September 2016 eine Anhörung in Berlin statt.
Da der Klimaschutzplan 2050 kein Gesetz ist, ist eine Anhörung nicht verpflichtet. Damit aber die langfristig angelegte Strategie in Gesellschaft und Wirtschaft auf Akzeptanz stößt, achtet die Bundesregierung schon von Beginn an auf breite Beteiligung und Transparenz. Bereits im Sommer 2015 hat sie einen breit angelegten Beteiligungsprozess gestartet. Bundesländer, Kommunen und Verbände sowie Bürgerinnen und Bürger waren aufgefordert, der Bundesregierung strategische Maßnahmen vorzuschlagen, mit denen die langfristigen Klimaziele erreicht werden. Weitere Informationen zum Beteiligungsprozess sind auf www.klimaschutzplan2050.de zu finden. Quelle)
Antwort: Die Klimaschutzziele können nur erreicht werden, wenn die Kohleverstromung schrittweise verringert wird. Das geht aus dem Klimaschutzplan hervor. Die Reduzierung der Kohleverstromung soll so gestaltet werden, dass Strukturbrüche in den betroffenen Regionen, insbesondere den Braunkohlerevieren in Nordrhein-Westfalen, in der Lausitz und im mitteldeutschen Revier, vermieden und für diese Regionen neue industriepolitische Perspektiven entwickelt werden.
Dazu braucht es einen Dialog mit den beteiligten Akteuren aus Ländern, Kommunen, Gewerkschaften, Vertretern betroffener Unternehmen und Branchen sowie regionalen Akteuren. Der Klimaschutzplan 2050 sieht in diesem Sinne die Einberufung einer Kommission "Wachstum, Strukturwandel und Regionalentwicklung" vor.
Klimaschutz im Stromsektor 2030 – Vergleich von Instrumenten zur Emissionsminderung - Endbericht
H. Hermann, Ch. Loreck, D. Ritter, B. Greiner, F. Keimeyer, V Cook (Öko-Institut, Berlin),
N. Bartelt, M. Bittner, D. Nailis (Büro für Energiewirtschaft und technische Planung GmbH, Aachen),
Prof. Dr. Stefan Klinski (Wirtschaftsrecht, insbesondere Umweltrecht, Hochschule für Wirtschaft und Recht Berlin (HWR)),
im Auftrag des Umweltbundesamts, Climate Change / 02/2017, Januar 2017 (im Cache)
Das Ziel im Klimaschutzplan 2050 der Bundesregierung ist eindeutig: Bis 2030 muss die Energiewirtschaft ihre Treibhausgasemissionen gegenüber 2014 um die Hälfte senken. Dazu muss 2030 aber deutlich weniger als die Hälfte an Kohlestrom produziert werden, so eine neue Studie.
Die Studie hat unterschiedliche Wege untersucht, wie das erreicht werden könnte – von Preisaufschlag auf fossile Brennstoffe wie Kohle bis hin zu Restlaufzeiten für Kohlekraftwerke. "Alle Vorschläge lassen sich national umsetzen, müssen aber durch eine Verschärfung des europäischen Emissionshandels flankiert werden. Die Strompreiserhöhungen fallen moderat aus. Maximal 0,2 Cent pro Kilowattstunde (kWh) würden die Großhandelspreise steigen", so UBA-Präsidentin Maria Krautzberger.
Der Gesetzgeber könnte aus den folgenden vier Optionen auswählen. Alle untersuchten Instrumente führen auch dazu, dass neben den deutschen Emissionen der deutsche Exportüberschuss beim Strom bis 2030 zurückgeht:
Option 1: Braun- und Steinkohlekraftwerke, die im Jahr 2030 40 Jahre oder älter sind, werden nach und nach stillgelegt: Im Jahr 2030 reduziert sich die installierte Leistung der Braunkohlekraftwerke um 55 Prozent und die der Steinkohlekraftwerke um etwa 60 Prozent gegenüber 2015.
Option 2: Allein Braunkohlekraftwerke werden als CO2-intensivste Form der Strom- und Wärmeerzeugung nach und nach stillgelegt: Bis 2030 reduziert sich die installierte Leistung der Braunkohlekraftwerke um circa 75 Prozent gegenüber dem Jahr 2015.
Option 3: Jede Tonne CO2 aus mit fossilen Brennstoffen befeuerten Kraftwerken wird national um 10 Euro/Tonne verteuert, etwa durch einen CO2-Preisaufschlag über Brennstoffsteuern in der Stromerzeugung.
Option 4: Die Volllaststunden der Braun- und Steinkohle-kraftwerke werden bis 2030 auf höchstens 4.000 Stunden begrenzt.
Mit allen vier Optionen ließe sich das Klimaziel für die Energiewirtschaft erreichen.
Ein laut der UBA-Studie insgesamt robuster Weg wäre die Stilllegung von Braun- und Steinkohlekraftwerken (Option 1 oder 2), er erreicht auch eine hohe europäische Emissionsminderung.
Die nationale Brennstoffsteuer (Option 3) reduziert die Stromerzeugung aus Erdgas- und Steinkohlekraftwerken in Deutschland am stärksten und wäre mit Blick auf die Strom-Erzeugungskosten in den Kraftwerken das kostengünstigste Instrument.
Die Kraftwerksstilllegungen und die Begrenzung der Volllaststunden (Option 4) mindern vor allem den CO2-Ausstoß der Braunkohlekraftwerke.
Mit dem Rückgang des deutschen Exportüberschusses beim Strom bis 2030 könnten insbesondere Gas-Kraftwerke außerhalb Deutschlands stärker ausgelastet werden. Dies würde auch zu CO2-Minderungen außerhalb Deutschlands führen, da die Produktion von Gaskraftwerken übernommen würde, die weniger CO2 ausstoßen als Kohlekraftwerke. Die in den Optionen 1 und 2 vorgeschlagene direkte Minderung der Braunkohle¬verstromung hätten jedoch den Vorteil, dass sie im Gegensatz zu den Optionen 3 und 4 besser sicherstellen können, dass die Emissionen nicht nur in andere EU-Staaten verlagert werden.
Durch den deutschen Kohleausstieg bleiben CO2-Zertifikate auf den dem europäischen CO2-Markt ungenutzt. Damit es zu keinem Überangebot an ungenutzten CO2-Zertifikaten kommt, sollten die Mitgliedstaaten entsprechende Mengen bei den Versteigerungen kürzen und endgültig löschen dürfen. Der deutsche Kohleausstieg würde damit europakompatibel gemacht.. Mittel- bis langfristig müssten die niedrigeren CO2-Emissionen aus Deutschland aber eine Verringerung der im europäischen Emissionshandel zulässigen Gesamtmenge an europäischen CO2-Zertifikaten nach sich ziehen und das Cap für den CO2-Ausstoß abgesenkt werden.
Die in der Studie untersuchten Instrumente wirken sich unterschiedlich auf die wirtschaftliche Situation der einzelnen Kraftwerke aus: Wenn wie bei Option 1 und 2 einzelne Kohlekraftwerke aus dem Markt genommen werden, steigern die leicht höheren Strompreise den Gewinn der im Markt verbleibenden Kraftwerke. Ein nationaler CO2-Preisaufschlag von 10 Euro pro Tonne reduziert hingegen den Gewinn der betroffenen Kraftwerke deutlich, weil die zusätzlichen CO2-Kosten nur zum Teil durch den Strompreisanstieg kompensiert werden.
Zudem können die vier Optionen verfassungsrechtlich so ausgestaltet werden, dass der Staat keine Entschädigungen leisten muss. Wichtig ist vor allem, dass unverzüglich ein geordneter Strukturwandel eingeleitet wird. Dieser schafft Planungssicherheit für Investoren und hilft Fehlinvestitionen zu vermeiden, zum Beispiel durch den Aufschluss neuer oder die Erweiterung bestehender Tagebaue.
Just two states - Germany and Poland - are jointly responsible for 51% of the EU’s installed capacity and 54% of the emissions from the coal-fired power plants but seven others have no coal-fired power plants in their electricity mix.
a much faster coal phase-out (see V. Quaschning, 2016) is necessary to remain within a Paris Agreement-compatible emissions budget for coal in the electricity sector. We have calculated this budget to be around 6.5 GtCO2 by 2050. Should existing coal-fired power plants continue their operation as planned, this CO2 emissions budget will be exceeded by 85% by 2050. If CO2 emissions from planned and announced plants are added, cumulative emissions will be almost twice as high as the coal emissions budget.
This report and its associated webpage
present two scenarios for phasing out coal.
Our first approach, the Regulator perspective, aims to phase out plants with the highest emissions intensity first.
In our second approach, the Market perspective, the economic value of the plant is prioritised over its emissions intensity.
Both approaches yield a phase-out of coal by 2030, which is in line with the Paris Agreement, and differ only in the order, in which coal power plant units go offline. While both perspectives mean strictly the same for the environment, the Regulator perspective may better reflect what could happen in reality as countries phase out coal through a mix of regulations both at the EU as well as at the national level.
Zum Vergleich:
Rüstungsausgaben-Zielmarke der NATO-Staaten: 2 % des BIP pro Jahr = 0.2 x 3356 Mrd. Euro/Jahr = 67 Mrd Euro/Jahr = (41 + 26) Mrd. Euro/Jahr. Umgelegt auf 80 Mio. Deutsche bedeutet das eine Erhöhung um 350 Euro/(Jahr Person). Die EEG-Umlage 2017 für unseren Stromverbrauch (ca. 4000 kWh im Jahr 2017) ist 260 Euro.
Die Berliner Energieforscherin Claudia Kemfert sieht die Energiewende in Gefahr. Die alten Energien und Klimaskeptiker gingen nicht kampflos vom Platz, sondern nutzten Propaganda und "Fake News", um die öffentliche Meinung umzupolen. "Es herrscht Krieg zwischen der alten und der neuen Energiewelt, das fossile Imperium schlägt zurück", sagt die klimaretter.info-Mitherausgeberin.
... hinter den Kulissen wird die Energiewende mit aller Kraft ausgebremst.
Zwar wird so getan, als seien alle Maßnahmen im Sinne der Energiewende. Doch dann werden genau gegenteilige Entscheidungen gefällt, etwa die Begrenzung des Ausbaus erneuerbarer Energien, die Einführung eines Kohlevorrangs, Kohleabwrackprämien oder überdimensionierte Netze. Dies alles dient in keinster Weise einer erfolgreichen und klugen Energiewende – im Gegenteil.
Zur Verschleierung werden Gespensterdebatten geführt. Zudem werden immer dreister alle möglichen Falschbehauptungen verbreitet, die sich immer mehr im kollektiven Gedächtnis einnisten.
Ganz sicher hat jeder von uns die Mythen und Behauptungen schon gehört, die mit bislang unbekannter Aggressivität verbreitet werden: Mit der Energiewende drohten Blackouts, wir bräuchten Kohlekraftwerke für die Grundlast, es bedürfe eines umfangreichen Netzausbaus, damit der Strom von der Nordsee nach Bayern gelangen könne, und so weiter. Alles falsch, aber alles in den Köpfen der Menschen – und zwar selbst in denen von kritischen Journalisten und engagierten Politikern.
Beide glauben den Mythos, dass erst Stromleitungen gebaut werden müssten, um erneuerbare Energien ins Netz zu integrieren. Beide übersehen, dass ein Netzausbau in erster Linie dem Transport von Kohlestrom dient. Zwei von drei Stromtrassen werden dafür gebaut. Je mehr Stromtrassen, desto mehr Kohlestrom, das zeigen nicht nur unsere Modellrechnungen. Statt für Stromleitungen zu kämpfen, sollten beide für einen konsequenten Kohleausstieg eintreten.
Deshalb ist ja auch die Wissenschaft so gefordert. Unsere wissenschaftlichen Erkenntnisse zeigen eindeutig, dass aufgrund des Klimawandels, der geopolitischen Ressourcenkonflikte, der wirtschaftlichen Ungleichheit und drohender Kriege der Umstieg auf erneuerbare Energien nicht nur wirtschaftlich lohnend, sondern demokratiefördernd und somit friedensstiftend ist. Eine Volkswirtschaft sollte in die Zukunft investieren und nicht in die Machtstrukturen der Vergangenheit. Das muss immer wieder deutlich gemacht werden.
Mit der Digitalisierung könnte die Erfolgsgeschichte der Energiewende sogar noch schneller gehen. Bürgergenossenschaften entstehen, neue Vertriebswege werden entdeckt, die technischen Innovationen entwickeln sich rasant. Plötzlich wird der alten Energiewelt bewusst, wie sehr sie auf dem absteigenden Ast sitzt. Und deswegen kämpfen die fossilen Vertreter jetzt mit aller Kraft um ihre Pfründen. Leider verzögern sie ihren Niedergang sehr erfolgreich.
Wir könnten bis 2050 den Anteil erneuerbarer Energien auf 80 Prozent ansteigen lassen, wie es das Ziel der Energiewende ist. Dafür müssten wir aber den Ausbau beschleunigen und nicht bremsen. Der Ausbaustopp ist Unsinn und nichts als ein Zugeständnis an die konventionelle Energiewelt.
Wir brauchen ein klares Bekenntnis zur Energiewende und müssen die erneuerbaren Energien in den Mittelpunkt rücken. Als allererstes muss der absurde Ausbaustopp aufgehoben werden, dann muss der Umbau des Stromsystems konsequent vollzogen werden. Auf den Atomausstieg muss der Kohleausstieg folgen, das letzte Kohlekraftwerk sollte spätestens 2040 vom Netz gehen.
"In the last 3 years in a row the majority of new capacity addition to the world's electricity system has come from renewable energy - that's a combination of solar, wind, hydro-, geothermal and biogas. Three years in a row it's in a majority. We project that if we have the right investment pathways to 2030 - we've done a global roadmap for renewable energy - that we can reach around 36% renewable penetration in the system by 2030. We just did a major study for the G20, in preparation for the next G20 summit on decarbonisation. That has basically created a consensus around major energy agencies that you can actually achieve 90% of the de-carbonisation you want if you accelerate the growth of renewable energy and energy efficiency. That's happening. Last year, the total investment in renewable energy generation was $320 bn. The year before - $360 bn. Today, it's a $2 trillion industry and we're seeing growth projections that are exponential.
The systems of the future, to be resilient, are going to have to be multi-dimensional. So we're going to have a mix of sources. I visited recently a transmission region in eastern Germany. They've integrated 45% renewables in their systems - variable renewables from wind and solar, with absolutely no disruption to the system. They do it because they are interconnected with other transmission regions, they have a connection to the hydropower in Sweden, and whenever there are fluctuations, they are able to manage that by bringing in new sources of energy. But the other part of this is that they have perfected weather forecasting - so that they can tell 24 hours in advance exactly how much wind or sun they're going to have at any particular time with 97% degree of certainty. So, the planning is there, and you're going to have hybrid systems, but you're going to have to manage them intelligently.
There's a difference between nuclear and renewables in that you can switch renewables on and off at no cost. Once you have built a nuclear plant and you get it running, you're not going to shut it down, it will take you 3-4 days to shut it down...
What we see as a long-term trajectory is that coal is going to fall off more and more in Germany. I was there a few days ago and I was told that 30% of lignite is going to be discontinued over the next year.
There are so many visionary cities today that are moving very strongly in the direction of sustainability and renewable energy. Of course, you cannot install acres of solar panels or huge wind farms in the middle of cities, but what cities can do is have their procurement policies favor the procurement of renewable electricity over others. That gives a very strong signal to investors, and that's happening in many places: San-Francisco, Vancouver, there are cities in the U.S. which are actively doing this, there are big companies in the U.S. based in these cities who are actively preferring renewable energy procurement over others. So this provides a signal to the investors in power generation from renewables to invest more. Power generation increases and the city is fed with renewable electricity. There are other ways of doing it also, and in the future what we're going to see is more and more rooftop solar in most countries. With this decentralized system what we need is smart grid system that's able to connect all of this, understand what is happening with electricity generation from decentralized units, be able to buy power to the grid or sell power from the grid to the household that has solar installed, and this smart system will allow sort of demand-side management, it's a very intelligent way of managing energy which will reduce the impact of energy use.
There's a very interesting experiment in the Arctic circle, using solar in the Arctic - because you have 6 months of sun in the Arctic. It's remarkable, where you have radiation, you can have solar. It doesn't matter about heat. "
"Die Umsetzung des Aktionsprogramms Klimaschutz 2020 wird seit 2015 in jährlichen Klimaschutzberichten überprüft. Der erste Bericht kommt zu dem Ergebnis, dass die Ziele der Bundesregierung für 2020 mit den Maßnahmen des Aktionsprogramms erfüllt werden. Eine erste Schätzung des UBA zeigte für das Jahr 2015 jedoch wieder einen leichten Anstieg der Treibhausgas-Emissionen (siehe Abb. "Treibhausgas-Emissionen in Deutschland seit 1990 nach Gasen"). Somit bleiben nunmehr fünf Jahre, um die Emissionen von 27 % auf den Zielwert in Höhe von 40 % in 2020 zu senken. Nach derzeitigem Stand ist die Zielerreichung nicht gesichert."
"(WK-intern) – Sonne, Wind und eine große Batterie: Dies sind die wesentlichen Bestandteile, mit denen E.ON den kleinen Ort Simris in der südschwedischen Region Scania auf 100 Prozent erneuerbare Energien umstellt.
Die Energie für die etwa 140 Haushalte wird von Windrädern mit einer installierten Leistung von 500 Kilowatt (kW) und Photovoltaikmodulen mit 440 kW erzeugt. Unterstützt wird die Energieversorgung durch eine Batterieanlage mit 800 kW.
Um vor Ort zum Ausgleich im Netz beizutragen, sollen die Kunden zu flexiblen, intelligenten "Prosumern" werden, die mit ihren Solar- und Batterieanlagen Energie erzeugen. Gleichzeitig sind deren Verbrauchsgeräte – beispielsweise Wärmepumpen – in ihrer Last regelbar. Das System ist in der Lage, Stromspitzen gezielt auszugleichen und die Erzeugung wirtschaftlicher zu gestalten. Um die Versorgungssicherheit in der Projektphase zu gewährleisten, kann Simris jederzeit wieder ohne spürbare Verzögerung an das regionale Versorgungsnetz angeschlossen werden.
Die Einwohner von Simris können die Stromerzeugung und den Verbrauch im Ort sowie die Ladung und Entladung der Batterie in Echtzeit auf einer E.ON-Website verfolgen.
Die in Simris umgesetzten Innovationen sind Teil des EU-Vorhabens InterFlex, das insgesamt sechs Netzprojekte in Europa umfasst. Ziel von InterFlex ist es, verschiedene intelligente Netztechnologien zu untersuchen, um Netzengpässe zu beseitigen und so den Ausbau der erneuerbaren Energie in der Stromversorgung auch in Zukunft zu ermöglichen.
Ein weiteres deutsches InterFlex-Projekt wird bei AVACON durchgeführt, einem zum E.On-Konzern gehörenden regionalen Energieversorger in Niedersachsen."
Reiner Priggen und die Deutsche Umwelthilfe, 6.11.2017 (im Cache)
Kohleausstieg ist die einzige Lösung
Kohle ist der schmutzigste Energieerzeuger überhaupt: Deutsche Kohlekraftwerke stoßen jährlich 270 Millionen Tonnen klimaschädliches CO2 aus. Das sind 74 Prozent der gesamten Treibhausgasemissionen des Stromsektors. ...
Die Weltgemeinschaft – darunter auch Deutschland - hat sich 2015 im Weltklimaabkommen von Paris dem gemeinsamen Kampf gegen den Klimawandel verschrieben. Die Bundesregierung hat außerdem für Deutschland im Klimaschutzplan 2050 (im Cache) eigene Klimaziele festgesetzt.
Bis 2020 sollen die CO2-Emissionen um 40 Prozent gesenkt werden,
bis 2050 dann nahezu vollständig
(im Vergleich zum Basisjahr 1990). Mit den bisher geplanten Maßnahmen ist schon jetzt klar, dass lediglich eine CO2-Minderung von 30 Prozent bis zum Jahr 2020 erreicht werden kann – die berechnete Lücke liegt bei etwa 150 Millionen Tonnen CO2! Trotz dieser alarmierenden Zahlen tut die Bundesregierung nichts. So kann es nicht weitergehen! Der Ausstieg aus der Kohle muss sofort eingeleitet werden. Dies ist die einzige Möglichkeit, die CO2-Minderungslücke bis 2020 zu schließen. ... Die Stromerzeugung aus Kohlekraftwerken muss bis 2020 halbiert werden, um die deutschen Klimaschutzziele zu erreichen. [Anm. J. Gruber: Volker Quaschning, "Anpassung der Zielkorridore]
von Axel Schröder, Umwelt und Verbraucher, Deutschlandfunk, 16.11.2017 (im Cache)
Ein paar Mausklicks sollen genügen, um den Strom eines ganz bestimmten Windmüllers, einer ganz bestimmten Photovoltaik- oder Biogasanlage beziehen zu können. Das erklärt Heiko von Tschischwitz vom neuen Internetportal enyway ("Die Revolution des Strommarkts"):
"Wir ermöglichen es Menschen, die ein Windrad betreiben oder eine Photovoltaikanlage betreiben, den Strom nicht wie das bisher immer funktioniert hat, einfach nur ins Netz einzuspeisen, sondern wirklich zum Energieversorger zu werden und den Strom dann direkt an ihre Nachbarn, ihre Freunde, ihre Verwandten oder andere Menschen zu verkaufen."
Vor 20 Jahren hat Heiko von Tschischwitz den Ökostromanbieter Lichtblick gegründet, er verließ das Unternehmen Ende Oktober. Nun leitet er die ausgegliederte Firma enyway, die auf das Lichtblick-Know-how in Sachen Stromverteilung aufbaut.
"Es ist ein anderes Geschäft. Wir sind eine Internetfirma, ein Online-Marktplatz, der Stromverträge zwischen Menschen vermittelt. Und das ist ein Geschäft, das mit dem Ökostromhandel, den Lichtblick betreibt, relativ wenig zu tun hat."
Noch ist die Anzahl derer, die ihren Ökostrom über das Portal anbieten begrenzt. Aber mit der Zeit wird das Angebot wachsen, hofft Heiko von Tschischwitz. Geld verdient die neue Firma damit, dass die Ökostrom-Erzeuger eine Gebühr für die Verwaltung von Neuverträgen zahlt und durch den Zuschlag von vier Euro, der für die Stromabnehmer anfällt. Dafür fallen für die Kunden all jene Kosten weg, die sonst ein Energieversorger als Zwischenhändler verlangt hätte.
Beispiel:
Gemeinsam mit vielen anderen Selbstversorger zu werden, das ist jetzt so einfach wie noch nie. (Marcus, Anlagenbesitzer)
"Ich habe einen großen Teil meines Lebens damit verbracht, gemeinsam mit anderen viele Solar-, Wind- und Biogasanlagen zu bauen. Meinen Strom verkaufe ich jetzt bei enyway. Doch wir gehen noch einen Schritt weiter: Wer Interesse hat, kann direkt in diese Solaranlage investieren und produziert damit eigenen, grünen Strom. Damit wirst du als Investor quasi zum Selbstversorger. Meine Anlage ist die erste, bei der das möglich ist. Darauf bin ich stolz!
Ich habe schon viele Pläne für weitere Anlagen, die mit der Kraft der Gemeinschaft gebaut werden sollen. So können wir gemeinsam die Energiewelt von morgen gestalten – eine Welt ohne Energiekonzerne.”
Die Stilllegung einer größeren Zahl von Kohlekraftwerken birgt nach Einschätzung von Experten des Wirtschaftsministerium und der Netzagentur keine Blackout-Gefahr. Einem Papier aus dem Wirtschaftsministerium zufolge könnte das Aus für die deutsche Versorgungssicherheit sogar gut sein, heißt es in dem Dokument. Ein Großteil der Meiler habe eine belastende Wirkung auf das Stromnetz, heißt es dort. Das SPD-geführte Wirtschaftsministerium erklärte, es distanziere sich von dem Papier, das nicht mit der Hausleitung abgestimmt sei. Die Bundesnetzagentur hingegen nannte Aussagen des Dokuments zwar politisch zugespitzt. Ein Abschalten von 7 Gigawatt (GW) Kohleleistung in bestimmten Regionen bis 2023 führe aber nicht zu einer Gefährdung der Versorgungssicherheit. 7 GW entsprechen der Leistung von 14 größeren Kohleblöcken.
Deutschland produziere einen zu großen Strom-Überschuss, der zu erheblichen Teilen in den Export fließe, heißt es in dem Papier aus dem Wirtschaftsministerium. Daher könnte eine Stilllegung von 7 Gigawatt (GW) Leistung nicht nur verkraftet werden: "Der deutsche Kraftwerkspark wäre also auch nach Stilllegung von 7 GW Kohlekraftwerken wettbewerbsfähig."
... Man könne auch ein Aus von acht bis zehn GW für die Versorgungssicherheit prüfen lassen. Dies ist die Forderung der Grünen in den Koalitionsgesprächen mit Union und FDP. Dies sei nötig, um die Klimaziele für 2020 einzuhalten. Deutschland will dann 40 Prozent weniger CO2 ausstoßen als 1990.
Eine Gefahr für die Versorgungssicherheit ist in den Jamaika-Verhandlungen vor allem von der FDP immer wieder angeführt worden [und von FDP maximal 3 - 5 GW Reduktion der Kohleverstromung als möglich bezeichnet worden].
Um Deutschlands Klimaziel 2020 zu erreichen, sollten insbesondere kurzfristig die ältesten und ineffizientesten Braunkohlekraftwerke stillgelegt und die Stromproduktion von Kohlekraftwerken, die älter als 20 Jahre sind, gedrosselt werden. ... Deutlich weniger Strom aus Braun- und Steinkohle kann dazu beitragen, das deutsche Klimaschutzziel im Jahr 2020 von 750 Millionen Tonnen Treibhausgasausstoß noch zu erreichen. Gleichzeitig müssen auch die Erneuerbaren Energien stärker ausgebaut werden. Das zeigt ein neues Thesenpapier des Umweltbundesamtes (UBA).
Das Umweltbundesamt schlägt kurzfristig vor allem zwei Maßnahmen vor:
< 4000 Vollaststunden/(Kraftwerk Jahr)
Braun- und Steinkohlekraftwerke, die älter als 20 Jahre sind, sollen nur noch ein Strombudget von maximal 4.000 Volllaststunden pro Anlage pro Jahr produzieren dürfen.
9 GW Abschalten
Die ältesten und ineffizientesten Braunkohlekraftwerke sollen stillgelegt werden, und zwar
Kapazitäten in Höhe von mindestens 5 GW. Diese Stilllegungen sollten
zusätzlich zu den ohnehin geplanten Stilllegungen von 4 GW erfolgen.
Beide Maßnahmen sind die kostengünstigsten und am schnellsten umsetzbaren, um bis 2020 noch eine nennenswerte Reduktion des Treibhausgasausstoßes in der Energiewirtschaft zu erzielen.
... Das Papier des UBA macht klar: Die Versorgungssicherheit in Deutschland bleibt durch die vorgeschlagenen Maßnahmen bestehen. Gleichzeitig muss jedoch die Energie aus Wind und Sonne deutlich schneller ausgebaut werden als bisher geplant. Die aktuellen Ausbauziele des Erneuerbare-Energien-Gesetz (EEG) reichen bei weitem nicht aus, um mit einem beschleunigten Kohleausstieg Schritt zu halten. Hierfür müssen kurzfristig die Ausbaupfade für
Windenergie an Land und Photovoltaik auf [jeweils] mindestens 4 GW/a (Brutto), und
Windenergie auf See auf 1 GW/a bei der
angehoben werden.
... Auch für das Ziel im Jahr 2030 ist eine schnelle Reduktion der Kohleverstromung wichtig. Denn bis 2030 soll der gesamte Ausstoß Deutschlands nur noch 543 bis 562 Millionen Tonnen/Jahr (= 6.7 - 7 t/Einwohner) CO2-Äquivaliente betragen (vgl. Ziel im Jahr 2020: 750 Millionen Tonnen/Jahr = 10 t/Einwohner). Das geht nur, wenn die Energiewirtschaft einen großen Teil der Reduktion trägt.
Nach dem Klimaschutzplan dürfen die Kraftwerke 2030 nur noch 175 bis 183 Millionen Tonnen CO2-Äquivaliente pro Jahr ausstoßen (minus 61% bis 62% ggü. 1990).
Zum Vergleich: 2015 waren es noch 347 Mio. Tonnen in der Energiewirtschaft.
Daher sollte nach dem Atomausstieg 2022 eine weitere sukzessive Stilllegung von älteren bzw. ineffizienten Braun- und Steinkohlekraftwerke erfolgen und so die verbleibende Gesamtleistung auf maximal 19 GW reduziert werden.
Ökoinstitut und Prognos im Auftrag des WWF, 2017 (im Cache)
Mit Blick auf die Auslaufpfade der Kohleverstromung schafft das 2015 in Paris beschlossene und 2016 in Kraft getretene Klimaschutzabkommen einen neuen Referenzrahmen. Das Paris-Abkommen formuliert die Begrenzung der globalen Mitteltemperatur auf einen Wert von deutlich unter 2 °C gegenüber den vorindustriellen Niveaus als übergeordnetes Ziel, nimmt aber auch die Einhaltung einer Temperaturerhöhungsgrenze von 1,5 °C in den Blick. Diese Schranke bildet in der Architektur des Pariser Klimaschutzabkommens den zentralen Bewertungsindikator für die Angemessenheit der klimaschutzpolitischen Ambitionen der einzelnen Staaten. Daraus ergibt sich eine weniger starre Fokussierung auf Emissionsminderungsziele für bestimmte Zeithorizonte oder Zieljahre und eine stärkere Berücksichtigung des Konzepts von Emissionsbudgets, das mit Blick auf die notwendigen Maßnahmenwirkungen als sinnvoller erscheint.
Aus Analysen zu den Voraussetzungen für die Einhaltung der 2°C-Schranke für die Temperaturerhöhung auf globaler Ebene lassen sich auf der Basis transparenter Verteilungskonzepte sowohl für Deutschland als auch für den deutschen Stromsektor klare CO2-Emissionsbudgets ableiten. Dieses Konzept der Emissionsbudgets für ein spezifisches Land (hier abgeleitet auf der Basis eines globalen Pro-Kopf-Ansatzes und ohne Berücksichtigung historischer Emissionen) sowie einen spezifischen Sektor (hier auf der Basis etwa proportionaler Emissionsminderungen in den verschiedenen Sektoren) erweist sich als produktiver Ansatz, um auf Ebene kleinerer Handlungsräume den jeweils fairen Beitrag zur Erreichung der globalen Ziele zu identifizieren. Bei einem Emissionsbudget für Deutschland in der Größenordnung von knapp 10 Mrd. t CO2 für den Zeitraum von 2015 bis 2050 ergibt sich für den deutschen Stromsektor ein entsprechendes Emissionsbudget von 4,0 bis 4,2 Mrd. t CO2.
Analysen zum Lösungsraum für den Auslaufpfad der deutschen Kohleverstromung im Spannungsfeld technisch möglicher Anpassungsprozesse und regulativer Grenzen für die notwendigen Maßnahmen zeigen deutlich, dass die Einhaltung eines Emissionsbudgets von 4,0 bis 4,2 Mrd. t CO2 für den Zeitraum 2015 bis 2050 grundsätzlich darstellbar ist. Voraussetzung dafür ist, dass relativ schnell signifikante Emissionsminderungen umgesetzt werden können (Abbildung Z-1).
Auf der Grundlage umfangreicher Strommarktanalysen lassen sich strategische Elemente einer Entwicklung bzw. eines Modells identifizieren, mit dem das Emissionsbudget von 4,0 bis 4,2 Mrd. t CO2 (Abbildung Z-1) für den deutschen Stromsektor durch eine beschleunigte Beendigung der Kohleverstromung eingehalten, diese aber auch systemverträglich umgesetzt werden kann (Abbildungen Z-2 und Z-3):
Beschleunigung des Ausbaus der Stromerzeugung auf Basis erneuerbarer Energien auf das mit dem EEG 2014 und dem Netzentwicklungsplan 2030 ursprünglich angestrebte Niveau.
Kurzfristige Stilllegung aller mehr als 30 Jahre betriebenen Kohlekraftwerke, wobei der Abbau dieser Kapazitäten vor dem Hintergrund des hohen Emissionssockels der Kohlekraftwerksflotte und des engen CO2-Emissionsbudgets 2019 starten sollte.
Ein festes Enddatum für die Braun- und Steinkohleverstromung Ende 2035.
Umsetzung eines Mixes aus Kapazitäts- und Emissionsmanagements, mit dem für den Zeitraum von 2019 bis 2035 eine gewisse Stetigkeit von Emissionsminderungen, Kapazitätsabbau und Strommarktwirkungen erzielt und die Anpassungsprozesse für Unternehmen und Regionen erleichtert werden können.
Anforderung an die Instrumentierung, die einerseits den Abbau der hohen Exportüberschüsse Deutschlands aus CO2-intensiver Stromerzeugung erreichen, andererseits aber einen ab 2020 im Dekadenmittel ausgeglichenen Stromaußenhandelssaldo (im Bereich des fossil erzeugten Stroms) anstreben sollte.
Überprüfung der derzeit implementierten bzw. vorgesehenen Instrumente zur Sicherung der Systemstabilität und der Versorgungssicherheit im Kontext des beschleunigten Auslaufens der Kohleverstromung.
Das siebte Strategieelement betrifft den regulativen Rahmen für den Tagebau auf Braunkohle. Vor dem Hintergrund des zur Einhaltung der 2°C-Temperaturschranke kompatiblen CO2-Emissionsbudgets für den deutschen Stromsektor ist für alle Braunkohlereviere mit einer früheren Beendigung der Braunkohleförderung im Bereich der bereits genehmigten Abbaumengen zu rechnen. Genehmigungsverfahren
zu Tagebauerweiterungen sollten bis zur verlässlichen Klärung des Auslaufpfades für die Kohleverstromung in Deutschland gestoppt und sinnvolle Verkleinerungen rechtssicher dargestellt werden. Die damit verbundenen Konsequenzen (Finanzierung der Nachsorgekosten etc.) müssen frühzeitig in den Blick genommen werden.
Umfassende Analysen zu den regionalwirtschaftlichen und sozialen Wirkungen eines beschleunigten Auslaufens der Kohleverstromung und die Schaffung entsprechender Kompensationsmechanismen in der erforderlichen Breite (vom Ausbau erneuerbarer Energien über die Ansiedlungspolitik bis hin zum Infrastrukturausbau).
für das Jahr 2025 eine verbindliche Quote für den Anteil rein elektrischer Fahrzeuge (d.h. betterieelektrische und Brennstaffzellenfahrzeuge an den Neuwagenzulasungen in Höhe von ≥ 25 %. Plugin-Hybridfahrzeuge sollten in dem System ebenfalls anrechenbar sein, aber mit einer im Vergleich zu vollelektrischen Fahreugen verringerter Wertigkeit.
eine Erhöhung der Quote auf ≥ 50 % bis 2030 soll bereits heute festgeschrieben werden, wobei über die exakte Höhe nach einer Zwischenevaluation spätestens im Jahr 2015 entschieden werden.
Eine realistische Bestandsaufnahme auf Basis aktueller Rahmendaten
Patrick Graichen, Frank Peter, Philipp Litz, agora Energiewende, 7. Sept. 2017 (im Cache)
Matthias Buck (Politikanalyst, agora): [In der EU-Politik] ist keine Aufbruchstimmung momentan zu sehen. Es ist eher "Wir wollen nicht, dass es so schnell vorangeht." Das ist die Dynamik, die sich momentan abzeichnet. (Quelle: "Quo vadis? Vor der Weichenstellung für die EU-Energie- und Klimapolitik", (Link aktiv bis zum 20. Juni 2018, 12:47 Uhr) Umwelt und Verbraucher, Deutschlandfunk, 11:47 Uhr, 12.12.2017)
Der Projektionsbericht der Bundesregierung 2017 wurde mit validen wissenschaftlichen Modellen erarbeitet. Dennoch enthält er aus heutiger Sicht einige entscheidende Annahmen, die die Emissionsprognose für 2020 als unrealistisch erscheinen lassen. Dies betrifft insbesondere die folgenden zwei Effekte:
Makroökonomische Rahmendaten: Der Projektionsbericht basiert seine makroökonomischen Rahmendaten (Bevölkerung, Wirtschaftswachstum, Rohstoff- und CO2-Preise) auf den Empfehlungen der EU-Kommission zur Erstellung der Projektionsberichte vom Juni 2016.3 Diese sind jedoch zum Teil nicht mehr aktuell.
Emissionsentwicklung am aktuellen Rand: Der Projektionsbericht fußt auf den verifizierten Emissionsdaten des Jahres 2014, die vom Umweltbundesamt Anfang 2016 veröffentlicht wurden. Die Entwicklungen der Jahre 2015 und 2016 wurden in dem Bericht nicht erfasst, sodass sich die im Bericht prognostizierte Emissionsminderung von 90 Millionen Tonnen im Business-as- usual tatsächlich auf einen Modellzeitraum von sechs Jahren erstreckt, nicht auf vier.
Konkret werden folgende, realistischere Prognosen bis 2020 zu höheren Emissionen führen als im Projektionsbericht erwartet:
Makroökonomische Rahmendaten: Mehr wirtschaftliches Wachstum, mehr Menschen
Bei der Entwicklung des Bruttoinlandsprodukts geht der Projektionsbericht im Zeitraum von 2015 bis 2020 von einem jährlichen Wirtschaftswachstum von 1,3 Prozent aus. Tatsächlich betrug das Wachstum jedoch 1,7 Prozent im Jahr 2015 und 1,9 Prozent im Jahr 2016. Auch für die kommenden Jahre ist mit einem höheren Wachstum zu rechnen.
Der Projektionsbericht geht zudem von einer Wohnbevölkerung in Deutschland im Jahr 2020 von 80,6 Millionen Menschen aus. Tatsächlich beträgt die Wohnbevölkerung Anfang 2017 aber laut Statistischem Bundesamt 82,8 Millionen Menschen. Ursache ist die seit 2011 deutlich steigende Zuwanderung vor allem aus Ost- und Südeuropa sowie die Aufnahme von Geflüchteten in den Jahren 2015 und 2016.
Die Folge: Durch das stärkere wirtschaftliche Wachstum sowie die größere Wohnbevölkerung sind im Jahr 2020 Mehremissionen in Höhe von etwa 30 Millionen Tonnen zu erwarten.
Der Projektionsbericht geht im Jahr 2020 von einem CO2-Preis von 15 Euro pro Tonne aus. Tatsächlich liegt er aber aktuell bei etwa 5 Euro und dürfte bis zum Jahr 2020 aufgrund der weiterhin bestehenden Überschüsse im Europäischen Emissionshandelssystem auch nicht relevant ansteigen. Die Folge: Die verfügbaren fossilen Kraftwerke in Deutschland laufen mehr als in den Modellrechnungen angenommen. Dadurch bleibt der Stromexportsaldo in etwa auf dem heutigen Niveau von über 50 TWh und sinkt nicht auf 40 TWh wie im Projektionsbericht modelliert. Die Folge wären etwa 10 TWh mehr Stromexporte. Da die Mehrauslastung gegenüber den Modellrechnungen insbesondere bei Kohlekraftwerken zu erwarten ist, sind hier mit Mehremissionen von etwa 5 bis 10 Millionen Tonnen CO2e im Jahr 2020 zu rechnen.
Der Projektionsbericht geht für 2020 von einem Ölpreis von rund 50 Euro2017/MWh aus. Tatsächlich beträgt er aktuell Mitte 2017 jedoch nur 16 Euro2017/MWh. Bleibt der Ölpreis auf dem aktuellen Niveau bis 2020 – was eine deutlich realistischere Erwartung ist als die Preissteigerung im Projektionsbericht - dann bedeutet dies, dass auch die Benzin- und Dieselpreise entsprechend niedriger sind als angenommen (circa 20 Prozent).
Geht man, wie in der Metastudie von CE Delft zum Thema5 von einer niedrigerer Dieselpreis einen Anstieg des LKW-Dieselverbrauchs um rund 6 Prozent. Daraus ergeben sich zusätzliche Emissionen im Güterverkehr in Höhe von etwa 5 Millionen Tonnen im Jahr 2020.
Auch im Personenverkehr wirken sich die deutlich niedrigeren Benzin- und Dieselpreise negativ auf die prognostizierte Emissionsbilanz aus. Darüber hinaus ist seit einigen Jahren eine steigende Diskrepanz zwischen den CO2-Emissionswerten der Fahrzyklus-Tests und den CO2-Emissionen im Realbetrieb zu beobachten (durchschnittliche Abweichung 2015: mehr als 40 Prozent). Diese Diskrepanz ist so noch nicht im Projektionsbericht abgebildet. Eine konservative Abschätzung dieser beiden Effekte zusammen lässt daher im Jahr 2020 Zusatzemissionen in Höhe von 3 bis 5 Millionen Tonnen CO2e erwarten.Preiselastizität des Güterverkehrs in Europa von 0,3 aus, so bedeutet ein um 20 Prozent niedrigerer Dieselpreis einen Anstieg des LKW-Dieselverbrauchs um rund 6 Prozent. Daraus ergeben sich zusätzliche Emissionen im Güterverkehr in Höhe von etwa 5 Millionen Tonnen im Jahr 2020.
Auch im Personenverkehr wirken sich die deutlich niedrigeren Benzin- und Dieselpreise negativ auf die prognostizierte Emissionsbilanz aus. Darüber hinaus ist seit einigen Jahren eine steigende Diskre- panz zwischen den CO2-Emissionswerten der Fahr- zyklus-Tests und den CO2-Emissionen im Realbe- trieb zu beobachten (durchschnittliche Abweichung 2015: mehr als 40 Prozent). Diese Diskrepanz ist so noch nicht im Projektionsbericht abgebildet. Eine konservative Abschätzung dieser beiden Effekte zu- sammen lässt daher im Jahr 2020 Zusatzemissionen in Höhe von 3 bis 5 Millionen Tonnen CO2e erwarten. ...
Angesichts des anstehenden Umbaus der deutschen Energieinfrastruktur hin zu einer Vollversorgung mit erneuerbaren Energien und damit verbundener volatiler Einspeisung sind der Ausbau und die Ertüchtigung des deutschen Stromnetzes eine der vordringlichsten Aufgaben. 3M hat mit der ACCR Technologie (Aluminium Conductor Composite Reinforced) einen Leiter entwickelt, der doppelt so viel Strom wie herkömmliche Aluminium-Stahl-Leiter transportieren kann und somit ein Baustein in der beschleunigten Realisierung des Netzausbaus darstellen kann.
Preisbasierter Klimaschutz – sogenanntes Carbon Pricing – gilt als Schlüsselinstrument im Kampf gegen den Klimawandel. Die Bepreisung von Treibhausgasemissionen hat in der jüngsten Vergangenheit eine starke Ausbreitung erfahren, sodass mittlerweile knapp 13 Prozent der globalen Emissionen mit einem Preis versehen sind.
Mit dem Ziel, Carbon Pricing weiter voranzutreiben, hat die Weltbank im Jahre 2015 die Carbon Pricing Leadership Coalition (CPLC) ins Leben gerufen (Carbon Pricing Leadership Report 2016 - 2017, in cache). Die CPLC ist ein freiwilliger Zusammenschluss nationaler und subnationaler Regierungen, Unternehmen und zivilgesellschaftlicher Organisationen, die sich gemeinsam mit der Weltbank und weiteren zentralen internationalen Institutionen für die Bepreisung von Treibhausgasemissionen einsetzen. Die CPLC dient dabei als Dialogplattform, sodass sich die Teilnehmer über ihre Erfahrungen mit Politiken zur CO2-Bepreisung austauschen können. Auch CO2-Bepreisung in Unternehmen spielt dabei eine Rolle. Durch die Zusammenarbeit soll die Einführung von Politikinstrumenten zur CO2-Bepreisung vorangetrieben und die Umsetzung bestehender Politiken gestärkt werden.
Um dieses Ziel zu erreichen. setzt die Coalition Aktivitäten in drei Arbeitsgruppen um.
Eine Arbeitsgruppe ist dafür zuständig, die weltweit bei der Bepreisung von Treibhausgasen
gemachten Erfahrungswerte zusammenzutragen und
Strategien zur Entwicklung und Einführung von Carbon Pricing Instrumenten zu erarbeiten.
Eine weitere Arbeitsgruppe ist darauf ausgerichtet, die Unterstützung von Unternehmen für Carbon Pricing zu mobilisieren. Dabei stützt sie sich auf die positiven Erfahrungen, die Unternehmen in diesem Bereich bereits gemacht haben und zeigt mögliche Umsetzungswege auf.
Die dritte Arbeitsgruppe fördert die Rolle der CPLC als Dialogplattform, indem sie Teilnehmern die Möglichkeit bietet, sich über ihre Erfahrungen mit CO2-Bepreisungspolitiken auszutauschen. Neben dem Austausch zu den technischen Herausforderungen bei der CO2-Bepreisung fördert die Allianz auch den politischen Dialog zwischen Regierungen und Unternehmen, um die dringlichsten Fragen zu identifizieren und Lösungen zu erarbeiten.
Politisch flankiert werden diese Aktivitäten vom Carbon Pricing Panel, das sich aus den
Regierungschefs 7 nationaler und subnationaler Regierungen zusammensetzt und von den
höchsten Vertretern aus Weltbank, IWF und der OECD ergänzt wird.
Mit dem Ziel, die wissenschaftlichen Grundlagen zur Einführung von Carbon Pricing weiter zu verbessern, richtete die CPLC zudem die High-Level Commission on Carbon Pricing ein (Report of the High-Level Commission on Carbon Prices, 2017). Unter dem gemeinsamen Vorsitz von Lord Nicholas Stern und Joseph Stiglitz
arbeiten Wirtschaftswissenschaftler, Energieexperten und Klimawissenschaftler zusammen, um die erfolgreiche Umsetzung des Paris Agreement voranzutreiben. In ihrer Arbeit baut die High-Level Commission auf bestehenden Forschungsarbeiten zu CO2-Bepreisung und Klimapolitiken auf.
Ziel der Kommission ist es dabei insbesondere, CO2-Preiskorridore zu identifizieren, die für die Ausgestaltung von Instrumenten zur CO2-Bepreisung und anderen Politikinstrumenten genutzt werden können.
Solche Preiskorridore werden sich insbesondere zu Beginn noch stark nach Sektor und Region unterscheiden und erst im Laufe der Zeit angepasst werden.
Mit der Festlegung solcher Preiskorridore ist die Erwartung verbunden, dass ein Pfad zur schnellen Dekarbonisierung aufgezeigt wird, der es zugleich ermöglicht, die UN-Nachhaltigkeitsziele (Sustainable Development Goals) umzusetzen.
CONTENTS
The Commission: Objectives i
Acknowledgements ii
Executive Summary 1
1 ..... Introduction 5
2 ..... Carbon Pricing: Indispensable for Reducing Emissions in an Efficient Way 9
2.1 ... Carbon-Pricing Options 10
2.2 ... The Importance of Fossil Fuel Subsidies 12
2.3 ... Effective Carbon Pricing through an Enabling Environment 13
2.4 ... Private Sector Gearing Up for Carbon Pricing 14
3 ..... Climate Policy Packages: Key to Achieving the Paris Temperature Objective 15
3.1 ... Government and Market Failures Other Than GHG Externalities 15
3.2 ... Country Policy Design: A Reflection of National and Local Circumstances 18
3.3 ... Dynamic and Adaptive Climate Policy Designs 21
3.4 ... International Cooperation to Promote Consistency of Actions across Countries 23
4 ..... Evidence on Carbon-Price Trajectories Consistent with Paris Agreement Temperature Objective 25
4.1 ... Evidence on Carbon Price That Would Be Consistent with the Paris Agreement 25
4.1.1 . Technological Roadmaps 25
4.1.2 . Analysis of National Mitigation and Development Pathways 30
4.1.3 . Global Integrated Assessment Models 32
4.2 ... Current Level and Breadth of Carbon Pricing Inconsistent with Paris Agreement 35
5 ..... Tapping Carbon-Pricing Revenues 37
5.1 ... Carbon Pricing as a Source of Government Revenue 37
5.2 ... Redistributing Carbon-Pricing Revenues to Protect the Poor and Vulnerable 39
5.3 ... Carbon-Pricing Revenues to Smoothen the Transition toward Decarbonization 40
5.4 ... Boosting Investment and Economic Growth with Carbon-Pricing Revenues 42
5.5 ... Carbon-Pricing Revenues to Foster Technological Change and Transition toward Decarbonization 44
6 ..... Complementing Carbon Pricing with Other, Well-Designed Policies 46
6.1 ... Using Complementary Infrastructure and Planning Approaches to Facilitate Transition 46
6.2 ... Using Complementary Policies to Tackle Other Market Failures and Distributional Impacts 47
7 ..... Conclusion 50
A ..... Appendix A: The Social Cost of Carbon 52
B ..... Appendix B: The Social Value of Mitigation Action 53
Executive Summary
1. Tackling climate change is an urgent and fundamental challenge. ... The transition to a low-carbon economy is potentially a powerful, attractive, and sustainable growth story, marked by higher resilience, more innovation, more livable cities, robust agriculture, and stronger ecosystems. To succeed, that is, to deliver efficiently and fully realize the potential benefits of climate policies, careful policy design is essential.
2. A well-designed carbon price is an indispensable part of a strategy for reducing emissions in an efficient way: taxes, cap-and-trade, notional prices, e.g. financial instruments, incentives, project-based credits, Clean Development Mechanism (CDM). Terminating shadow pricing (subsidies), appropriate regulatory framework.
3. Achieving the Paris objectives will require all countries to implement climate policy packages. These packages can include policies that complement carbon pricing and tackle market failures other than the GHG externality. These failures are related to knowledge spillovers, learning and R&D, information, capital markets, networks, and unpriced co-benefits of climate action (including reducing pollution and protecting ecosystems). ...
4. The Commission explored multiple lines of evidence on the level of carbon pricing that would be consistent with achieving the temperature objective of the Paris Agreement, including technological roadmaps, analyses of national mitigation and development pathways, and global integrated assessment models, taking into account the strengths and limitations of these various information sources.
5. Explicit carbon-pricing instruments can raise revenue efficiently because they help overcome a key market failure: the climate externality. Policy decisions will need to duly take into account the country’s objectives and specific circumstances, while keeping in mind the development objectives and commitments agreed in relation to the Paris Agreement objectives.
6. Carbon pricing by itself may not be sufficient to induce change at the pace and on the scale required for the Paris target to be met, and may need to be complemented by other well-designed policies tackling various market and government failures, as well as other imperfections.
Conclusions: ... the explicit carbon-price level consistent with achieving the Paris temperature target is at least
US$40–80/tCO2 by 2020 and
US$50–100/tCO2 by 2030,
provided a supportive policy environment is in place
Main Report
2. CARBON PRICING: INDISPENSABLE FOR REDUCING EMISSIONS IN AN EFFICIENT WAY
2.4 Private Sector Gearing Up for Carbon Pricing
... investors are increasingly demanding comprehensive climate disclosure — including the assurance that companies are adequately lowering their risk exposure to policies that place a price on carbon and reallocating capital toward areas of their business that will see a higher return in a low-carbon economy. Transparency on the carbon footprint of firms and investments has been promoted by Mark Carney, as Governor of the Bank of England and Chairman of the G20’s Financial Stability Board, the Carbon Disclosure Project (CDP), and the Task Force on Climate-Related Financial Disclosure. It is critical to increase awareness and help investors and consumers make decisions that account for their contribution to climate change and their exposure to climate policies.
Disclosures to the CDP in 2016 capture the corporate response:
517 companies are already using internal carbon prices as an accounting and risk management tool (which represents a 19 % increase with respect to 2015), and an additional
732 companies have revealed plans to adopt an internal carbon price by 2018 (a 26 % increase with respect to 2015) (CDP 2016).
147 companies are embedding an internal carbon price ever deeper within their business strategies and across their operations in order to take tangible action on climate change.
A subset of 37 companies describe a variety of ways in which this tool has directly affected their budget allocations or investment decisions, which has resulted in tangible changes.
Energiewende und Klimaschutz durch lokale Strommärkte - Fehlende Ambitionen zur konsequenten Fortsetzung der Energiewende verspielen Chancen
Ausschreibungen und Bürgerenergie sind inkompatibel, und Bürgerenergiegesellschaften im Sinne der state aid rules der EU-Kommission sind von den Ausschreibungen auszunehmen. Danach sind Erneuerbare-Energie- Anlagen bis zu 1 Megawatt installierte Leistung (im Falle von Windenergie 6 x 3 Megawatt installierte Leistung) von Ausschreibungen zur Ermittlung der Höhe der Marktprämie auszunehmen.
Eine bessere Option ist ein bedarfsorientierter Ausbau, bei dem sich das Zubauvolumen nicht aus administrativen Vorgaben ergibt, sondern der Nachfrage folgt. Diese Option ist wirtschaftlicher, führt schneller zu einer Dekarbonisierung und vor allem zu einer effizienteren Zielerreichung. Die wirtschaftlichen Anreize müssen dabei so gesetzt werden, dass Erzeugung und Verbrauch unmittelbar, d.h. vorrangig auf lokaler Ebene ausgeglichen werden. Vonnöten sind also gezielte Anreize zum Ausbau der Energieerzeugung am Ort des Verbrauchs. Das erhöht deutlich die Effizienz des Energiesystems.
Verbrauch und Erzeugung lokal koppeln - unsere Vorschläge im Detail:
Ein bedarfsorientierter Zubau von Erneuerbaren Energien muss die folgenden Regelungen umfassen:
Befreiung des Eigenverbrauchs von der EEG-Umlage
Gleichstellung von Mieterstrom und anderem Quartiersstrom mit Eigenverbrauch
Einführung eines Bürgerstromhandels
Als dritte Säule sollte der sogenannte Bürgerstromhandel ermöglicht werden. Wir fordern wie auch das Europäische Parlament, diesen Handel mit überschüssigem selbst erzeugtem Strom zwischen Prosumenten und ihren Nachbarn regulatorisch ohne diskriminierende oder unverhältnismäßige Verfahren und Gebühren, die nicht kostenorientiert sind, anzureizen. Durch die Möglichkeit des Handels auf derselben Netzebene wird der Ausbau von Energieerzeugungsanlagen in Städten angereizt. Strom aus erneuerbaren Quellen kann wirtschaftlich zwischen Bürgern und Bürgerinnen auf der untersten Netzebene gehandelt werden und sorgt damit für einen gezielten Anreiz zum Ausbau der Verteilnetze.
Entwicklung eines regionalen Grünstrommarktes
Um nicht nur im Solar-, sondern auch im Windbereich den Ausbau des Energiesystems effizient voranzutreiben, ist zudem die Ermöglichung regionaler Stromlieferungen für Bürgerenergiegesellschaften zentral. Hierbei könnten mittels eines Privilegs Bürgerwindparks den Mitgliedern der Betreibergesellschaften Strom aus diesen Anlagen zu vergünstigten Stromnebenkosten liefern.
Nicht jeder, der Strom aus regenerativen Erzeugungsanlagen vor Ort – insbesondere regionalen Bürgerstrom – beziehen will, kann dies tun.
Nicht immer gibt es in der unmittelbaren Umgebung genügend Kapazitäten zur Erzeugung Erneuerbarer Energie. Diese Verbraucher brauchen dennoch die Chance, "echten Grünstrom" zu beziehen. Sie sollten daher mit Verbrauchern, die ihren Strom selbst erzeugen oder aus Direktverbrauchsmodellen beziehen, dem Grunde nach gleichgestellt werden. Dafür ist eine Voraussetzung zu erfüllen: Der Strom muss bilanzkreisscharf und viertelstundengenau lastgerecht aus klar definierten Erneuerbare-Energie-Anlagen verbunden mit der Grünstromeigenschaft an den VerbraucherInnen geliefert werden. Dafür kann auch das öffentliche Netz genutzt werden.
Von Daniel Wetzel | Veröffentlicht am 20.03.2018 |
Dass Deutschland die Energiewende allein nicht packt, hatte in den vergangenen Tagen bereits das Weltwirtschaftsforum (WEF) festgestellt. Auf einer Tagung im brasilianischen São Paulo stellte das Forum den ersten globalen Energiewende-Index (im Cache) vor.
Für diesen Vergleichsindex hatte die Unternehmensberatung McKinsey & Company zusammen mit dem WEF den Status der Energiewende in 114 Ländern anhand von 40 Indikatoren ermittelt.
... Und wenn in den Netzen zu viel Strom ist, müssen erst die konventionellen Kraftwerke ihre Produktion herunterfahren. Erst wenn deren komplettes Potenzial zur Beseitigung von Netzüberlastungen ausgeschöpft ist, dürften auch Ökostromanlagen abgeregelt werden.
Der "Grundpfeiler der Energiewende" dürfe nicht "angesägt" werden
Den zweiten Teil dieser Regelung stellen Ecofys, Consentec und BBH nun auf den Prüfstand. Ökostromanlagen sollten künftig grundsätzlich in das Management von Netzengpässen eingebunden werden, schreiben die Forscher in ihrer Analyse. Die Kosten solcher Maßnahmen ließen sich so deutlich reduzieren.
Die deutsche CO2-Bilanz würde das nur wenig verschlechtern, schreiben die Experten. Die Emissionen des deutschen Kraftwerkparks würden demnach nur um rund ein Prozent steigen.
Im Bundeswirtschaftsministerium ist man für die Vorschläge der Wissenschaftler offenbar aufgeschlossen. Das Ressort von Peter Altmaier (CDU) könnte noch im laufenden Jahr einen Gesetzentwurf zur Relativierung des Einspeisevorrangs vorlegen, heißt es in Berlin. ...
Zukunft ERDGAS ruft zum zweiten Mal den CO2-Tag aus - in diesem Jahr eine Woche früher als 2017.
Am heutigen Mittwoch (23.5.2018) ist CO2-Tag. Das ist der Tag, an dem das deutsche CO2-Budget für das gesamte Jahr verbraucht ist. Im Vorjahr hatte das Budget noch eine Woche länger gereicht. Dass Deutschland das CO2-Limit neun Monate früher als vorgesehen erreicht, zeigt: Die Klimapolitik muss dringend angepasst werden. Andernfalls werden wir unsere Verpflichtungen aus dem Pariser Klimaabkommen nicht einhalten. ...
... Mit dem Klimaabkommen von Paris hat sich die Weltgemeinschaft Ende 2015 das Ziel gesetzt, die globale Erderwärmung auf unter zwei Grad Celsius im Vergleich zum vorindustriellen Zeitalter zu begrenzen. Um das zu erreichen, dürfen weltweit nicht mehr als 890 Milliarden Tonnen CO2 in die Atmosphäre abgegeben werden. Aus dieser Höchstmenge lassen sich nationale CO2-Budgets errechnen: Demnach steht Deutschland im Jahr 2018 ein CO2-Budget von 217 Millionen Tonnen zur Verfügung. Im vergangenen Jahr wurde hierzulande mit über 900 Millionen Tonnen das Vierfache des vorgesehenen CO2-Jahresbudgets emittiert.
Der Ausbau der Windenergie an Land geht in diesem Jahr stark zurück. Auch bei den Genehmigungen gibt es laut Branche einen deutlichen Einbruch. Die Unternehmen geraten zunehmend unter Druck, Entlassungen sind die Folge.
Die Befürchtungen der Windbranche sind eingetreten: Der Ausbau der Onshore-Windenergie ist hierzulande im ersten Halbjahr deutlich eingebrochen. Insgesamt wurden von Januar bis Juni 497 Anlagen mit einer Gesamtleistung von 1626 Megawatt (MW) aufgestellt, wie der Bundesverband WindEnergie (BWE) und der Maschinenbauverband VDMA Power Systems heute (26. Juli) in Berlin bekannt gegeben haben. Das sind 29 Prozent weniger als im Vorjahreszeitraum 2017 (damals: 2281 MW).
Im Gesamtjahr 2018 könnte der Ausbau im Vergleich zum Vorjahr um rund ein Drittel auf weniger als 3500 MW zurückgehen, fürchten die Verbände (2017: 1792 Neuanlagen mit 5333 MW). Der aktuelle Ausbau gehe vor allem auf die Übergangsregelung des alten EEG zurück und passe nicht zu dem im Koalitionsvertrag verabredeten Ziel von 65 Prozent erneuerbare Energie bis 2030.
Die Branche hatte seit Langem vor dieser Entwicklung gewarnt: Die Umstellung auf das Ausschreibungssystem in Verbindung mit Mengenbegrenzungen führt zu starken Verwerfungen im Markt. Als weitere Belastung erwiesen sich die – mittlerweile zurückgenommenen – Ausnahmeregeln für Bürgerenergieprojekte, für die 2017 keine Genehmigungen nötig waren, um an Auktionen teilzunehmen. Das lässt ihre spätere Umsetzung unsicher werden.
Das Aktionsbündnis [Klima-Allianz] fordert von der Bundesregierung und von deutschen Unternehmen, ihrer großen Verantwortung für Klima- und Umweltschutz gerecht zu werden und endlich zukunftsfähig zu wirtschaften. Das gilt vor allem für die Bereiche Energie, Landwirtschaft und Verkehr
Im Rahmen des Projekts "Coal Transitions – Research and Dialogue on the Future of Coal" koordiniert von Iddri-Sciences Po und finanziert von der dänischen Stiftung KR Foundation wurden seit 2016 sechs Länder, die Kohle produzieren und/oder verbrauchen, intensiv beleuchtet. Die Länderstudien wurden von Forschungseinrichtungen im jeweiligen Land erstellt: neben dem DIW Berlin (Deutschland) waren dies die Australian National University (Australien), University of Cape Town (Südafrika), Institute for Structural Research IBS Warsaw (Polen), Indian Institute of Technology IIT Ahmedabad (Indien) und Tsinghua University Beijing (China). Darüber hinaus untersuchte das DIW Berlin mit dem COALMOD-World-Modell die Auswirkungen von Kohleausstiegsszenarien auf den globalen Markt und die großen Anbieter, insbesondere im Hinblick auf die ökonomische Nachhaltigkeit von weiterer Förderinfrastruktur. In einem Synthesebericht werden die Ergebnisse und Empfehlungen aus allen Arbeiten des Projekts zusammenfasst.
... Eine wichtige Erkenntnis der Studie ist, dass der Verzicht auf Kohle in allen untersuchten Ländern nicht nur wünschenswert ist, sondern auch kostenverträglich realisierbar ist; in Südafrika liegen die Kosten eines Energiesystems ohne Kohle sogar niedriger als die Kosten, die ein Festhalten an der Kohle mit sich bringen würde....
... Die Studienautoren stellen Szenarien vor, die einen kosteneffizienten Ausstieg aus der Kohle bis 2050 für alle sechs Länder aufzeigen. In allen Ländern spielt ein steigender Anteil an erneuerbaren Energien, vor allem an Wind- und Sonnenenergie, bei der Substitution von Kohle die Hauptrolle. ...
By Mario Molina, Veerabhadran Ramanathan, Durwood J. Zaelke, October 9, 2018
Mario Molina shared the Nobel Prize in Chemistry in 1995 for his work on depletion of the ozone layer. He teaches at the University of California at San Diego, and at the National Autonomous University in Mexico.
Veerabhadran Ramanathan is a 2018 TANG laureate, 2013 UN Champion of Earth and distinguished professor of climate sciences at the University of California, San Diego.
Durwood J. Zaelke is founder and president of the Institute for Governance & Sustainable Development in Washington, DC and Paris, and co-directs a related program at UC Santa Barbara.
... the report [IPCC SR15], dire as it is, misses a key point: Self-reinforcing feedbacks and tipping points—the wildcards of the climate system—could cause the climate to destabilize even further. The report also fails to discuss the five percent risk that even existing levels of climate pollution, if continued unchecked, could lead to runaway warming—the so-called "fat tail” risk. These omissions may mislead world leaders into thinking they have more time to address the climate crisis, when in fact immediate actions are needed. To put it bluntly, there is a significant risk of self-reinforcing climate feedback loops pushing the planet into chaos beyond human control.
Adding 50 percent more warming to reach 1.5 degrees won’t simply increase impacts by the same percentage—bad as that would be. Instead, it risks setting up feedbacks that could fall like dangerous dominos, fundamentally destabilizing the planet. This is analyzed in a recent study showing that the window to prevent runaway climate change and a "hot house” super-heated planet is closing much faster than previously understood.
These cascading feedbacks include the loss of the Arctic’s sea ice, which could disappear entirely in summer in the next 15 years. The ice serves as a shield, reflecting heat back into the atmosphere, but is increasingly being melted into water that absorbs heat instead. Losing the ice would tremendously increase the Arctic’s warming, which is already at least twice the global average rate. This, in turn, would accelerate the collapse of permafrost, releasing its ancient stores of methane, a super climate pollutant 30 times more potent in causing warming than carbon dioxide.
By largely ignoring such feedbacks, the IPCC report fails to adequately warn leaders about the cluster of six similar climate tipping points that could be crossed between today’s temperature and an increase to 1.5 degrees—let alone nearly another dozen tipping points between 1.5 and 2 degrees. These wildcards could very likely push the climate system beyond human ability to control. As the UN Secretary General reminded world leaders last month, "We face an existential threat. Climate change is moving faster than we are.… If we do not change course by 2020, we risk missing the point where we can avoid runaway climate change, with disastrous consequences….”
The report notes that there are historic precedents for the speed we need, although not for the scale of required mitigation. But the United States’ World War II industrial mobilization provides an encouraging precedent: Only three-and-a-half years elapsed between Pearl Harbor and D-Day. Our economies have a remarkable ability to adapt quickly with the right policies. So neither fatalism nor despair are warranted, but rather a sense of urgent, or even running-scared, optimism.
Consensus Study Reports published by the National Academies of Sciences, Engineering, and Medicine document the evidence-based consensus on the study’s statement of task by an authoring committee of experts. Reports typically include findings, conclusions, and recommendations based on information gathered by the committee and the committee’s deliberations. Each report has been subjected to a rigorous and independent peer-review process and it represents the position of the National Academies on the statement of task.
Negative emissions technologies (NETs) that aim to remove and sequester excess carbon from the atmosphere have been identified as an important part of the portfolio of responses to climate change. These approaches have been garnering new attention as the international community has identified lower thresholds for global temperature increases, which can only be accomplished with net negative carbon emissions to the atmosphere. This new report aims to develop a detailed research and development agenda needed to assess the benefits, risks, and sustainable scale potential for carbon dioxide removal and sequestration approaches; and increase their commercial viability.
Several land-based negative emissions technologies are ready for large-scale deployment at costs competitive with emissions mitigation strategies. However, these existing options cannot provide the amount of negative emissions needed to meet climate goals without unprecedented changes in land use that could affect food availability and biodiversity.
Past emissions alone are unlikely to raise global-mean temperature to 1.5°C above pre- industrial levels but past emissions do commit to other changes, such as further sea level rise (high confidence). If all anthropogenic emissions (including aerosol-related) were reduced to zero immediately, any further warming beyond the 1°C already experienced would likely be less than 0.5°C over the next two to three decades (high confidence), and likely less than 0.5°C on a century timescale (medium confidence), due to the opposing effects of different climate processes and drivers. A warming greater than 1.5°C is therefore not geophysically unavoidable: whether it will occur depends on future rates of emission reductions. {1.2.3, 1.2.4}
1.5°C-consistent emission pathways are defined as those that, given current knowledge of the climate response, provide a one-in-two to two-in-three chance of warming either remaining below 1.5°C, or returning to 1.5°C by around 2100 following an overshoot.
There is no single answer to the question of whether it is feasible to limit warming to 1.5°C and adapt to the consequences.
Störfallbeschreibung von Helmut Mayer, der unter bestimmten Umständen sogar eine Explosion oder eine Kernschmelze für möglich hält
Der Diplom-Ingenieur Helmut Mayer ist unter anderem Dozent für Kraftwerkstechnik an der Dualen Hochschule Baden-Württemberg, war früher Betriebsleiter des Atomkraftwerks Biblis. Er hat Erfahrung mit Störfallanalysen. Er warnte schon 2014 vor den Folgen eines sogenannten Dampferzeuger-Heizrohr-Lecks (DEHL).
In seiner Störfall-Beschreibung kommt er zu dem Schluss, dass es im Extremfall zu Explosionen und einer Kernschmelze kommen könne. Dies ist seiner Darstellung nach dann möglich, wenn am Ende einer Reihe von Fehlfunktionen die Hauptkühlpumpe ausfällt und die Konzentration von Bor, einem die Kettenreaktion bremsenden Element, im Primärkreislauf zu gering wird. Dann könnte der Reaktor weiter laufen, obwohl die Abschaltstäbe eingefahren sind.
Franz Wagner von der AG AtomErbe Neckarwestheim und Matthias Weyland von der Anti-Atom-Organisation .ausgestrahlt erklärten am 31. Oktober 2018:
"Das AKW Neckarwestheim-2 ist offensichtlich Schrott. Mehr als hundert Heizrohre in zwei von vier Dampferzeugern des Reaktors sind rissig. Weder EnBW noch die Atomaufsicht können bisher sagen, wann diese Risse entstanden und wie schnell sie gewachsen sind. Sie können deshalb auch nicht ausschließen, dass in den kommenden Monaten neue Risse entstehen und gefährlich wachsen. Umweltminister Untersteller darf ein AKW mit solchen Materialproblemen nicht wieder ans Netz lassen!
Reißt auch nur ein einziges der mehr als 16.000 Heizrohre des Reaktors im Betrieb ab, ist das bereits ein schwerer Störfall. Die Gefahr, dass die dann unter hohem Druck umherschlagenden losen Rohrenden weitere benachbarte Rohre beschädigen, ist groß – insbesondere, wenn diese Rohre ebenfalls bereits Risse aufweisen. Schlägt so ein weiteres Heizrohr leck, ist der Störfall auslegungsüberschreitend und nach offiziellen Angaben nicht mehr sicher beherrschbar. Selbst eine Kernschmelze ist dann nicht mehr ausgeschlossen.
Nach Angaben von EnBW wurden die beiden von Rissen betroffenen Dampferzeuger (Nr. 20 + 40) zuletzt 2014 überprüft. Demnach könnten die vor kurzem entdeckten Risse irgendwann in den vergangenen vier Jahren entstanden sein, genausogut aber auch erst in den vergangenen vier Monaten – ohne dass sie jemand entdeckt hätte. Spannungsrisskorrosion, um die es hier geht, tritt unvorhersehbar auf – und die Risse können spontan schnell wachsen. An manchen Stellen waren die Rohrwände nur noch 0,1 Millimeter dick. Zusätzlich sind nach Angaben des Umweltministeriums 23 weitere Rohre neu von Lochfraß betroffen, davon 18 an den beiden erst 2017 überprüften Dampferzeugern (Nr. 10 + 30).
Wie schon im vergangenen Jahr einfach die beschädigten Rohre zu verstopfen und den Reaktor dann wieder zu starten, wie EnBW es vorhat, nimmt weitere Risse und weiteren Lochfraß billigend in Kauf. Damit darf Umweltminister Untersteller den Energiekonzern nicht noch einmal durchkommen lassen. Bis die Ursache sowohl der Risse als auch des Lochfraßes an den Rohren eindeutig geklärt und behoben ist, darf der Reaktor nicht wieder ans Netz. Die Sicherheit der Bevölkerung muss Vorrang haben vor den Profitinteressen von EnBW."
Ellen Brown is an attorney, chairman of the Public Banking Institute, and author of twelve books including "Web of Debt" and "The Public Bank Solution."
Renewable energy in Germany is mainly based on wind, solar and biomass.
Renewables generated 41% of the country’s electricity in 2017, up from just 6% in 2000; and
public banks provided over 72% of the financing for this transition.
In 2007-09, KfW funded all of Germany’s investment in Solar Photovoltaic.
... One of the key features of KfW, as with other development banks, is that much of its lending is driven in a strategic direction determined by the national government. Its key role in the green energy revolution has been played within a public policy framework under Germany’s renewable energy legislation, including policy measures that have made investment in renewables commercially attractive. ...
KfW is one of the world’s largest development banks, with assets totaling $566.5 billion as of December 2017. Ironically, the initial funding for its capitalization came from the United States, through the Marshall Plan in 1948. ...
KfW is not only one of the biggest financial institutions but has been ranked one of the two safest banks in the world. (The other, Switzerland’s Zurich Cantonal Bank, is also publicly owned.) KfW sports triple-A ratings from all three major rating agencies—Fitch, Standard and Poor’s, and Moody’s. The bank benefits from these top ratings and the statutory guarantee of the German government, which allow it to issue bonds on very favorable terms and therefore to lend on favorable terms, backing its loans with the bonds.
Zeitraum von 2023 bis 2030
Der Klimaschutzplan 2050 sieht für die Energiewirtschaft
bis zum Jahr 2030 vor, die Treibhausgasemissionen um 61 bis 62 % gegenüber 1990 auf 175 bis 183 Mio. t CO2eq zu reduzieren.
Um dies zu erreichen, ist ein deutlicher Rückgang der installierten Leistung der am Markt agierenden Kohlekraftwerke erforderlich. Dazu sollen Braunkohlekraftwerke und Steinkohlekraftwerke den Markt verlassen, so dass sich die Leistung der Kohlekraftwerke im Markt (ohne Reserve) im Jahr 2030 auf maximal
9 GW Braunkohle und
8 GW Steinkohle verringert.
Das entspricht im Vergleich zu 2017 einem gesamten Rückgang von
10.9 GW bei Braunkohlekraftwerken und
14.7 GW Steinkohlekraftwerken.
... Gemäß Klimaschutzplan 2050 soll der Ausstoß von Treibhausgasen
im Jahr 2040 um 70% und
im Jahr 2050 um 80 bis 95% [im Vergleich zu 1990]
reduziert werden. Dazu müssen auch nach 2030 die Emissionen in der Energiewirtschaft weiter reduziert werden. ...
Als Abschlussdatum für die Kohleverstromung
empfiehlt die Kommission Ende des Jahres 2038.
Sofern die energiebetriebswirtschaftlichen Voraussetzungen vorliegen, kann das Datum in Verhandlungen mit den Betreibern auf frühestens 2035 vorgezogen werden.
Die Überprüfung, ob dies möglich ist, erfolgt im Jahr 2032 ("Öffnungsklausel"). Diese Überprüfung umfasst auch, ob die Annahmen für die Beendigung der Kahleverstromung insgesamt realistisch sind.
Das Abschlussdatum für die Kohleverstromung sollte im Jahr 2026 und 2029 einer umfassenden Überprüfung durch ein unabhängiges Expertengremium hinsichtlich der Auswirkungen auf die Erreichung der Klimaziele, der Entwicklung der Strompreise und die Versorgungssicherheit, der Beschäftigung, der strukturpolitischen Maßnahmen sowie der regionalen Wertschöpfung unterzogen und gegebenenfalss angepasst werden (vgl. Kapitel 6). Ein ggf. notwendiger Eingriff in Eigentumsrechte ist in diesem Zusammenhang ebenfalls zu berücksichtigen.
Sondervotum der Kommissionsmitglieder Martin Kaiser, Prof. Dr. Kai Niebert, Prof. Dr. Hubert Weiger und Antje Grothus
Die unterzeichnenden Kommissionsmitglieder tragen den im Kommissionsergebnis gefundenen Kompromiss zum Ausstieg aus der Kohleverstromung mit, um den klimapolitischen Stillstand Deutschlands der letzten Jahre zu durchbrechen. Das Ergebnis bedeutet
die kurzfristige stetige Abschaltung in den Jahren 2019, 2020, 2021 und 2022 von über einem Viertel der installierten Kohlekraftwerkskapazität.
Die unterzeichnenden Mitglieder haben zu Beginn der Kommissionsarbeit festgehalten, dass ein klimaphysikalisch tragfähiger Ausstiegspfad Leitlinie ihrer Mitarbeit ist. Wir stellen fest, dass weder das anvisierte Ausstiegsdatum 2038 noch der unkonkrete Pfad bis 2030 ausreichend sind, um einen angemessenen Beitrag des Energiesektors zum Klimaschutz zu leisten. Beides können wir entsprechend nicht mittragen.
Sowohl der nicht konkretisierte Pfad ab 2023
als auch das zu späte Ausstiegsdatum
verhindern über die Jahre eine kumulierte CO2-Reduktion des Energiesektors, die mit dem Pariser Klimaabkommen vereinbar wäre. Im Gegenteil sind kumulierende CO2-Emissionen in der Atmosphäre viel zu hoch, als dass Deutschland seinen Beitrag zur Begrenzung der globalen Erwärmung auf maximal 2 Grad, geschweige denn 1,5 Grad, leisten könnte. Damit hat die Kommission eine große Chance verpasst, ambitionierten Klimaschutz mit einer zukunftsfähigen Regionalentwicklung und Wirtschaftsentwicklung zu vereinen.
Eine klare Beschreibung des stetig zu gestaltenden Ausstiegspfads von 2023–2029 ist dringend notwendig. Er kann und muss zu einem späteren Zeitpunkt von der Bundesregierung entlang der im Kommissionsbericht festgeschriebenen Stetigkeit für die Abschaltungen festgelegt werden. Wir stimmen mit diesem Minderheitenvotum gegen das Fehlen weiterer konkreter Jahresschritte im Zeitraum 2023–2030 und werden uns zu einem späteren Zeitpunkt dafür einsetzen, diese Lücke zu schließen. Auch ist das zu späte Ausstiegsdatum aus klimapolitischer Sicht für uns nicht tragbar. Im Sinne des Klimaschutzes notwendig wäre ein Ausstieg bis 2030.
Trotz dieses Sondervotums gegen die beiden genannten Punkte tragen wir das Gesamtergebnis mit, da zum einen ein klarer Einstieg in den Ausstieg bis 2022 mit konkretem Handlungsauftrag an die Bundesregierung für die Abschaltung von Kohlekraftwerken zwischen 2019 und 2022 sowie der Erhalt des Hambacher Waldes ausgehandelt wurde. Zum anderen werden die geplanten Strukturmaßnahmen und der geplante Ausbau der erneuerbaren Energien schon in wenigen Jahren die Diskussion verändern.
"Der Kompromiss der Kohlekommission hat jedoch einen Haken: Die Kohleindustrie hat die Geschwindigkeit beim Kohleausstieg soweit gebremst, dass sie nicht mit den Pariser Klimazielen zu vereinbaren ist.
Wenn die Bundesregierung diesen Kompromiss nun in ein Kohleausstiegsgesetz gießt, muss sie sicherstellen, dass das Ausstiegstempo im Sinne des Pariser Klimaabkommens nachgeschärft werden kann.
Wir haben noch viel zu tun, bis sichergestellt ist, dass die Erderhitzung bei 1,5 Grad gebremst werden kann. Greenpeace hat dem halbgaren Kompromiss der Kohlekommission nur deshalb zugestimmt, weil wir es uns nicht leisten können, weitere kostbare Zeit beim Klimaschutz zu verlieren. Selbst diese ersten Schritte haben wir der Kohlelobby nur durch den enormen Druck der wachsenden Klimabewegung abringen können. Deshalb ist es umso wichtiger, dass die Klimabewegung stark bleibt und weiter wächst."
... Wenn die Staaten nach Wirksamwerden des Investitionsschutzkapitels aus CETA Gesetze erlassen, können die Konzerne dadurch nicht erzielte Gewinne, ja sogar die nicht realisierbaren künftigen Gewinnerwartungen von den Staaten vor Sondergerichten einklagen. ... Wird hier z.B. der Verbrauch fossiler Energie gesetzlich behindert, können ausländische Konzerne dies als Handelshemmnis beklagen, sich ihre dann nicht mehr realisierbaren Gewinne von uns erstatten lassen. Würde gleiches Recht für alle gelten, müssten dann auch Bürger den Staat verklagen können, wenn ihnen Schaden durch staatliche Maßnahmen entstehen.
... JEFTA enthält zahllose Rechtsbrüche in vielen wichtigen Bereichen (Grundgesetz, EU-Recht, Völkerrecht). Mit JEFTA will man die strikte Marktliberalisierung (Neoliberalismus), durchsetzen. Deshalb werden sehr viele wichtige Problemfelder unserer Zeit in unserer Klageschrift zu JEFTA genannt.
Die Klage gegen JEFTA vor dem Bundesverfassungsgericht verteidigt zahlreiche Bereiche des Gemeinwohls, die Rechte und Interessen der BürgerInnen wie das Recht
auf Arbeitsschutz,
auf Naturschutz,
auf Umweltschutz,
auf Klimaschutz,
auf soziale Absicherung,
auf Mindestlohn,
auf gerechten Lohn,
auf Teilhabe am gesellschaftlich erarbeiteten Reichtum,
auf bezahlbaren Wohnraum,
auf Gesundheitsvorsorge,
auf Bildung,
auf Kultur,
auf Rechtsschutz,
auf ein unabhängig arbeitendes Parlament,
auf die Einbettung in einem sozialen Rechtsstaat und
auf den Fortbestand der sozialen Marktwirtschaft etc.
Die Entmachtung der Parlamente mit Hilfe von JEFTA wird durch die Bildung von in dem Vertrag vorgesehenen Ausschüssen bewirkt. Diese Ausschüsse können ohne jede parlamentarische Mitwirkung und Kontrolle Beschlüsse fassen, die dann von den Staaten vollzogen werden müssen.
Die Macht der Ausschüsse geht so weit, dass sie sogar den Vertrag ohne den Einfluss von Parlamenten verändern können. Die in JEFTA vereinbarte Macht der Ausschüsse bewirkt, dass die Regeln in unserer Gesellschaft nicht mehr wie im Grundgesetz vorgesehen, von Parlamenten demokratisch bestimmt, sondern von Kapitalinteressen dominiert werden. Dadurch wird das demokratische Gemeinwesen mit seiner Rechtsordnung außer Kraft gesetzt und selbst die Gemeinden sind nicht mehr in der Lage, ihre demokratischen und sozialen Aufgaben frei zu erfüllen. Sie können diese Zusammenhänge und Wirkungen in unserer Klage auf der Seite 85 im Kapitel "Verfassungswidrige Kompetenzübertragung auf Ausschüsse durch JEFTA" ausführlicher lesen.
Interview mit Prof. Dr. iur. et phil. Alfred de Zayas. Zeit-Fragen > 2015 > Nr. 18, 7. Juli 2015 (Druckversion)
... Bei TPP, TTIP oder TiSA geht es nicht nur darum, diese Verträge abzulehnen. Es geht darum, das gesamte System, das in den letzten 30 Jahren zustande gekommen ist, zu reformieren, und zwar von Grund auf. Die Verträge sind das eine, das andere ist der damit verbundene Verlust an demokratischer Rechtsstaatlichkeit. ... Rechtsstaatlichkeit bedeutet Transparenz und Verantwortung, sie setzt eine offene Diskussion voraus. Hier wurde ein Vertrag im Geheimen verhandelt, wobei Menschenrechtsexperten, Umweltschutzexperten, Gesundheitsexperten ausgeschaltet wurden – denn sie durften nicht am Zustandekommen des Vertrages teilnehmen. Und gerade um jegliche Diskussion im Parlament auszuschalten, sollte gerade dieser Geheimvertrag ohne Debatte im Parlament durch «fasttracking» als fait accompli dastehen. ...
Die grossen transnationalen Konzerne haben eine gewisse Revolution gegen die Staatsauffassung des Westfälischen Friedens eingeleitet. Die Idee beinhaltet eine Abwendung vom Rechtsstaat, weg von der staatlichen Gerichtsbarkeit, an der die Welt seit 200 Jahren arbeitet, um Rechtssicherheit herzustellen und um Institutionen zu entwickeln, die es ermöglichen, gegen Rechtsverstösse vorzugehen. Das wird durch die Einführung solcher Schiedsgerichte, wie sie in diesen Verträgen vorgesehen sind, nicht mehr möglich sein und unterläuft letztlich unser demokratisches Rechtssystem. ...
Was muss man sich unter den Schiedsgerichten vorstellen?
Als erstes einmal sind sie geheim. Es gibt in diesem System weder Transparenz noch gibt es die Möglichkeit, die «Richter» zur Rechenschaft zu ziehen. Die Konzerne haben sich eine separate, nicht demokratisch legitimierte Gerichtsbarkeit eingerichtet und das Prinzip des Westfälischen Staates ausgeschaltet.
Das heisst, mit diesen Verträgen wird der souveräne Nationalstaat mit seiner staatlichen Rechtsordnung ausser Kraft gesetzt.
Ja. Es gibt hier zwei Ontologien, die man hier beachten muss.
Die Ontologie des Staates definiert, weshalb ein Staat überhaupt existiert. Der Staat ist eine organisierte Gesellschaft, die sich selbst legitimiert, dadurch, dass der Staat die Gesetzgebung zum Schutze der Interessen des Volkes übernimmt.
Die zweite Ontologie ist die Ontologie des Marktes, die Ontologie des Business, des Geschäftes. Wenn ich investiere, wenn ich Geschäftsmann bin, wenn ich für eine transnationale Gesellschaft arbeite, erwarte ich auch einen Profit. Dafür muss ich auch ein Risiko eingehen. Die Ontologie des Kapitalismus heisst, ein Risiko einzugehen.
Durch diesen investor state dispute settlement mechanism, durch diese neue Schiedsgerichtsbarkeit, die eigentlich keine Gerichte sind, sondern private Schiedsgerichte, hat man ein völlig korruptes System etabliert.
Wie funktionieren diese Gerichte: Die Richter sind meistens Anwälte von grossen Konzernen ...
... [Die] Schiedsgerichtsbarkeit ... ist völlig gegen bonos mores, gegen die guten Sitten. Die Bezeichnung contra bonos mores ist die völkerrechtliche Bezeichnung für Verträge oder für Kontrakte, die gegen das bonum commune, also gegen das Allgemeinwohl, gegen das Interesse der Gesellschaft verstossen. Solche Verträge, die contra bonos mores sind, sind gemäss Artikel 53 der Wiener Vertragsrechtskonvention nichtig. ...
Ich habe zwei Hauptanliegen.
Es muss erkannt werden, dass die Uno-Charta weltweit anerkannte Massstäbe festsetzt. Die Uno-Charta garantiert die Souveränität des Staates. Die Uno ist überhaupt auf der Basis der Souveränität von Staaten aufgebaut worden. Die Einmischung in die inneren Angelegenheiten von Staaten, das heisst, die Möglichkeit des Staates über die Höhe und den Gebrauch der Steuern zu bestimmen und zu entscheiden, sind ontologische oder wesentliche Aufgaben des Staates. Diese Dinge werden in Artikel 1 und 2 der UNO-Charta festgeschrieben.
Artikel 55 und 56 schreiben die Menschenrechte fest. Wenn ein Vertrag diese Artikel verletzt oder dieser inkompatibel mit diesen ist, hat die Charta den höheren Rang. ...
... Was heisst das jetzt konkret für diese unlauteren Verträge, die gegen die guten Sitten, Treu und Glauben, das demokratische Prinzip und damit gegen das Gemeinwohl sowie die Menschenrechte verstossen?
Die Lösung liegt im Internationalen Gerichtshof. Die Staaten, die in der Generalversammlung sitzen, müssen vom internationalen Gerichtshof in Den Haag verlangen, dass ein Gutachten erstellt wird, das genau das erkennt und dann deutlich den Staaten sagt, dass sie keine Verträge eingehen können, die gegen die UNO-Charta verstossen. Alle diese bilateralen und multilateralen Handelsverträge, TTP, TTIP usw. sowie die 3000 bilateralen Verträge, die schon existieren, müssen fallen, beziehungsweise jene Teile, die gegen die Charta verstossen, müssen abgeschnitten werden (Prinzip der Severability). Aber das muss initiiert werden. Der Internationale Gerichtshof wird nicht motu proprio aktiv, er beginnt keinen Prozess von sich aus. Jemand muss die Initiative ergreifen und die Dinge dem internationalen Gerichtshof vorgelegen.
Wer könnte das tun?
Die Uno-Generalversammlung nach Art. 96 der Charta, aber nicht ausschliesslich. Es gibt noch andere Gremien, die genau dieselbe Möglichkeit haben wie zum Beispiel die Internationale Arbeitsorganisation, die ILO, die Weltgesundheitsorganisation, die WHO, das Kinderhilfswerk, die Unicef, die Ernährungs- und Landwirtschaftsorganisation der Uno, die FAO, und weitere. Alle diejenigen, die die Konsequenzen schon heute erkennen können.
Die Konsequenzen dieser Verträge sind eine Verletzung des Arbeitsrechtes, Verletzungen des Rechtes auf Gesundheit, des Rechtes auf Umweltschutz, des Rechts aufs Leben, denn oft genug werden diese grossen Projekte von internationalen Gesellschaften durchgeführt, die dann dazu führen, dass Menschen alles verlieren, in den Selbstmord getrieben werden oder verhungern. In meinem Bericht an den Menschenrechtsrat wird das alles dargelegt und zur Diskussion gestellt.
...
Renommierter Preis für Klimaforschung geht an zwei US-Wissenschaftler
Deutschlandfunk, Umwelt und Verbraucher, 13.2.2019
Darin kommt Michael Mann zu Wort, dem es Ende der 1990er Jahre gelang, den historischen Zeitraum für Klimadaten auf 1000 Jahre auszudehnen. Dabei fand er den als "Hockey-Stick" bezeichneten Anstieg der globalen Lufttemperaturen in den letzten 100 Jahren. Sein Forschungsergebnis ist so spektakulär und anschaulich und hatte solch ein Aufsehen erregt, dass er einem breiten Spektrum von Behinderungen und Drohungen ausgesetzt war, bis hin zu Morddrohungen (wie im Deutschandfunk-Interview zu hören ist).
Michael E. Mann, Raymond S. Bradley, Malcolm K. Hughes
First published: 15 March 1999
https://doi.org/10.1029/1999GL900070
Fig. 9: Northern Hemisphere average surface air temperature change from 5 Tg (red), 50 Tg (green), and 150 Tg (brown) cases in the context of the climate change of the past 1000 years. The "hockey stick" nature of the curve is barely discernible when plotted on this scale. Black curve is from Mann et al. [1999], and the blue curve is from the latest data from the Climatic Research Unit website.
Mann, M. E., R. S. Bradley, and M. K. Hughes (1999), Northern Hemisphere temperatures during the past millennium: Inferences, uncertainties, and limitations, Geophys. Res. Lett., 26, 759–762.
Der Absturz der Lufttemperaturen in der obigen Abbildung kommt durch den nuklearen Winter, zu dem Robock et al. Rechnungen gemacht haben, der durch thermonuklear erzeugte Feuerstürme herbeigeführt wird. Sie befördern Rauch in die Stratosphäre, welcher die Sonnenstrahlen blockiert. Robock et al. haben Berechnungen für 3 thermonuklear erzeugte Rauchmengen gemacht: 5 10^12, 50 10^12 und 150 10^12 Gramm. Man nimmt an, dass die im thermonuklearen Krieg aufsteigende Rauchmenge in diesem Bereich liegen wird.
Die Welt brauche konkrete Maßnahmen zur Verringerung der Treibhausgase; und sie brauche diese Maßnahmen nicht irgendwann, sondern jetzt, forderte Edenhofer. In dieser Hinsicht könne der Klimawandel nicht mehr nur als das größte Marktversagen aller Zeiten angesehen werden. Er sei angesichts der steigenden Emissionen auch zu einem beispiellosen Staatsversagen geworden.
Der Veränderungsbedarf ist gewaltig – auch in der Wirtschaft. "Der Druck auf die Unternehmen steigt, sich fossilfrei oder zumindest fossilarm aufzustellen", sagte Edenhofer.
"Die dringend notwendige Steigerung des Ambitionsniveaus ist im Wesentlichen ausgeblieben, und beim Regelbuch haben wir nur ein Minimum erreicht", kritisierte Edenhofer. Johan Rockström, der zusammen mit Edenhofer als designierter Direktor das PIK leitet, sagte, es sei in Kattowitz versäumt worden, "klarzumachen, dass die globalen Emissionen aus fossilen Brennstoffen bis 2030 halbiert werden müssen, wenn man dem 1,5-Grad-Report des Weltklimarats folgen will".
... die schwierigen Diskussionen, Kohlendioxid (CO2) weltweit einen Preis zu geben.
Dieses Thema musste in Kattowitz vertagt werden. "Globale Regeln für CO2-Preise und passende Marktinstrumente haben es leider nicht in das Regelbuch geschafft", sagte Tillmann.
Das mache es für Unternehmen in Europa sehr viel schwieriger, die Investitionen in treibhausgasärmere Technologien zu stemmen. Er hoffe jetzt auf Fortschritte auf der Ebene der 20 größten Volkswirtschaften.
... The carbon tax was introduced in 1991 at a rate corresponding to SEK 250 (EUR 24) per tonne fossil carbon dioxide emitted, and has gradually been increased to SEK 1 180 (EUR 114) in 2019 (currency conversion based on an exchange rate of SEK 10.33 per EUR). By increasing the tax level gradually and in a stepwise manner, households and businesses have been given time to adapt, which has improved the political feasibility of tax increases. A lower tax rate has historically been applied to industry outside the EU Emissions Trading System (EU ETS), while industry covered by the system is entirely exempt from carbon tax. As of 2018, however, the industry rate outside the EU ETS is the same as the general rate.
Sweden's carbon tax generates considerable revenues for the general budget (there is no 'earmarking' of tax revenues in Sweden). General budget funds may, however, be used for specific purposes linked to the carbon tax, such as addressing undesirable distributional consequences of taxation or financing other climate-related measures. ...
a. Wenn Sie im Team mitarbeiten möchten:
Bitte bei target="new">mitmachen@scientists4future.org melden!
b. Thematische Arbeitsgruppe S4F-Talks: Entwicklungen von Präsentationen, Erzählungen, Grafiken für Präsentationen oder Fact-Sheets. Mitglieder von FFF, welche Präsentationen vorbereiten, werden hier mit S4F zusammenarbeiten.
ANMELDUNG: E-Mail an S4F-Talks-SUBSCRIBE@lists.fu-berlin.de
(ABMELDUNG: E-Mail an S4F-Talks-UNSUBSCRIBE@lists.fu-berlin.de)
c. Thematische Arbeitsgruppe S4F-Fact-Checking: Mitglieder prüfen bei Bedarf Fakten, Behauptungen oder Annahmen, bzw. weisen bei Unklarheiten auf die Notwendigkeit des Belegs durch wissenschaftliche Arbeiten hin.
ANMELDUNG: E-Mail an S4F-Fact-Checking-SUBSCRIBE@lists.fu-berlin.de
(ABMELDUNG: E-Mail an S4F-fact-checking-UNSUBSCRIBE@lists.fu-berlin.de)
d. Thematische Arbeitsgruppe S4F-Kreativ: Mitglieder entwickeln neue kreative Ideen, Designs, Flyer, etc..
ANMELDUNG: E-Mail an S4F-Kreativ-SUBSCRIBE@lists.fu-berlin.de
(ABMELDUNG: E-Mail an S4F-Kreativ-SUBSCRIBE@lists.fu-berlin.de)
e. Kooperation mit "Ring a scientist”: Auf www.ring-a-scientist.org können Wissenschaftler und Unterzeichner kontaktiert werden, die für Webvideokonferenzen innerhalb und außerhalb des Unterrichts zur Verfügung stehen. Man muss dafür nicht persönlich erscheinen, sondern kann sich einfach per Videokonferenz zuschalten lassen. Damit kann man Schulen in ganz Deutschland erreichen. Alle die Interesse daran haben, sich hierüber weiter einzusetzen schreiben eine leere Mail an: s4f-ringascientist-subscribe@lists.riseup.net
Der Klimawandel (Mittelstufe)
Gemeinsame Folienvorlagen / Factsheets von (Mitte lstufe) Fridays for Future und Scientists 4 Future
2017 hat China 53 GW Solar-Kapazität (Photovoltaik) installiert, Deutschland 1,7 GW. Um Pariser Klimaziele zu erreichen, müsste Deutschland ca. 15 GW/Jahr installieren. Das wären 28 % der chinesischen Installationsleistung.
Deutsches Bruttoinlandsprodukt: ca. 31 % des chinesischen.
Annual global temperature change (thin light red) with 11 year moving average of temperature (thick dark red). Temperature from NASA GISS. Annual Total Solar Irradiance (TSI; thin light blue) with 11 year moving average of TSI (thick dark blue). TSI from 1880 to 1978 from Krivova et al (2007). TSI from 1979 to 2009 from PMOD
Strahlungsantrieb (engl. radiative forcing) ist ein Maß für die Energiebilanz der Erde durch die von außen einwirkende Strahlung und wird in W/m2 gemessen. Der Begriff radiative forcing bzw. climate forcing wurde vom IPCC eingeführt, um im Rahmen der Klimastudien den Einfluss externer Faktoren auf die Strahlungsbilanz bzw. das Klimasystem der Erde zu beschreiben.
Nächstes Jahr könnte das Fallbeil für den Ausbau der Photovoltaik fallen: Erreicht die installierte Photovoltaikleistung 52 Gigawatt = 47 TWh, sinkt die Vergütung für eingespeisten Solarstrom bei neuen Photovoltaikanlagen auf null. ... Nur mit einem schnellen Ausbau erneuerbarer Energien lässt sich das Pariser Klimaschutzabkommen noch einhalten, die globale Erwärmung auf 1,5°C begrenzen. Dafür darf es keine neuen Kürzungen bei der Photovoltaik mehr geben. Eine stichhaltige Begründung dafür gibt es nicht. Denn neue Photovoltaikanlagen sind inzwischen so preiswert geworden, dass auch ein massiver geförderter Ausbau keine spürbaren Kostensteigerungen für die Allgemeinheit mehr verursachen wird. ... Der 52-Gigawatt-Deckel bedroht nicht nur Photovoltaikunternehmen in Deutschland, die sich nach einem beispiellosen Verlust von 80 000 Arbeitsplätzen in den letzten Jahren gerade wieder anfangen zu erholen. Der Deckel torpediert vielmehr sämtliche Klimaschutzbemühungen und damit die Interessen und die Lebensgrundlagen der jungen Generation.
... "There is no time to despair,” he said. "We should be hopeful that we have a window of opportunity to do something about it over these two years.”
... Watson, a British professor who has headed both [climate and biodiversity] of the UN’s leading scientific panels, said the forthcoming report will delve more deeply than anything before into the causes of nature collapse,
chief among which is the
conversion of forests, wetlands and other wild landscapes into ploughed fields,
dam reservoirs and
concrete cities.
Three-quarters of the world’s land surface has been severely altered, according to the leaked draft.
Humanity is also decimating the living systems on which we depend by emitting carbon dioxide and spreading invasive species.
... The goal is to persuade an audience beyond the usual green NGOs and government departments. "We need to appeal not just to environment ministers, but to those in charge of agriculture, transport and energy because they are the ones responsible for the drivers of biodiversity loss,” he said.
A focus will be to move away from protection of individual species and areas, and to look at systemic drivers of change, including consumption and trade.
The political environment is changing in some countries due to overwhelming scientific evidence and increasing public concern about the twin crises of nature and climate, which have prompted more than 1 million students to strike from school and led to street protests by Extinction Rebellion activists in more than a dozen countries.
The UK parliament declared a climate emergency this week and the government’s chief climate advisory body recommended an accelerated plan to cut carbon emissions to zero by 2050. Until now, however, the nature crisis has been treated as far less of a priority. "Where are the headlines? Where are the emergency meetings?” asked the school strike founder, Greta Thunberg, in a recent tweet on the subject.
Extinction Rebellion activists said protests that blocked several London streets last month were as much aimed at the defence of nature as stabilising the climate. "They are two sides of the same destructive coin,” said Farhana Yamin, a coordinator of the movement who is also an environmental lawyer and formerly a lead author of the IPCC report.
"The work of the Intergovernmental Science-Policy Platform on Biodiversity and Ecosystem Services (IPBES) is as crucial as the work done by the IPCC on the 1.5-degree report. That is why Extinction Rebellion is demanding an end [to] biodiversity loss and a net-zero phaseout by 2025. We can’t save humanity by only tackling climate change or only caring about biodiversity.”
1. Paula Murray, We've 10 years to save the seas or life on earth will become impossible, GOES Foundation, Dec 23, 2018
A SCOTS environmental organisation has warned of the impending death of the world’s oceans – unless drastic action is taken to stop pollution and plastic waste being dumped in our seas. Edinburgh-based Global Oceanic Environmental Survey (GOES) Foundation fears the entire marine ecosystem could collapse within the next 25 years and the only way to avoid planetary disaster is to effect change now.
Das Klimaschutzziel 2020 ist wohl sicher gerissen, und so blicken aller Augen auf den nächsten Meilenstein: Im Jahr 2030, so hat es die Bundesregierung mehrfach bekräftigt, sollen 65 Prozent des Stromes aus erneuerbaren Quellen kommen, um so die Emissionen vorn Treibhausgasen zu senken. Nun hat der Bundesverband Erneuerbare Energien eine Szenariorechnung vorgelegt, aus der hervorgeht, wie viel Kraftwerksleistung installiert dafür werden müsste.
So werden 481 Terawattstunden erzeugt
Der BEE geht dabei von einem steigenden Stromverbrauch aus. Bis 2030 werde es zwar Stromeinsparungen und Effizienzen geben, heißt es in dem Szenario-Papier. Diese würden insbesondere durch zusätzliche Stromverbräuche für Wärmepumpen, Elektromobilität und PtX (Power-to-Gas, Power-to-Liquids) aber deutlich überkompensiert werden.
2017 wurden laut BEE 599 Terawattstunden verbraucht. 2030 würden aber 740 Terawattstunden benötigt. Für die Erfüllung des 65 Prozent-Zieles der Großen Koalition sind folglich 481 TWh Strom aus erneuerbaren Energien im Jahr 2030 erforderlich.
Mit den heutigen Bedingungen und Ausbauzielen schafft Deutschland nur 44 Prozent
"Um im Jahr 2030 einen Anteil von 65 Prozent Erneuerbarer Energien zu erreichen, sind bessere Rahmenbedingungen erforderlich", kommentierte BEE-Präsidentin Simone Peter. "Unter Beibehalt der derzeitigen rechtlichen Gegebenheiten, die keine klaren Perspektiven für Planung und Investitionen bieten, wird Deutschland seinen Bruttostromverbrauch nur zu 44 Prozent aus Erneuerbaren Energien abdecken – mit negativen Implikationen für den Klimaschutz und für die innovative Erneuerbare-Energien-Industrie mit ihren zukunftsfähigen Arbeitsplätzen und ihrer enormen regionalen Wertschöpfung."
Dabei ginge deutlich mehr, so Peter: Aus Sicht des BEE könnte die Branche 2030 weit über 80 Prozent Ökostrom liefern, entsprechend ambitionierte Rahmenbedingungen vorausgesetzt. "Damit wäre dann auch ein deutlich höherer Beitrag zum Klimaschutz möglich, was der Zielsetzung des Pariser Klimaschutzabkommens näherkäme."
Windenergieausbau liegt am Boden
Vor allem aber in der Windenergie ist Deutschland derzeit weit entfernt von einem so starken Ausbau: Laut Fachagentur Windenergie an Land sind in den ersten drei Monaten 2019 lediglich 41 Windenergieanlagen mit einer Erzeugungskapazität von zusammen 134 MW neu ans Netz gegangen.
Fehlende Flächen, langsame Genehmigungsverfahren: Wenn die aktuelle Entwicklung bei der Windkraft so weitergehe, dann sei die Energiewende in Gefahr, sagte Patrick Graichen vom Thinktank Agora Energiewende im Dlf. Die Zahl der neuen Windräder müsse deutlich steigen.
... Graichen: Alle haben jetzt Angst vor den Windkraft-Gegnern, die sehr organisiert jetzt durch die Lande ziehen und mit sehr professionellem Rechtsbeistand da eine Klage nach der anderen über neue Genehmigungen erteilen. Insofern zieht sich das und die Genehmigungsbehörden sind eingeschüchtert.
... Graichen: Bei der Windkraft ist die Kostenentwicklung ja auch positiv vorangegangen. Anfang der 2000er waren wir ungefähr bei neun Cent die Kilowattstunde und heute liegen wir bei fünf bis sechs Cent die Kilowattstunde im Schnitt. Insofern: Wir haben ähnliche Preise inzwischen für Wind und Solar und wir brauchen auch beides für den Erfolg der Energiewende.
Potthoff (DLF): Ich habe eben schon gesagt, die Bundesregierung hat ja ambitionierte bekannte Ziele ausgegeben. Der Anteil erneuerbarer Energien soll bis zum Jahr 2030 auf 65 Prozent hochgeschraubt werden. Wie realistisch ist es derzeit denn, dass das klappt?
Graichen: Wir haben noch zehn Jahre. Insofern würde ich das Ziel noch nicht abschreiben. Aber ich brauche eine sehr aktive Bundesregierung,
die jetzt in diesem Jahr an das Thema Erneuerbare-Energien-Gesetz herangeht,
die für mehr Akzeptanz für Windräder sorgt,
indem man zum Beispiel eine kommunale Windabgabe macht, damit die Kommunen Geld davon haben,
indem man Bürgerenergie-Windparks fördert und
indem wir beim Thema Naturschutz und Klimaschutz bundesweite Leitlinien bekommen.
Projektionen des (Brutto-)Stromverbrauchs in aktuellen Energiesystemstudien (Fraunhofer-ISI Darstellung auf Basis von Nitsch 2016, Nitsch 2017, Öko-Insitut und Fraunhofer ISI 2015, DLR et al. 2012, Quaschning 2016, Enervis 2017, Fraunhofer IWES et al. 2015, IWES 2017, UBA 2014, Acatech 2017 sowie Fraun- hofer ISE 2015; fehlende Werte linear interpoliert)
GreenHydroChem« – mit Grünem Wasserstoff zur CO2-Reduktion beitragen
Zu den Gewinnern im Ideenwettbewerb »Reallabore der Energiewende« zählt »GreenHydroChem«. Das mit über 100 Megawatt weltweit größte Elektrolyse-Anlage-Projekt zur Erzeugung von Grünem Wasserstoff der Partner Siemens AG, Linde Aktiengesellschaft und Fraunhofer-Institut für Mikrostruktur von Werkstoffen und Systemen IMWS geht jetzt von der Planungs- in die Realisierungsphase über. Im Projekt demonstrieren die Partner die Erzeugung und Speicherung von Grünem Wasserstoff sowie dessen Anwendung in verschiedenen Nutzungspfaden im Rahmen der Sektorenkopplung. Das Vorhaben, das Siemens koordiniert, nutzt die Standortvorteile im Mitteldeutschen Chemiedreieck, das erstmals im industriellen Maßstab mit Grünem Wasserstoff versorgt wird. Dieser soll die anfallenden Treibhausgas-Emissionen signifikant verringern. »Green-Hydro-Chem Mitteldeutschland« wird bis 2024 in Leuna umgesetzt.
Reallabor GWP – Großwärmepumpen in Fernwärmenetzen
Wärmenetze sind ein wesentlicher Baustein für eine emissionsarme Wärmeversorgung. Großwärmepumpen zur Nutzung von Umwelt- und Abwärme spielen in deutschen Wärmenetzen bisher eine untergeordnete Rolle. Gemeinsam mit dem Energieeffizienzverband AGFW (Koordinator) und sechs weiteren Partnern untersucht das Fraunhofer-Institut für Solare Energiesysteme ISE im Siegerprojekt »Großwärmepumpen in Fernwärmenetzen – Installation, Betrieb, Monitoring und Systemeinbindung« von Januar 2020 bis Dezember 2024, welche wirtschaftlichen und regulatorischen Rahmenbedingungen und Betriebskonzepte für den effizienten Einsatz von Großwärmepumpen in Fernwärmenetzen erforderlich sind. Darüber hinaus untersucht das Konsortium, wie sich Großwärmepumpen für die übergeordnete Transformation der Wärme- und Strominfrastruktur nutzen lassen und somit einen wesentlichen Beitrag zur Sektorenkopplung leisten können. Dazu sollen fünf Großwärmepumpen mit unterschiedlichen Einbindungskonzepten, Wärmequellen und weiteren Spezifika in existierende Fernwärmenetze in Deutschland integriert werden. Das Fraunhofer ISE befasst sich in dem Projekt vor allem mit dem Monitoring der Großwärmepumpen hinsichtlich Energieperformance, Betriebsoptimierung und Emissionsreduzierung.
RefLau – Wasserstoff als chemischer Speicher
Im Reallabor Referenzkraftwerk Lausitz wird der Zweckverband Industriepark Schwarze Pumpe Schlüsseltechnologien der Energieversorgung mit erneuerbaren Energien und Wasserstoff als chemischem Speicher in der Praxis erproben und den Umbau zu einer CO2-neutralen, sektorübergreifenden Energieversorgung vorantreiben. Als Partner der Hochschule Zittau/Görlitz unterstützt das Fraunhofer-Institut für Werkzeugmaschinen und Umformtechnik IWU das Forschungsvorhaben. Das Referenzkraftwerk Lausitz mit einem 500 MWh Wasserstoffspeicher wird künftig Strom und Wärme für alle Sektoren bereitstellen. Ziel ist es, Wasserstoff für Verkehr und Industrie verfügbar zu machen und in das bestehende Erdgasnetz einzuspeisen. Zudem wollen die Partner gesetzliche und regulatorische Hürden, die einen wirtschaftlichen Betrieb bei der Kombination der verschiedenen Technologien erschweren, ermitteln und durch konkrete Anpassungen des regulatorischen Rahmens abbauen. Der Zweckverband Industriepark Schwarze Pumpe koordiniert das Vorhaben.
Norddeutsches Reallabor – Dekarbonisierung aller Verbrauchssektoren
Das Norddeutsche Reallabor zeichnet sich durch seinen gesamtsystemischen Ansatz aus und legt dabei den Fokus auf zwei Technologiebereiche, die großflächig, technologieoffen sowie markt- und realitätsnah erprobt werden sollen:
integrierte Sektorenkopplung mit Schwerpunkt Wasserstoff sowie
energieeffiziente Quartierslösungen vorrangig im Wärmebereich.
Die erfolgreichen Entwicklungen und bereits funktionsfähigen Lösungen des noch bis Ende 2020 laufenden Großprojekts NEW 4.0 – Norddeutsche EnergieWende bilden die Basis für das Norddeutsche Reallabor.
Um CO2 einzusparen, sollen Rückstände aus Raffinerien mit Grünem Wasserstoff weiterverarbeitet werden. Auch will das Konsortium untersuchen, wie sich das Beimischen von Wasserstoff in Erdgas-Brennern auswirkt. Um den Verkehrssektor systemisch einzubinden, sollen vermehrt Brennstoffzellen-Fahrzeuge genutzt und Wasserstofftankstellen gefördert werden. Für das Vorantreiben der Wärmewende wollen die Partner zudem die Abwärme einer Müllverbrennungs- sowie einer Industrieanlage mittels vorhandener Fernwärmeleitungen nutzbar machen.
Das Konsortium setzt sich aus 18 Verwertungspartnern und 30 weiteren Partnern aus Wirtschaft, Wissenschaft und Politik zusammen und wird vom Competence Center für Erneuerbare Energien und EnergieEffizienz (CC4E) der Hochschule für Angewandte Wissenschaften Hamburg koordiniert. Als wissenschaftlicher Partner bringt das Fraunhofer-Institut für Energiewirtschaft und Energiesystemtechnik IEE in Kassel seine Kompetenzen in der Energieinformatik und der Netzplanung ein. Zur Analyse und Demonstration des Gesamtsystems und der Wechselwirkungen verschiedener Betriebsführungen kommt die Test- und Simulationsplattform OpSim des Fraunhofer IEE zum Einsatz. OpSim ermöglicht es, Strom- und Gasnetz-Simulationen über einen Message-Bus zu koppeln und somit ein Multisparten-Energiesystem nachzubilden.
Die Energiegenossenschaften werden durch die Rahmenbedingungen derzeit vom großen Photovoltaik- und Windkraftgeschäft weitgehend ausgeschlossen. Selbst Nischen verschwinden zunehmend, die sie bisher noch besetzen konnten.
Die Bürgerbeteiligung an der Energiewende in Deutschland ist derzeit keine Selbstverständlichkeit. Die Wirtschaftsminister der vergangenen Bundesregierung haben immer wieder neue Steine gefunden, die sie den Bürgern in den Weg legen, damit diese sich möglichst nicht an der Energieerzeugung und Vermarktung beteiligen. Die jüngste Hürde ist mit dem Energiesammelgesetz gekommen.
Denn im vergangenen Jahr haben noch 71 Prozent der Energiegenossenschaften mit der Projektierung von Photovoltaikanlagen mit einer Leistung von bis zu 750 Kilowatt befasst. Das war bisher noch eine Nische, die die Energiegenossen gut und problemlos besetzen konnten, nachdem sie das Thema Ausschreibungen ad acta gelegt haben, weil das Risiko zu hoch ist, dass sie auf den Projektierungskosten sitzen bleiben, wenn sie keinen Zuschlag bekommen.
Energiesammelgesetz gefährdet Geschäftsmodelle
Doch mit den Sonderkürzungen der Einspeisevergütung für größere Solaranlagen, wie sie mit dem Energiesammelgesetz im vergangenen Jahr beschlossen wurde, kommt den Energiegenossenschaften auch dieses Segment zunehmend abhanden. Denn diese wirken sich zunehmend bei stabilen Systempreisen aufgrund der steigenden Nachfrage inzwischen aus. Nach Angaben des Deutschen Genossenschafts- und Raiffeisenverbandes (DGRV) ist die Zahl der Energiegenossenschaften, die solche kleinen 750-Kilowatt-Generatoren bauen, in diesem Jahr auf 54 Prozent gesunken. "Die Sonderkürzungen richten sich ausgerechnet gegen die Akteure, die für die Akzeptanz der Energiewende in der Bevölkerung sorgen", kritisiert Eckhard Ott, Vorstandsvorsitzender des DGRV, zu Recht. "Das kann politisch nicht gewollt sein."
Mieterstrom muss wieder attraktiver werden
Auch weitere Nischen, die Energiegenossenschaften perfekt besetzen könnten, gehen zunehmend verloren. Dazu gehöre Mieterstromprojekte, die sie zusammen mit Wohnungsgenossenschaften entwickeln. Diese kommen aber allgemein durch die Sonderkürzungen unter die Räder. Zwar hat Bundeswirtschaftsminister Peter Altmaier (CDU) dem Koalitionspartner SPD Ende Juni für Herbst dieses Jahres eine Novelle des Mieterstromgesetzes schriftlich zugesagt. Ob es dann auch einfacher für die Energiegenossenschaften wird, den Strom an die Mitglieder selbst zu vermarkten, steht in den Sternen. Denn genau das sei in Deutschland derzeit wirtschaftlich kaum umsetzbar, wie Eckhard Ott betont.
Die Energiegenossen müssen wohl jetzt noch ein paar Jahre überwintern,. Bis Geschäftsmodelle wie Mieterstromprojekte wieder attraktiver geworden sind. Dazu müsste aber auch das Körperschaftssteuergesetz noch einmal nachgebessert werden.
Hoffnung aus Brüssel
... Denkbar wären dann Sonderregelungen für Energiegenossenschaften bei den Ausschreibungen oder die Befreiung dieser von den Auktionen. Außerdem sollen der vor Ort verbrauchte Solar- und Windstrom nicht mehr steuerlich und abgabenrechtlich bestraft werden, wie das derzeit mit der EEG-Umlage auf Eigenverbrauch und Mieterstrom geschieht. Doch derzeit harrt die Richtlinie noch ihrer Umsetzung in nationales Recht. Die Bundesregierung hat dafür bis 2021 Zeit.
Branche für Onshore-Wind legt desaströse Halbjahreszahlen vor: Markt ist um 82 Prozent auf 287 MW zusammengebrochen.
"Das ist ein Schlag in die Magengrube der Energiewende. Das passt nicht zur Diskussion über den Klimawandel", ringt Matthias Zelinger nach Worten. Der Geschäftsführer VDMA Power Systems spricht über die Halbjahreszahlen der deutschen Onshore-Windbranche. Tatsächlich bleiben diese weit hinter dem bisherigen Niveau zurück. "Das ist eine Reduktion um 82 Prozent gegenüber 2018 - was auch schon ein schwaches Jahr war", merkt Knut Rehfeldt an, Geschäftsführer der Deutschen Windguard, die die Zahlen ausgewertet hat.
VDMA und Deutsche Windguard präsentierten die Halbjahreszahlen gerade gemeinsam mit dem Bundesverband Windenergie (BWE) in Berlin [Juli 2019].
287 Megawatt (MW) oder 86 Anlagen wurden in den ersten sechs Monaten 2019 zugebaut, der niedrigste Wert seit Einführung des EEG. [nötig für die Energiewende: 4700 MW/Jahr].
Niedersachsen den stärksten Zubau verbuchen - mit 49 MW.
Zahlreiche Bundesländer waren jedoch komplett abgeschlagen.
Schleswig-Holstein, die Wiege der Windkraft, seit Jahren durch ein Moratorium ausgebremst: 5 MW Zubau,
Baden-Württemberg - mit grüner Landesregierung: 3 MW Zubau.
Bayern mit der 10H-Regelung, die quasi jetzt auch für NRW eingeführt wurde: Null Zubau.
bei den kumulierten Zahlen steht Niedersachsen an der Spitze - mit inzwischen über 11 Gigawatt (GW) und 6.300 Anlagen von bundesweit 53 GW.
Es folgen Brandenburg und Schleswig-Holstein mit je 7 GW.
Rehfeldt berichtet, dass im ersten Halbjahr 2019 zwei Ausschreibungsrunden mit 700 und 650 MW ausgeschrieben wurden. "Beide haben eine starke Unterzeichnung gesehen, von 1.350 MW wurden nur 746 MW bezuschlagt", so der Windguard-Mann. Der Gebotspreis habe sich im Verlauf der Ausschreibungsrunden gewandelt: 2017 sind wegen der inzwischen abgeschafften Bürgerenergieregelung ein Absinken der Preis zu verzeichnen gewesen. "Mittlerweile hat sich das wieder stabilisiert", so Rehfeldt. Jetzt lag der Preis pro Kilowattstunde bei den Ausschreibungen bei 6,1 und 6,3 Cent.
... Matthias Zelinger vom VDMA erklärt, was die schlechten Ausbauzahlen für die Hersteller bedeuten: "Wenn wir auf diesem Level bleiben würden, wäre das eine Marginalisierung des deutschen Marktes." ... "Wie können wir rechtssichere Genehmigungen kriegen?"
... Zelinger verweist auf Nachbarstaaten, selbst Polen wolle 2.500 MW ausschreiben. Bei den europäischen Zahlen hatte Deutschland bei Wind Onshore immer geführt. Nun stehen wir weit hinter Frankreich und Schweden mit über 500 und 450 MW. Deutschland liegt mit unter 300 auf der Höhe von Italien, die Ukraine folgt dichtauf. "Weltweit erwarten wir 57 GW 2019 und 2020 über 60 GW, weil China wieder anspringt", so Zelinger.
... Die Klimapläne der 27 Mitgliedstaaten der EU, die Ende des Jahres fällig werden, seien ein Katalog für Investitionen. "Wer Investitionen in seinem Land will, muss jetzt ein Zeichen setzen", so Zelinger. Mit anderen Worten: Wenn Deutschland sich nicht entschlossen zur Energiewende bekennt und den Ausbau so forciert, dass die EU-Klimaziele 2030 erreicht werden, dann verlieren wir auch Investoren.
BWE-Präsident Hermann Albers betont: "Wir beklagen uns nicht wegen des wirtschaftlichen Rahmens, sondern es geht um Soft Skills. Die Kosten bewegen sich zwischen fünf und sechs Cent. Es spricht nichts gegen Wind und die Energiewende." Für 65 Prozent Erneuerbarenanteil bis 2030 seien 4.700 MW jährlicher Zubau nötig.
Laut Albers wachse die Leistung pro Anlage in Richtung über vier MW, in den nächsten Jahren vielleicht sogar bis sechs oder sieben MW Onshore. Derzeit ist die durchschnittliche Anlagenleistung nicht einmal zwei MW.
200 GW an Windleistung seien langfristig erforderlich, prognostiziert der BWE. "Eine Flächenkulisse von 2 % ist dafür notwendig. Die Zahl der Anlagen wird sich nicht wesentlich verändern mit etwa 30.000, heute haben wir das schon mit 29.248 fast erreicht." In den vergangenen zwei Jahren habe Deutschland unterhalb des Zubaukorridors gelegen.
... Ein falsches Signal aus Berlin sei es, wenn die Regierung öffentlich fragt: Wie viel Wind brauchen wir überhaupt? Das wollen wir nochmal hochrechnen lassen. Das verunsichere die Landesminister, die dann fragen: Haben wir überhaupt die Rückendeckung aus Berlin? "Ein klarer Rahmen schafft Akzeptanz", so Albers. Die AG Akzeptanz habe am Ende gar nicht mehr getagt, weil die CDU auf einer Abstandsdebatte verharrt.
Albers: "20.000 Arbeitsplätze in der Windkraft sind schon verloren, 100.000 Arbeitsplätze in den Erneuerbare."
Im ersten Halbjahr 2019 wurden in Europa 4,9 Gigawatt Windkraft neu installiert. Briten, Franzosen und Schweden führen.
Das ist etwas mehr als im ersten Halbjahr 2018 (4,5 GW)
In Deutschland wurde so wenig aufgestellt wie zuletzt vor 19 Jahren
523 MW Leistung im ersten Halbjahr 2019 installiert.
11 GW Onshore-Wind warten auf Genehmigungen.
2017 wurden sogenannten Bürgerwindparks Auktionszuschläge erteilt ohne Genehmigungen.
Spanien: Ausschreibungen 2017 und 2018 in Höhe von 4,1 Gigawatt
EU: 1,9 GW [mit Hornsea 1 in UK: 1,2 GW, weltweit der größte Off-Shore Windpark] neue Offshore-Leistung sind ein deutlicher Anstieg gegenüber 1,1 GW im Vorjahreszeitraum [2018] [Während ON-Shore schwächelt, liegt Off-Shore im Plan, in Deutschland gingen 42 neue Anlagen mit zusammen 252 Megawatt ans Netz].
Großbritannien (931 MW),
Dänemark (374 MW),
Belgien (370 MW) und
Deutschland (252 MW)
Das Regenerativziel der EU lautet 32 Prozent bis 2030 und Nullemissionen bis 2050. "Der Zubau, den wir bis jetzt in diesem Jahr gesehen haben, wird uns dort nicht hinbringen", so Tardieu.
CO2-Preis JETZT - Warum ein separater nationaler Emissionshandel für Wärme und Verkehr in Deutschland ungeeignet ist zum Erreichen der Klimaziele 2030.
Ulf Sieberg, Leiter Büro Berlin CO2 Abgabe e.V., August 2019
Ein separater nationaler Emissionshandel für Wärme und Verkehr und damit uneinheitliche CO2-Preise führen zu Verwerfungen im Energiemarkt und stehen der Sektorenkopplung sowie einer wirksamen Treibhausgasminderung entgegen. Ein volatiler CO2-Preis im Europäischen Emissionshandel (ETS) und deutlich abweichende CO2-Preise bei Wärme und Verkehr (Non-ETS) ohne Durchlässigkeit zwischen den Sektoren führt zu Verwerfungen im Energiemarkt zulasten klimafreundlicher Technologien. Die Kombination aus CO2-Mindestpreis im bestehenden Emissionshandel und CO2-Preis orientierten Steuersätzen auf fossile Energien für Wärme und Verkehr hingegen führt zu den von den Wirtschaftsweisen geforderten einheitlichen, sektorübergreifenden Preisen.
Ein separater nationaler Emissionshandel für Wärme und Verkehr erlaubt Haushalten und Autofahrern keine ausreichende Zeit zur Anpassung. Um die Klimaziele zu erreichen müsste die Menge an Emissionsberechtigungen konsequenterweise jährlich um etwa vier Prozent sinken. Die Folge: Stark ansteigende Brenn- und Treibstoffe durch hohe Zertifikatspreise, weil kurzfristig z.B. im Verkehr geeignete Alternativen fehlen oder nicht zeitnah zu realisieren sind, wie z.B. der Ausbau des ÖPNV. Das Risiko: Politisches Eingreifen durch Ausgabe weiterer Zertifikate und Verfehlen der Klimaschutzziele.
Ein separater nationaler Emissionshandel für Wärme und Verkehr wäre mit erheblichem bürokratischen Mehraufwand und erhöhten Transaktionskosten verbunden.
Ein separater nationaler Emissionshandel für Wärme und Verkehr wäre ein europäischer Sonderweg.
Zur Einführung eines separaten nationalen Emissionshandels für Wärme und Verkehr liegen bislang keine konkreten Vorschläge und Erfahrungen für eine praktikable Umsetzung vor. Sie ist deswegen keine kurzfristige Umsetzungsoption. Eine praktikable Umsetzung müsste erst über mehrere Jahre entwickelt werden und dessen Wirkung wäre weitgehend unbekannt. Die Dringlichkeit im Klimaschutz voran zu kommen und die bisherigen praktischen Erfahrungen im bestehenden Emissionshandel (insbesondere zu geringes Cap) sprechen gegen eine Ausweitung.
Fazit: Ein separater nationaler Emissionshandel für Wärme und Verkehr ist keine schnelle Umsetzungsoption und daher ungeeignet zum Erreichen der Klimaziele 2030. Stattdessen sollte Deutschland einen CO2-Mindestpreis im bestehenden Emissionshandel einführen und die bisherigen Energiesteuern auf fossile Energieträger für Wärme und Verkehr zum 1. Januar 2020 anhand des Treibhausgaspotenzials ausrichten.
Mit dem Tal.Markt stellen Sie sich Ihren individuellen Strom-Mix zusammen und erhalten genau den Strom der Erzeuger, den Sie sich ausgesucht haben. Und das direkt aus der Region und 100 % ökologisch aus Sonne, Wind, Wasserkraft oder Biomasse.
Ihre Vorteile
15-minütige Auswertung des Stromverbrauchs durch modernste Messtechnik
Strom selber mixen aus Anlagen von regionalen Produzenten
Vollständige Transparenz: Immer wissen, woher der Strom kommt und wie viel
Strom aus regenerativen Solar-, Biomasse-, Wasser- oder Windkraftanlagen
Gesicherte Stromversorgung durch die WSW, wenn eine Anlage nicht liefern kann
Es brauche "Fördermittel in einer völlig neuen Größenordnung": Der Mieterbund und der Unternehmerverband GdW fordern staatliche Zuschüsse, damit die Energiewende im Gebäudesektor gelingt. Sechs bis 14 Milliarden Euro jährlich seien dafür nötig.
Um die Klimaziele im Gebäudebereich zu erreichen, soll der Staat seine Förderung massiv ausweiten. Das fordern der Deutsche Mieterbund, der Wohnungswirtschaftsverband GdW und der Deutsche Verband für Wohnungswesen, Städtebau und Raumordnung.
WBGU, PRESSEERKLÄRUNG, BERLIN/NEW YORK, 12.07.2019
Der globale digitale Wandel sollte so gestaltet werden, dass er die Umsetzung der Agenda 2030 mit ihren globalen Nachhaltigkeitszielen (SDGs) unterstützt. Bisher hat sich der durch die Digitalisierung erhoffte Beitrag zur Erreichung dieser Ziele nicht eingestellt. Nur wenn der digitale Wandel und die Transformation zur Nachhaltigkeit konstruktiv verzahnt werden, kann es gelingen, Klima- und Umweltschutz sowie menschliche Entwicklung voranzubringen. Voraussetzung ist eine systematische Verankerung des Themas Digitalisierung und Nachhaltigkeit im System der Vereinten Nationen. Das derzeit in New York tagende Hochrangige Politische Forum für Nachhaltige Entwicklung (HLPF) bietet dafür eine ideale Plattform, so die Botschaft des heute vom WBGU veröffentlichten Politikpapiers "Digitales Momentum für die UN Nachhaltigkeitsagenda im 21. Jahrhundert".
The Climate Action Tracker is an independent scientific analysis that tracks government climate action and measures it against the globally agreed Paris Agreement aim of "holding warming well below 2°C, and pursuing efforts to limit warming to 1.5°C." A collaboration of two organisations, Climate Analytics and New Climate Institute, the CAT has been providing this independent analysis to policymakers since 2009.
CAT quantifies and evaluates climate change mitigation commitments, and assesses, whether countries are on track to meeting those. It then aggregates country action to the global level, determining likely temperature increase by the end of the century. CAT also develops sectoral analysis to illustrate required pathways for meeting the global temperature goals.
CAT tracks 32 countries covering around 80% of global emissions
CAT covers all the biggest emitters and a representative sample of smaller emitters covering about 80% of global emissions and approximately 70% of global population. The national actions we track are:
Effect of current policies on emissions: The policies a government has implemented or enacted and how these are likely to affect national emission over the time period to 2030, and where possible beyond.
Impact of pledges, targets and NDCs on national emissions over the time period to 2030, and where possible beyond.
Fair share and comparability of effort: Whether a government is doing its "fair share” compared with others towards the global effort to limit warming consistent with the Paris Agreement.
CAT calculates global warming consequence and emissions gaps
The Climate Action Tracker assesses the total global effort of NDCs, pledges and current policies on:
Global warming over the 21st century. Global emissions pathways consistent with government actions are analyzed and climate consequences projected using a carbon-cycle / climate model (MAGICC).
Emissions Gap:
New developments
CAT constantly expands its analysis to adjust to the political landscape.
Can countries do more? Comparison of NDCs and current policies to emission reduction potentials based on a literature review and additional economic analysis.
Tracking decarbonisation progress: Comparison of NDCs and current policies with national and sectoral decarbonisation rates consistent with the Paris Agreement.
Funding sources
The Climate Action Tracker is made possible due to generous support from the ClimateWorks Foundation and the German Ministry for Environment, Nature Conservation and Nuclear Safety (BMU) via the International Climate Initiative. Past supporters include the European Climate Foundation and the Children’s Investment Fund Foundation.
Past consortium members have included the Potsdam Institute for Climate Impact Research (2009–2016) and Ecofys, a Navigant company (2009–2019).
An IPCC special report on the impacts of global warming of 1.5 °C above pre-industrial levels and related global greenhouse gas emission pathways, in the context of strengthening the global response to the threat of climate change, sustainable development, and efforts to eradicate poverty.
MONACO, Sept 20 – The Intergovernmental Panel on Climate Change (IPCC) opened a meeting on Friday to consider a special report on the ocean and cryosphere – the frozen parts of the planet – its third report this year.
Hosted by the Government of Monaco and the Prince Albert II of Monaco Foundation, the IPCC session will consider the Special Report on the Ocean and Cryosphere in a Changing Climate, which assesses the impacts of climate change on ocean, coastal, polar and mountain ecosystems, consequences for human communities that depend on them, and options for adaptation and climate resilient development. The IPCC is meeting in Monaco from 20 to 23 September 2019.
Last month the IPCC – the world body for assessing the science related to climate change — released another Special Report, Climate Change and Land, and in May it finalized a methodology report – the 2019 Refinement to the 2006 IPCC Guidelines for National Greenhouse Gas Inventories. The Special Report on the Ocean and Cryosphere in a Changing Climate is the third product this year.
"This week’s deliberations on the Special Report on the Ocean and Cryosphere in a Changing Climate marks another major milestone for the IPCC,” said IPCC Chair Hoesung Lee.
"The two special reports this year complement last October’s Special Report on Global Warming of 1.5ºC. Together they constitute the most up-to-date science on climate change as we prepare for the full Sixth Assessment Report,” he said.
The IPCC special reports have transformed public discussions about climate change. The IPCC is considering the new ocean and cryosphere assessment as leaders gather in New York for the UN General Assembly and the UN Secretary-General’s Climate Summit on 20 September.
The new report, which will be released on 25 September, subject to approval, will provide important scientific inputs into the Santiago Climate Change Conference (COP25) later this year.
[21.8.2019] In Neubrandenburg ist offiziell der Grundstein für einen Kurzzeitwärmespeicher gelegt worden. Die Neubrandenburger Stadtwerke investieren dafür mehr als zehn Millionen Euro, die Speicherkapazität beträgt 700 Megawattstunden.
Der Kurzzeitwärmespeicher wird nach Fertigstellung 36 Meter hoch sein und 23.000 Kubikmeter Fernwärmewasser mit einer maximalen Speichertemperatur von 99 °C fassen. Mit einem neuen Kurzzeitwärmespeicher wollen die Neubrandenburger Stadtwerke (neu.sw) ihre grüne Wärme-Wende vorantreiben.
Der Speicher mit einer Kapazität von 700 Megawattstunden (MWh) soll den Betrieb des 90 Megawatt (MW) leistenden Gas- und Dampfturbinenheizkraftwerks weiter optimieren. Die dort bei der Stromproduktion entstehende Wärme wird als Fernwärme für Heizung und Warmwasser genutzt. Ähnlich einer Thermoskanne kann der Speicher später überschüssige Wärme festhalten. Die Speicherfähigkeit entspricht nach Unternehmensangaben dem Fernwärmebedarf der Stadt an zwei Sommertagen.
Nachdem im Mai bereits das Fundament für den Koloss selbst gegossen wurde, entsteht derzeit die Hülle, für die zwölf jeweils drei Meter hohe Stahlringe montiert werden müssen. Nach Fertigstellung wird der Kurzzeitwärmespeicher 36 Meter hoch sein und 23.000 Kubikmeter Fernwärmewasser mit einer maximalen Speichertemperatur von 99 Grad Celsius fassen. Im kommenden Jahr soll der Betrieb starten.
Investiert werden mehr als zehn Millionen Euro (0.7 GWh/10^7Euro = 70 Wh/Euro). "Dieser Speicher setzt einen Meilenstein für die künftige Wärmeversorgung der Stadt", so Ingo Meyer, Vorsitzender der neu.sw-Geschäftsführung. So könne der Erdgasverbrauch und der Kohlendioxidausstoß deutlich gesenkt werden.
Insgesamt investieren die Neubrandenburger Stadtwerke mehr als 20 Millionen Euro in die Fernwärmeversorgung Neubrandenburgs. Im Rahmen der grünen Wärme-Wende sind noch der Umbau des heutigen Aquiferspeichers zu einer Geothermieanlage und der Aufbau eigener Solarthermieanlagen geplant (wir berichteten). (ur)
Der Globale Hektar (gha) entspricht einem Hektar mit weltweit durchschnittlicher biologischer Produktivität
deutscher Durchschnitt 4.9 gha.
Jeder Mensch hinterlässt eine unterschiedlich große Fußspur. Und es gibt deutliche Unterschiede zwischen den Ländern.
In Deutschland ist der durchschnittliche Naturverbrauch pro Kopf 4,9 gha.
In Bangladesch sind es nur 0,8 gha,
in Äthiopien 1,1 gha und
in Nicaragua 1,7 gha.
Wie groß Dein Fußabdruck ist, kannst Du mit dem Fußabdrucktest abschätzen.
mein Fußabdruck
Details zu meinem ökologischen Fußabdruck von 3.4 gha
Sockelbetrag:
Zu Deinem persönlich beeinflussbaren Fußabdruck wird ein Sockelbetrag von 1,0 gha addiert. Dieser kollektive Fußabdruck steht für die Infrastruktur in Deutschland (z.B. Straßen und Krankenhäuser). Diesen Teil Deines Fußabdrucks kannst Du indirekt beeinflussen, z.B. indem Du Dich für die Energiewende, öffentliche Verkehrsmittel oder für öko-faire Beschaffung in öffentlichen Einrichtungen einsetzt.
Die Studie beschreibt fünf Klimapfade
Abbildung 1 | Übersicht über Kernergebnisse der fünf Klimapfade
Bedeutung der hochgestellten Zahlen:
Stromerzeugungskapazitäten Perspektive, CO2-Preise sind nicht berücksichtigt
Bei kosteneffizienter Umsetzung der optimierten Klimapfade; direkte Mehrkosten aus volkswirtschaftlicher Perspektive, CO2-Preise sind nicht berücksichtigt
Investitionen und Kosten für nichtwirtschaftliche Maßnahmen in der Referenz, v. a. Fortschreibung der Energiewende, nichtwirtschaftliche Effizienzmaßnahmen zur Erreichung von Flottengrenzwerten im Verkehr, Teile Gebäudesanierung
Mehrkosten der Szenarien im Vergleich zur "Referenzwelt"
Mehrkosten der Klimaschutzmaßnahmen innerhalb der Szenarien (niedrigere Energieträgerpreise bei globalem Klimaschutz erhöhen die Mehrkosten)
BIP-Spanne beinhaltet Sensitivität bei vollständigem Crowding-out der Klimaschutzinvestitionen (niedriger Wert) und ohne Crowding-out (höherer Wert)
Im ersten Teil der Studie werden bestehende Anstrengungen ("Referenzpfad") bewertet, um die Lücke zwischen einer unter derzeitigen Rahmenbedingungen absehbaren Entwicklung und den Emissionsreduktionszielen von 80 bzw. 95 Prozent zu beziffern. Danach werden die technischen Maßnahmen beschrieben, mit denen nach heutigem Stand eine volkswirtschaftlich kosteneffiziente und gesellschaftlich akzeptable Erreichung dieser Ziele möglich wäre ("80 %-Klimapfad", "95 %-Klimapfad"). Zusätzlich zu diesen Klimapfaden werden Maßnahmen diskutiert, deren technologische und wirtschaftliche Reife aus heutiger Sicht auch bis 2050 nicht hinreichend sicher scheint, die aber bei Eintritt dieser Reife einen signifikanten Beitrag zum Klimaschutz leisten könnten (sogenannte Game-Changer).
In Kapitel 3 werden diese Pfade in 2 Szenarien bezüglich der internationalen Rahmensetzungen zu Klimaschutzanstrengungen ökonomisch bewertet
"Nationale Alleingänge" vs.
"Globaler Klimaschutz".
Betrachtet werden dazu
Vermeidungskosten der zugrunde liegenden Maßnahmen,
nötige Mehrinvestitionen und -kosten sowie
gesamtheitliche ökonomische Auswirkungen.1
1. Im Szenario "Nationale Alleingänge" wurden für den 95%-Klimapfad keine ökonomischen Auswirkungen untersucht, da dieser Pfad, wie im Folgenden erläutert, kaum realistisch erscheint.
2 Als Brennstoffe werden nachfolgend im Allgemeinen feste, flüssige und gasförmige Energieträger bezeichnet. Flüssige und gasförmige Brennstoffe, die im Verkehrssektor eingesetzt werden, werden nachfolgend als Kraftstoffe bezeichnet.
Zudem werden wirtschaftliche Chancen und Herausforderungen diskutiert, die sich bei der Umsetzung der Klimapfade ergeben können. Abschließend erfolgt eine Identifizierung der dringlichsten politischen Handlungsfelder. Detailbetrachtungen der untersuchten Sektoren Industrie, Verkehr, Haushalte und Gewerbe, Energie und Umwandlung sowie Land- und Abfallwirtschaft finden sich in den Kapiteln 5 bis 9.
Die wesentlichen Erkenntnisse der Studie sind im Folgenden zusammengefasst.
1. Mit einer Fortsetzung derzeitiger Anstrengungen in Form bestehender Maßnahmen, beschlossener politischer und regulatorischer Rahmenbedingungen sowie absehbarer Technologieentwicklungen ("Referenzpfad") werden bis 2050 ca. 61 Prozent Treibhausgas(THG)-Reduktion gegenüber 1990 erreicht. Es verbleibt damit eine Lücke von 19 bis 34 Prozentpunkten zu den deutschen Klimazielen.
2. 80 Prozent THG-Reduktion sind technisch möglich und in den betrachteten Szenarien volkswirtschaftlich verkraftbar. Die Umsetzung würde allerdings eine deutliche Verstärkung bestehender Anstrengungen, politische Umsteuerungen und ohne globalen Klimaschutzkonsens einen wirksamen Carbon-Leakage-Schutz erfordern.
3. 95 Prozent THG-Reduktion wären an der Grenze absehbarer technischer Machbarkeit und heutiger gesellschaftlicher Akzeptanz. Eine solche Reduktion (über den 80 %-Pfad hinaus noch einmal um drei Viertel) erfordert praktisch Nullemissionen für weite Teile der deutschen Volkswirtschaft. Dies würde neben einem weitestgehenden Verzicht auf alle fossilen Brennstoffe2 unter anderem den Importerneuerbarer Kraftstoffe (Power-to-Liquid/-Gas), den selektiven Einsatz aktuell unpopulärer Technologien wie Carbon-Capture-and-Storage (CCS) und sogar weniger Emissionen im Tierbestand bedeuten – eine erfolgreiche Umsetzung wäre nur bei ähnlich hohen Ambitionen in den meisten anderen Ländern vorstellbar.
4. Mehrere "Game-Changer" könnten die Erreichung der Klimaziele in den nächsten Jahrzehnten potenziell erleichtern und günstiger gestalten (unter anderem Technologien für die Wasserstoffwirtschaft und Carbon-Capture-and-Utilization-Verfahren). Ihre Einsatzreife ist aktuell noch nicht sicher absehbar und wird daher zur Erreichung der Ziele nicht unterstellt. Sie müssten allerdings mit Priorität erforscht und entwickelt werden.
5. Die kosteneffiziente Erreichung der Klimapfade würde aus heutiger Sicht in Summe Mehrinvestitionen von 1,5 bis 2,3 Billionen Euro bis 2050 gegenüber einem Szenario ohne verstärkten Klimaschutz erfordern, davon ca. 530 Milliarden Euro für eine Fortschreibung bereits bestehender Anstrengungen (im Referenzpfad). Dies entspricht bis 2050 durchschnittlichen jährlichen Mehrinvestitionen in Höhe von ca. 1,2 bis 1,8 Prozent des deutschen Bruttoinlandsprodukts (BIP). Die direkten volkswirtschaftlichen Mehrkosten nach Abzug von Energieeinsparungen lägen bei etwa 470 bis 960 Milliarden Euro bis 2050 (etwa 15 bis 30 Milliarden Euro pro Jahr), davon ca. 240 Milliarden Euro für bestehende Anstrengungen.
Mehrinvestitionen enthalten alle zusätzlichen Investitionen zur Erreichung der Klimapfade über im Referenzszenario getroffene Investitionen hinaus. Zur Berechnung der Mehrkosten wurden diese mit 2 Prozent volkswirtschaftlichem Realzins über die Lebensdauer des jeweiligen Kapitalguts annualisiert. Energiekosteneinsparungen und -ausgaben wurden gegengerechnet. Hierfür wurden Grenzübergangspreise für fossile Energieträger und Stromsystemkosten angesetzt. Die Mehrinvestitionen und -kosten für nichtwirtschaftliche Maßnahmen des Referenzszenarioswurden darüber hinaus grob abgeschätzt
6. Bei optimaler politischer Umsetzung wären die gesamtwirtschaftlichen Auswirkungen der betrachteten Klimapfade dennoch neutral ("schwarze Null"), im betrachteten 80%-Klimapfad wäre dies sogar im Szenario ohne globalen Konsens der Fall. Dabei wäre jedoch ein umfangreicherer Schutz gefährdeter Industrien nötig, um dem Risiko einer Schwächung industrieller Wertschöpfung zu begegnen – in Form eines wirksamen Carbon-Leakage-Schutzes und langfristig verlässlicher Ausgleichsregelungen für Industrien im internationalen Wettbewerb.
7. Erfolgreiche Klimaschutzbemühungen wären mit einer umfangreichen Erneuerung aller Sektoren der deutschen Volkswirtschaft verbunden und könnten deutschen Exporteuren weitere Chancen in wachsenden "Klimaschutzmärkten" eröffnen. Studien erwarten, dass das Weltmarktvolumen der wichtigsten Klimatechnologien bis 2030 auf 1 bis 2 Billionen Euro pro Jahr wachsen wird. Deutsche Unternehmen können für diesen globalen Wachstumsmarkt ihre Technologieposition stärken.
8. Gleichzeitig wird der anstehende Transformationsprozess Deutschland vor erhebliche Umsetzungsherausforderungen stellen. Die betrachteten Klimapfade sind volkswirtschaftlich kosteneffizient und unterstellen eine ideale Umsetzung unter anderem im Sinne sektorübergreifender Optimierung und "richtiger Entscheidungen zum richtigen Zeitpunkt". Fehlsteuerungen in der Umsetzung – wie z. B. in der Energiewende durch Überförderungen und die Verzögerung des Netzausbausbeobachtbar – können die Kosten und Risiken erheblich steigern oder das Zielsogar unerreichbar werden lassen.
9. Erfolgreicher Klimaschutz in Deutschland könnte einerseits international Nachahmer motivieren. Andererseits wären im Fall signifikant negativer wirtschaftlicher Auswirkungen die deutschen Klimaschutzbemühungen sogar kontraproduktiv, da sie andere Staaten abschrecken würden, während der deutsche Anteil am globalen THG-Ausstoß (rund 2 Prozent) das Klima allein nicht wesentlich beeinflusst. Eine international vergleichbar ambitionierte Umsetzung zumindest in den größten Volkswirtschaften (G20) würde diese Risiken deutlich mindern und deutschen Unternehmen außerdem breitere Exportchancen eröffnen.
10. Eine erfolgreiche Erreichung der deutschen Klimaziele und eine positive internationale Multiplikatorwirkung sind daher ein politischer, gesellschaftlicher und wirtschaftlicher Kraftakt. Gefragt ist eine weitsichtige Klima-, Industrie- und Gesellschaftspolitik "aus einem Guss", die auf Wettbewerb und Kosteneffizienz setzt, gesellschaftliche Lasten fair verteilt, Akzeptanz für die Maßnahmen sicherstellt sowie den Erhalt und Ausbau industrieller Wertschöpfung priorisiert. Dazu bedarf es für das "Großprojekt Klimaschutz" einer langfristigen politischen Begleitung.
Die deutsche chemische Industrie kann ihren Ausstoß von Treibhausgasen mithilfe neuer Produktionstechnologien bis zur Mitte des Jahrhunderts fast vollständig reduzieren. Dies ist das Ergebnis einer Studie des Verbandes der Chemischen Industrie (VCI), erstellt durch die Gesellschaft für Chemische Technik und Biotechnologie (DECHEMA) und das Beratungsunternehmen FutureCamp. Die Analyse untersuchte auch die Voraussetzungen, damit die Branche bis 2050 treibhausgasneutral werden kann: Neben der Entwicklung neuer Verfahren vor allem in der Basischemie sind dazu ein dauerhaft niedriger Industriestrompreis sowie erhebliche Mengen emissionsfreien Stroms aus erneuerbaren Quellen notwendig.
VCI-Hauptgeschäftsführer Wolfgang Große Entrup erklärte, die Studie sei Ergebnis einer langen und intensiven Beschäftigung der Branche mit dem Thema Klimaschutz. Er sagte vor Journalisten in Berlin: "Die deutsche Chemie bekennt sich zur gesellschaftlichen Aufgabe Treibhausgasneutralität. Wir wollen diesen Weg bis 2050 erfolgreich beschreiten. Dabei wollen wir als deutsche Branche die Speerspitze der technologischen Transformation der globalen Chemieindustrie bilden." Um die Unternehmen bei diesem Prozess zu unterstützen, plant der VCI eine neue Plattform zu etablieren, die Expertise aus den unterschiedlichsten Bereichen zusammenführen und die gesamte Wertschöpfungskette vom Produzenten bis hin zum Endkonsumenten sowie Politik und Gesellschaft einschließen soll.
Klaus Schäfer, Vorsitzender des VCI-Ausschusses Energie, Klimaschutz und Rohstoffe, stellte die Inhalte der VCI-Studie vor. Wie der Vorstand der Covestro AG erläuterte, sind die erforderlichen CO2-freien Verfahren zur Herstellung von Basischemikalien heute prinzipiell bekannt, sie müssten aber für die großtechnische Verwendung noch weiterentwickelt und marktreif gemacht werden. Ihr Einsatz sei ab Mitte der 2030er Jahre denkbar. Schäfer sagte: "2050 ist eine weitgehend treibhausgasneutrale Chemieproduktion in Deutschland technologisch vorstellbar. Dafür müssen aber alle Voraussetzungen stimmen: Unternehmen können die Transformation hin zu null Emissionen nur vorantreiben, wenn sie in jeder Phase wettbewerbsfähig bleiben und über große Mengen erneuerbaren Stroms zu niedrigen Kosten verfügen können."
Die Studie mit dem Titel "Auf dem Weg zu einer treibhausgasneutralen chemischen Industrie in Deutschland" beschreibt die Entwicklung der nächsten Jahrzehnte anhand dreier unterschiedlicher Ambitionsniveaus:
In einem Referenzpfad würde die deutsche Chemie weiterhin mit den heutigen Technologien produzieren, ihre Effizienz durch kontinuierliche Investitionen aber weiter erhöhen. Damit kann sie bis 2050 eine Treibhausgasminderung von 27 Prozent bezogen auf das Niveau von 2020 erreichen.
Sogar 61 Prozent Minderung sind möglich, wenn die Unternehmen im zweiten Technologiepfad zusätzlich stark in neue Prozesstechnologien der Basischemie investieren. Allerdings geht mit diesem Ambitionsniveau bereits ein sehr hoher Bedarf an erneuerbarem Strom von 224 Terawattstunden pro Jahr einher, was der Gesamtstrommenge Deutschlands aus erneuerbaren Energien 2018 entspricht. Das zusätzliche Investitionsvolumen in neue Anlagen liegt bei rund 15 Mrd. Euro.
Noch weitergehende Maßnahmen beschreibt der dritte Pfad Treibhausgasneutralität, der die Lücke zur vollständigen CO2-Minderung schließt: Danach würden neue Prozesstechnologien von den Unternehmen schon dann eingeführt, wenn sie eine CO2-Ersparnis erbringen, selbst wenn sie noch nicht wirtschaftlich sind. Alleine für die Herstellung der sechs in der Studie untersuchten Grundchemikalien müssten die Unternehmen von 2020 bis 2050 rund 45 Mrd. Euro zusätzlich investieren. Der Strombedarf würde ab Mitte der 2030er Jahre zudem noch einmal rasant ansteigen und mit 628 Terawattstunden etwa das Niveau der gesamten heutigen Stromproduktion in Deutschland erreichen.
Auf dem Podium von links nach rechts: Wolfgang Große Entrup (VCI-Hauptgeschäftsführer), Klaus Schäfer (CTO von Covestro und Vorsitzender des VCI-Ausschusses Energie, Klimaschutz und Rohstoffe), Kurt Wagemann (DECHEMA-Geschäftsführer) und Roland Geres (geschäftsführender Gesellschafter bei FutureCamp). Copyright: Verband der Chemischen Industrie e.V. Die Nutzung der Fotos ist für redaktionelle Zwecke frei. Verwendung nur mit Quellenvermerk "VCI/Simone M. Neumann". Eine kommerzielle Weitergabe an Dritte ist unzulässig.
Copyright: Verband der Chemischen Industrie e.V. Die Nutzung der Grafik ist für redaktionelle Zwecke frei. Verwendung nur mit Quellenvermerk "VCI", ergänzt um die ggf. in der Grafik selbst jeweils benannten Datenquellen. Eine kommerzielle Weitergabe an Dritte ist unzulässig.
Copyright: Verband der Chemischen Industrie e.V. Die Nutzung der Dateien ist für redaktionelle Zwecke frei. Verwendung nur mit Quellenvermerk "VCI", ergänzt um die in den Grafiken selbst jeweils benannten Datenquellen. Eine kommerzielle Weitergabe an Dritte ist unzulässig.
Carl-Friedrich Schleussner (Climate Analytics): Auf dem aktuellen Pfad, auf dem wir uns befinden, steuern wir aber, wie Sie richtig gesagt haben, auf ein Überschießen dieser Ziele zu, auf eine Welt von ungefähr drei Grad oder mehr. Wenn wir auf einem solchen Pfad wären, würden wir das 1,5-Grad-Ziel in der zweiten Hälfte der 2030er-Jahre ungefähr überschreiten und dann um das Jahr 2050 herum das Zwei-Grad-Ziel. Das heißt natürlich, wenn man das auf generationale Fragen überträgt, dass heutige junge Menschen eine Welt über 1,5 Grad und eine Welt über zwei Grad sehr wohl erleben werden. Zum Beispiel haben wir uns das einfach demographisch ein bisschen angeschaut und ein heute 16-Jähriger würde ganz sicher mehr als die Hälfte seines Lebens im Mittel über anderthalb Grad leben, fast sogar die Hälfte seines Lebens über zwei. Und damit wären die Klimafolgen, die für heute ältere Generationen noch als hypothetische Zukunftsfragen gesehen werden, für junge Menschen heute schon sehr konkret und werden lebensbestimmend sein.
Wir hatten im Herbst einen neuen Sonderbericht SR15 des Weltklimarats, des IPCC, zu den Klimafolgen bei 1,5 Grad und auch insbesondere verglichen zu zwei Grad. Und der Sonderbericht hat gezeigt, dass in einer ganzen Reihe von sehr wichtigen Klimafolgen – seien es Extremereignisse wie extreme Hitze, Starkniederschläge oder auch Dürren in einigen Weltregionen, in Fragen der Klimaveränderungen regionaler Natur und insbesondere auch der Klimafolgen auf Biodiversität wie zum Beispiel Korallenriffe oder andere sensible Ökosysteme – bereits sehr große Unterschiede zwischen 1,5 und zwei Grad und natürlich noch weiter darüber hinaus für höhere Erwärmungslevel existieren.
Sie werden Sommer erleben oder September erleben, wo die Arktis fast eisfrei ist. Wir werden Hitzeextreme erleben wie letzten Sommer, nicht wie im Moment vielleicht alle vier, fünf Jahre, sondern jedes zweite Jahr oder noch öfter, und wir werden Hitzeextreme erleben, die wir so noch gar nicht hatten. Wir werden Klimafolgen erleben, die insbesondere in den Ländern des globalen Südens noch viel stärker zutreffen als bei uns, und das wird diese Länder und die Möglichkeiten ihres Entwicklungspotenzials noch stärker in Mitleidenschaft ziehen, als das vielleicht jetzt schon der Fall ist.
... wir haben in der Publikation zeigen können, dass jede fünf Jahre Verzögerung im Erreichen des Scheitelpunkts der globalen CO2-Emission auf längere Sicht zu einem Meeresspiegelanstieg von ungefähr zusätzlich 20 Zentimetern führt.
... es gibt einige Studien, die sich Fragen von zum Beispiel Pro-Kopf-Emissionen altersverteilt anschauen, zumindest im Falle der USA, und da ist es so, dass man sieht, dass die Emissionen – und das ist auch wenig überraschend eigentlich – mit dem Vermögen, mit dem Einkommen steigen und damit auch ältere Generationen höhere Pro-Kopf-Emissionen haben als jüngere Generationen.
Das heißt, auch schon im Jetzt tragen ältere Menschen einen höheren Anteil zum Klimawandel bei als junge. Dann geht es aber auch vor allen Dingen bei der Transformation hin zu den Pariser Zielen nicht nur um individuelle Verhaltensweisen, die natürlich darin wichtig sind, aber vor allen Dingen um die grundlegende Veränderung einer gesellschaftlichen Organisation, in der Menschen dann auch sich selbst und ihre Ziele verwirklichen können. Das heißt, ohne diese gesellschaftliche Transformation ist es mit individuellen Handlungsoptionen auch schwer gemacht, einen wirklichen Beitrag oder einen signifikanten Beitrag zum Klimaschutz zu leisten.
Der CO2-Ausstoß pro Kilowattstunde in Deutschland verbrauchten Stroms sank in den vergangenen Jahren weiter – unter anderem durch den wachsenden Anteil erneuerbarer Energien am Strommix. Verursachte eine Kilowattstunde Strom im Jahr 1990 noch durchschnittlich 764 Gramm CO2, geht das UBA auf der Grundlage vorläufiger Daten für 2017 von 486 Gramm aus. Schätzungen für 2018 prognostizieren 474 Gramm. Quelle: CO2-Emissionen pro Kilowattstunde Strom sinken weiter, Umweltbundesamt, 9.4.2019
Wie hoch muss der CO2-Preis sein, um alle Kohlekraft teurer als die Erneuerbaren zu machen?
0.486 tCO2 / MWh 50 Euro/tCO2 = 243 Euro/MWh
Antwort: etwa 50 Euro/tCO2
Finale Investitionsentscheidung für den Bau des Solarparks Weesow-Willmersdorf in Brandenburg gefallen / EnBW realisiert erstes Solar-Großprojekt ohne EEG-Förderung
Bei Werneuchen in Brandenburg (30 km von Berlin-Mitte) baut EnBW
auf einer Fläche von 164 Hektar ihren Solarpark "Weesow-Willmersdorf"
installierte Leistung: mehr als 180 Megawatt
[Stromerzeugung: 0.151 TWh/a, zum Vergleich: deutsche PV-Bruttostromerzeugung 2018: 46 TWh/a, die Werneuchen-Anlage erhöht die deutsche PV-Stromerzeugung also um 0.33 %]
[installierte Leistung = 1.1 MW/ha,
elektrische Leistung = 10 W/m2].
"Wir sind überzeugt, dass sich solch große Solarparks ohne Förderung wirtschaftlich betreiben lassen", sagt Zimmer. "Aber nur, wenn das EEG auch weiterhin regelt: Erneuerbare First!" Das Gesetz gibt vor, dass Strom aus erneuerbaren Energien beim Einspeisen ins Stromnetz Vorrang vor anderen Erzeugungsarten haben. "Diese und weitere Regelungen aus dem EEG müssen auch weiterhin Bestand haben, damit sich die Investitionen in die Erneuerbaren auch zukünftig rechnen", sagt EnBW-Technikvorstand Dr. Hans-Josef Zimmer.
Aktuell verfügt die EnBW über 100 Megawatt Leistung aus Photovoltaik. Weitere 25 Megawatt aus Zuschlägen der Bundesnetzagentur sind derzeit im Bau.
Im Jahr 2018 wurden laut Umweltbundesamt durch die Nutzung von Solarenergie in Deutschland ca. 28,7 Millionen Tonnen Treibhausgasemissionen vermieden (= 624 gCO2/kWh). "Mit dem Solarpark Weesow-Willmersdorf können weitere 129.000 Tonnen CO2 [bei einer PV-Strommenge von 0.151 TWh/a und 624 gCO2/kWh ergeben sich 94000 tCO2/a] jährlich eingespart werden", so Thorsten Jörß, Leiter Projektentwicklung Photovoltaik bei der EnBW.
Sabrina Ebitsch, Hennes Elbert, Christian Endt, Verena Gehrig, Michael Hörz, Dalila Keller, Stefan Kloiber, Markus C. Schulte von Drach, Marlene Weiß
Süddeutsche Zeitung, Datum: vor dem 20. September 2019
Alle reden über die Klimakrise, aber kaum einer versteht sie. Über ihre Ursachen und wie unsere Zukunft aussieht - bei 1,5 bis vier Grad.
Eine Analyse von BUND-Klimaexpertin Ann-Kathrin Schneider,
17. Oktober 2019
Die europäische Investitionsbank (EIB) will grüner werden – doch die Bundesregierung hindert sie daran.
Die europäische Investitionsbank (EIB) vergibt mehr Kredite und Zuschüsse als die Weltbank – alles Steuergelder der EU-Mitgliedstaaten. Das Geld soll für Projekte ausgegeben werden, die "im öffentlichen Interesse Europas" liegen. EIB-Präsident Werner Hoyer hatte nach der Verabschiedung des Pariser Klimaabkommens erkannt, dass der Klimaschutz so ein öffentliches Interesse ist, das die Bank nicht länger ignorieren kann. Er wollte "seine" Bank zu einer grünen Bank machen. So sagte er dieses Jahr: "Wir wollen uns dezidiert hin zum Ausstieg aus fossilen Energiequellen bewegen."
Doch daraus wird vorerst nichts: Die Bundesregierung, die der EIB viel Geld gibt und deren Stimme daher enormes Gewicht hat, hat Hoyer ausgebremst. In der entscheidenden Sitzung am 15. Oktober stimmte Deutschland (gemeinsam mit Italien und Polen) gegen die Verabschiedung einer neuen Energiepolitik der Bank, mit der die EIB aus der Finanzierung von Kohle, Öl und Gas aussteigen wollte.
In der nächsten Sitzung, am 14. November, soll die neue Kreditvergaberichtlinie zwar wieder diskutiert werden. Es ist jedoch anzunehmen, dass es der Bundesregierung bis dahin gelingen wird, Hoyers Plan entscheidend zu verwässern bzw. weiter hinauszuzögern. Worte wie "Energiesicherheit" und "grünes Gas" werden sehr wahrscheinlich missbraucht werden, um der Bank weiterhin zu ermöglichen, Milliarden dafür auszugeben, dass Mitteleuropa per Pipeline und Terminal gut mit dreckigem Gas aus Übersee oder vom kaspischen Gasfeld versorgt werden kann.
William J Ripple, Christopher Wolf, Thomas M Newsome, Phoebe Barnard, William R Moomaw, Oxford University Press, 05 November 2019 (pdf in cache)
Scientists have a moral obligation to clearly warn humanity of any catastrophic threat and to "tell it like it is". On the basis of this obligation and the graphical indicators presented below, we declare, with more than 11,000 scientist signatories from around the world, clearly and unequivocally that planet Earth is facing a climate emergency.
... Wealthier countries need to support poorer nations in transitioning away from fossil fuels. We must swiftly eliminate subsidies for fossil fuels (figure 1, below) and use effective and fair policies for steadily escalating carbon prices to restrain their use...
Figure 1.
Change in global human activities from 1979 to the present. These indicators are linked at least in part to
climate change.
In panel (f ), annual tree cover loss may be for any reason (e.g., wildfire, harvest within tree plantations,
or conversion of forests to agricultural land). Forest gain is not involved in the calculation of tree cover loss.
In panel (h),
hydroelectricity and nuclear energy are shown in figure S2.
The rates shown in panels are the percentage changes per
decade across the entire range of the time series.
The annual data are shown using gray points.
The black lines are local
regression smooth trend lines.
Abbreviation: Gt oe per year, gigatonnes of oil equivalent per year.
Figure 2.
Climatic response time series from 1979 to the present.
The rates shown in the panels are the decadal change
rates for the entire ranges of the time series.
These rates are in percentage terms, except for the interval variables (d, f, g,
h, i, k), where additive changes are reported instead.
For ocean acidity (pH), the percentage rate is based on the change in hydrogen ion activity, aH+,
(where lower pH values represent greater acidity).
The annual data are shown using gray
points.
The black lines are local regression smooth trend lines.
Gap between current G20 GHG emissions excluding LULUCF and 1.5°C compatible fair share 2030 and 2050 emission ranges, Brown to Green Report 2019
Gegenwärtig bewegt sich kein G20-Staat mit seinen nationalen Klimazielen (NDCs "nationally determined contribution”) im Rahmen des 1,5°C Limits. Mit der jetzigen Zielsetzung wären die Emissionen im Jahr 2030 doppelt so hoch wie für eine Begrenzung der Erderwärmung auf 1,5°C notwendig. Im Angesicht des Umstandes, dass nur ungefähr die Hälfte der G20 Länder voraussichtlich ihre nationalen Klimaziele erreichen oder übertreffen werden, zeigt sich hier ein deutliches Potenzial zu Ambitionssteigerungen im Zuge der NDC-Erhöhung im Jahr 2020.
Marstal district heating’s nearly 1,600 consumers receive district heating based on 100 % renewable sources with a solar fraction of 41 % and biomass to cover the remaining.
a large scale solar heating plant of 8,000 m2 connected to the district heating plant. With more than 18,000 m2 of solar panels marstal solar Plant was in 2003 the largest solar installation in the world.
in 2010-12 the solar panels were expanded by another 15,000 m2 and new pit heat storage of 75,000 m3. the project also included a heat pump which uses the energy storage as a heat source and an orc (organic rankine cycle) which is an electricity producing de- vice that uses the energy from the flue gas produced in the biomass boiler.
the project is, along with 10 other european projects selected to be a part of the so-called "EU flag projects”. Further information can be found here (in cache).
Nicht selten wurde von der Vernichtung von weit über 100 Bäumen berichtet. Der Hintergrund dieser erforderlichen Maßnahmen ist der in diesem Jahr dramatische Befall an Ahorn mit dem Rußrindenpilz Cryptostroma corticale. Der Pilz profitierte außerordentlich von der ungewöhnlich langen trockenen Hitzeperiode des Jahres 2018. Temperaturen oberhalb von 30° C fördern das Wachstum und die Sporulation von Cryptostroma corticale. Die betroffenen Bäume zeigen welkende Triebe und ein Absterben der Krone. Ein Schleimfluss am Stamm und bei anhaltendem Trockenstress ein Ablösen der Rinde mit schwarzen dunklen stäubenden Flächen darunter ist zu beobachten. Rinden- und Kambiumnekrosen treten auf, nach dem Fällen ist die stark grünlich-bräunliche Verfärbung des Splintholzes zu sehen.
In Europa ist ein erstes Auftreten aus den 1940er Jahren in Großbritannien bekannt. Erst seit 2003 wird Befall auch in der Schweiz, in Österreich und auch Frankreich berichtet. Der Erstnachweis für Deutschland erfolgte 2005. Seitdem wird in trockenen heißen Wetterperioden regelmäßig Befall hauptsächlich in der oberrheinischen Tiefebene und in Großstädten wie Mannheim, Köln und Leipzig beobachtet. Die Krankheitsentwicklung im Jahr 2018 in Nordrhein Westfalen war jedoch außerordentlich dramatisch.
...Electricity use grows at more than double the pace of overall energy demand in the Stated Policies Scenario, confirming its place at the heart of modern economies. Growth in electricity use in the Stated Policies Scenario is led by
industrial motors (notably in China), followed by
household appliances,
cooling and electric vehicles.
In the Sustainable Development Scenario, electricity is one of the few energy sources that sees growing consumption in 2040 – mainly due to electric vehicles – alongside the direct use of renewables, and hydrogen.
The share of electricity in final consumption, less than half that of oil today, overtakes oil by 2040.
Solar PV becomes the largest component of global installed capacity in the Stated Policies Scenario.
The expansion of generation from wind and solar PV helps renewables overtake coal in the power generation mix in the mid-2020s.
By 2040, low-carbon sources provide more than half of total electricity generation.
Wind and solar PV are the star performers, but hydropower (15% of total generation in 2040) and nuclear (8%) retain major shares.
An urgent need to take full advantage of the world’s "first fuel”
The faltering momentum behind global energy efficiency improvements is cause for deep concern. It comes against a backdrop of rising needs for heating, cooling, lighting, mobility and other energy services.
Improvements in the energy intensity of the global economy (the amount of energy used per unit of economic activity) are slowing: the 1.2% improvement in 2018 was around half the average rate seen since 2010.
This reflects a relative lack of new energy efficiency policies and of efforts to tighten existing measures.
A sharp pick-up in efficiency improvements is the single most important element that brings the world towards the Sustainable Development Scenario.
The pursuit of all economically viable opportunities for efficiency improvement can reduce global energy intensity by more than 3% each year.
This includes efforts to promote the efficient design, use and recycling of materials such as steel, aluminium, cement and plastics.
This increased "material efficiency” could be enough in itself to halt the growth in emissions from these sectors.
Innovative approaches also include the use of digital tools to shift electricity demand to cheaper and less emissions-intensive hours of the day, reducing electricity bills for consumers and helping with system balancing, while also helping to reduce emissions>. ...
Unternehmen fordern leistungsfähiges, zukunftsstarkes Klimapaket
Das Klimapaket der Bundesregierung ist weder leistungsfähig noch zukunftsstark. Die Ziele aus dem Pariser Klimaabkommen werden mit ihm nicht ansatzweise erreicht. Außerdem gibt das Klimapaket der deutschen Wirtschaft nicht die notwendigen Impulse, um im internationalen Wettbewerb um die Märkte der Zukunft zu bestehen. Als Unternehmen fordern wir darum die Politik auf, das Paket dringend nachzubessern. Wir brauchen einen ambitionierten Rahmen, um zum dynamischsten Leitmarkt für Klimatechnologien und nachhaltige Innovationen aufzusteigen.
Insbesondere fordern wir:
Das große Klimapotenzial von Unternehmen nutzen
Unternehmen können 79 Prozent der energiebedingten Treibhausgasemissionen direkt bei sich beeinflussen und somit massiv zum Klimaschutz beitragen. Emissionsarme Technologien und bahnbrechende Innovationen liegen bei vielen Unternehmen in der Schublade. Sie warten nur darauf, dass die Politik endlich starke und klare Anreize setzt, damit eine Markteinführung gelingt und Lösungen auch auf den Weltmärkten skaliert werden können. Die effektivsten und schnellsten Klimapotenziale und Klimainnovationen werden mit klaren, verlässlichen und zukunftsgerichteten Rahmenbedingungen für Unternehmen erreicht.
Markt- und innovationsstarke CO2-Preissignale einführen
Wir schlagen daher für Deutschland vor:
einen ambitionierten und Innovationen auslösenden CO2-Mindestpreis für alle Sektoren, insbesondere Verkehr, Energie, Gebäude und energieintensive Industrie,
auf alle nicht-erneuerbaren Energieträger wie Erdgas, Kohle und Mineralöl als Inputbesteuerung bzw. Besteuerung bei Grenzübergang
mit einem Startniveau von mindestens 50 Euro pro Tonne CO2äq,
mit einer für Innovationen und Investitionen planungssicheren Steigerung von mindestens 5 Euro pro Jahr als Zielpfad,
nicht zur Generierung zusätzlicher Steuereinnahmen, sondern für eine optimale Lenkungswirkung mit einem fairen, sozialen Ausgleich.
Dies ist im Rahmen der bestehenden Systeme schnell und einfach umsetzbar. Damit wird ein Schub an Innovationen und Marktkräften ausgelöst, mit denen wir als Unternehmen den Wirtschaftsstandort langfristig zukunftssicher gestalten können. Hierfür treten wir als Unternehmen ein.
Tragen Sie sich bis zum 29.11.2019 mit Ihrem Unternehmen ein!
... Der neue Antrag der bündnisgrünen Bundestagsfraktion rückt solche Schieflagen zurecht, in dem er die angehäuften Missstände der Energiepolitik in Sachen Windenergie ernsthaft beheben will. Er fordert beispielsweise:
eine endlich funktionierende Förderung von Bürgerwindenergieprojekten durch separate Ausschreibungen,
die Erhöhung der Ausbauziele der Windenergie,
die Erleichterung der Ausbauplanung durch Vorgaben etwa für eine verpflichtende Ausweisung von zwei Prozent der Landesfläche,
die ersatzlose Streichung pauschaler Abstandsvorgaben,
eine Regionalisierung des Windkraftausbaus durch Regionalisierungsanreize.
... Die SPD-Umweltpolitikerin Nina Scheer hat diesen Punkt gefunden, als sie jüngst in einem Radiointerview die Abschaffung der 2017 eingeführten Ausschreibungen für neue Windparks forderte. Die Ausschreibungen sind gescheitert, weil die Politik durch falsche Rahmenbedingungen das Investitionsklima zerstört. Und so lange das nicht wiederhergestellt ist, sind die Ausschreibungen eben kontraproduktiv. Das lässt sich übertragen: Koalitionen von Energiewendepolitikern – gemeint sind hier Bündnis 90/Die Grünen – mit Energiewendegegnern (gesammelt in CDU, CSU und FDP) verändern nicht die Energiepolitik zum Guten, ehe dort nicht falsche Rahmenbedingungen wie das pauschale Argumentieren mit Nebelkerzen abgestellt sind.
65 Prozent Strom aus erneuerbaren Energien bis 2030 wären in Deutschland bei Einführung eines Mindestabstands von 1.000 Metern zu Wohnbebauung nicht erreichbar. Der Ausbau der Windkraft droht durch die geplante Einführung einer Abstandsregel zum Erliegen zu kommen. Das Ziel der Bundesregierung, bis 2030 rund 67 bis 71 Gigawatt (GW) Windenergie an Land zu installieren, ist mit den aktuell ausgewiesenen Flächen ohnehin nur theoretisch erreichbar. Das zeigt eine neue Analyse des Umweltbundesamtes (UBA) , die deutschlandweit vorhandene Flächen für Windenergie erfasst und systematisch analysiert hat.
... Für eine erfolgreiche Energiewende sind laut UBA nicht weniger, sondern dringend mehr und vor allem tatsächlich nutzbare Flächen für die Windenergie an Land nötig. Sonst könnte Deutschland das Ziel, bis zum Jahr 2030 seinen Strom zu 65 Prozent aus erneuerbaren Energien herzustellen, deutlich verfehlen. Die Ausbauziele müssen von den Ländern und Kommunen raumplanerisch umgesetzt werden. Dabei sollten auch die Belange des Gesundheitsschutzes der Anwohnerinnen und Anwohner ausreichend berücksichtigt werden. Das geht laut UBA am bestem mit einer Einzelfallabwägung vor Ort entlang klarer Leitlinien – und nicht über die Ausweitung pauschaler Mindestabstände.
Die aktuelle UBA-Analyse zeigt, dass deutschlandweit eine Fläche von rund 3.100 km^2 auf Ebene der Regional- und Bauleitplanung für die Windenergienutzung ausgewiesen ist. Dies entspricht etwa 0,9 Prozent der Fläche Deutschlands. Zwischen den Bundesländern bestehen große Unterschiede: Mit jeweils rund 2 Prozent stellen Schleswig-Holstein, Brandenburg, Hessen und das Saarland den größten Anteil ihrer Landesfläche für Windenergie bereit, in anderen Ländern wie Bayern liegt der Anteil weit unter einem Prozent. Etwa 50 Prozent der vorhandenen Bestandsflächen ist bereits mit Windenergieanlagen bebaut. Rund 40 Prozent der ermittelten Flächen befinden sich im Entwurfsstadium und ist in der Regel somit noch nicht nutzbar. Die rechtskräftigen Bestandsflächen verfügen aktuell über ein Zubaupotenzial von 23 GW. Insgesamt beträgt das theoretische Leistungspotenzial der potenziell nutzbaren Flächen bis 2030 rund 81 GW.
Allerdings fällt das realisierbare Leistungspotenzial deutlich geringer aus. Denn bei der Nutzbarkeit der Flächen bestehen große Unsicherheiten. So wurden auf 23 Prozent der bis Ende 2014 ausgewiesenen Flächen bisher keine Windräder installiert. Als Hemmnisse nannten die befragten regionalen Planungsträger u.a. Belange des Artenschutzes, der Flugsicherung sowie mangelnde Wirtschaftlichkeit, vor allem durch unzureichende Windverhältnisse. Auch die zu geringen Angebote auf die Windkraft-Ausschreibungen im Jahr 2019 deuten darauf hin, dass bereits heute nicht ausreichend geeignete Flächen zur Verfügung stehen.
Die im aktuellen Referentenentwurf zum Gesetz zur Reduzierung und zur Beendigung der Kohleverstromung und zur Änderungen weiterer Gesetze (Kohleausstiegsgesetz) im neuen § 35a Baugesetzbuch geplante Änderung, wonach Windräder mindestens 1.000 Meter von Wohnbebauung entfernt sein müssen, wird sich erheblich auf die ohnehin zu knapp bemessenen Flächen auswirken. Betroffen sind durch den Gesetzentwurf neben dem Repowering von Altstandorten vor allem die momentan laufenden Planungen. Werden bei letzteren bislang geringere Abstände zugrunde gelegt, wird eine vollständig neue Planung notwendig sein. Die Bereitstellung der Flächen wird sich daher erheblich verzögern, wodurch der notwendige Zubau weiter gebremst wird.
Authors: UN Environment Programme, 26 November 2019
On the Brink - Emissions Gap Report 2019 launch
UN Environment Programme, Published on Nov 26, 2019
As the world strives to cut greenhouse gas emissions and limit climate change, it is crucial to track progress towards globally agreed climate goals. For a decade, UNEP’s Emissions Gap Report has compared where greenhouse gas emissions are heading against where they need to be, and highlighted the best ways to close the gap. Are we meeting goals of the Paris Climate Agreement?
The highly critical UNEP report now says that, having failed to act for so long, we are forced to set an ever higher goal in emissions cuts, one we are less and less likely to achieve. UNEP says we must cut global greenhouse gas emissions by 7.6% every year for the next decade, a far cry from what has happened to date.
Annalena Baerbock und Anton Hofreiter brechen eine Lanze für die Windkraft: Ein Grünen-Windgipfel zur Rettung einer Branche.
Maßnahmenkatalog der Grünen für die Windkraft
Anwohner am Erfolg der Windenergie beteiligen
Kurzfristig Ausbauflächen für blockierte Windanlagen verfügbar machen
Es muss dafür gesorgt werden, dass sich die deutsche Flugsicherung endlich an internationale Standards hält und der Mindestabstand von Windenergieanlagen zu D/VOR-Anlagen von 15 auf 10 Kilometer abgesenkt wird.
Bürgerwindparks ermöglichen, Ausschreibungen für Bürgerenergieprojekte abschaffen
Repowering durch separate Ausschreibungen und verkürzte Planung beschleunigen
Projektierern und Herstellern in der Krise mit KfW-Bürgschaften helfen
Die Beschäftigten im Blick haben – Qualifizierungs-Kurzarbeit für Arbeiter
Ausschreibemengen erhöhen und Ausbauziele gesetzlich festlegen (auf 5.000 - 6.000 Megawatt netto pro Jahr)
Ausbau auch in den Südländern ermöglichen
Flächenziel festlegen, Planungs- und Genehmigungsverfahren beschleunigen
By John Krzyzaniak, Nicholas R. Brown, Bulletin of the Atomic Scientist, December 18, 2019
Overall, although existing and new nuclear reactors may indeed be part of a long-term carbon-free energy mix in the United States, the public has good reason to be skeptical that thorium can or should play any role in the future.
Claim: Thorium reactors would be more economical than traditional uranium reactors, particularly because thorium is more abundant than uranium, has more energy potential than uranium, and doesn’t have to be enriched.
False. Although thorium is more abundant than uranium, the cost of uranium is a small fraction of the overall cost of nuclear energy. Nuclear energy economics are driven by the capital cost of the plant, and building a power plant with a thorium reactor is no cheaper than building a power plant with a uranium reactor. Further, using thorium in existing reactors is technically possible, but it would not provide any clear commercial benefit and would require other new infrastructure.
Additionally, there is technically no such thing as a thorium reactor. Thorium has no isotopes that readily fission to produce energy. So thorium is not usable as a fuel directly, but is instead a fertile nucleus that can be converted to uranium in a reactor. Only after conversion to uranium does thorium become useful as a nuclear fuel. So, even for a reactor that would use thorium within its fuel cycle, most energy produced would actually come from uranium fissions.
Claim: Next generation thorium reactors would be safer than current reactors.
True but misleading. Nuclear energy is already very safe, and Yang is correct about that. The current US nuclear fleet generates about 20 percent of all electricity in the United States and has an excellent safety record—despite accidents such as Three Mile Island. When it comes to new reactors, although some next-generation designs offer potential safety benefits relative to current reactors, they could be operated in either thorium-uranium or uranium-plutonium fuel cycles. Consequently, the benefits are a function of the inherent safety in the next-generation designs, not the utilization of thorium.
Claim: The waste from thorium reactors would be easier to deal with than waste from today’s uranium reactors.
False. A comprehensive study from the US Energy Department in 2014 found that waste from thorium-uranium fuel cycles has similar radioactivity at 100 years to uranium-plutonium fuel cycles, and actually has higher waste radioactivity at 100,000 years.
Claim: Thorium would be more proliferation-resistant than current reactors—you can’t make nuclear weapons out of it.
False. A 2012 study funded by the National Nuclear Security Administration found that the byproducts of a thorium fuel cycle, in particular uranium 233, can potentially be attractive material for making nuclear weapons. A 2012 study published in Nature from the University of Cambridge also concluded that thorium fuel cycles pose significant proliferation risks.
Claim: Building new nuclear reactors will likely be necessary if the United States wants to achieve net-zero emissions by 2049.
True. Nuclear energy is already the primary ultra-low carbon energy source for base-load electricity generation. Although solar and wind have their place in the energy mix, the primary benefit of nuclear energy is that it is not intermittent, as solar and wind are, so it is almost always available without needing energy storage. So new nuclear reactors will be necessary to both replace aging ones and to meet a net-zero carbon emissions goal. But thorium-uranium fuel cycles provide no inherent benefits relative to uranium-plutonium fuel cycles, so the new reactors need not be thorium-powered.
... Unterdessen haben sich vier Mitglieder der Kohlekommission kritisch zu dem erzielten Ausstiegsplan geäußert. Was Kommission und Bundesregierung vereinbart hatten, habe die Bundesregierung in ihrer Abmachung mit den Ländern nicht umgesetzt. Das Ergebnis sei "ein gänzlich anderes", sagte die ehemalige Co-Vorsitzende der Kommission, Barbara Praetorius laut Süddeutscher Zeitung. Sie äußerte sich zusammen mit drei weiteren Mitgliedern der Kommission, die vor etwa einem Jahr ein Konzept für den Kohleausstieg vorgelegt hatte, in deutlichen Worten.
Die Bundesregierung habe eine 1:1-Umsetzung des Kompromisses angekündigt, so Praetorius. Es gebe aber wichtige Abweichungen: Die Abschaltung der Kohlekraftwerke sei zu spät und nicht stetig geplant. Kai Niebert vom Deutschen Naturschutzring erklärte laut SZ, der Abschaltplan sei "klimapolitischer Unsinn und energiepolitischer Irrsinn". Dass das Kraftwerk Datteln 4 jetzt doch ans Netz gehen soll, sei "ein völlig falsches Signal". Außerdem sei "besonders inakzeptabel, dass die Zerstörung der Dörfer einfach weitergeht und der Hambacher Wald nur teilweise verschont wird".
Die Bundesregierung sollte sich dafür einsetzen, dass Naturkatastrophen nicht zu Schuldenkrisen in armen Ländern führen. Dazu sollte sie sich bei den Klimaverhandlungen ebenso wie
im
Financing for Development
-Prozess der Vereinten Nationen (UNO) und im Internationalen
Währungsfonds (IWF) für die Schaffung einer Entschuldungsoption zugunsten von Ländern,
die besonders vom Klimawandel betroffen sind, einsetzen. Diese sollte aus einem Schuldenmoratorium und einer alle Forderungen umfassenden Umschuldung bestehen.
Um das System der internationalen Kreditvergabe und die damit verbundenen Schuldenrestrukturierungen für Gläubiger wie Schuldner berechenbarer zu machen, sollte aus solchen
Einzelfall-Entscheidungen ein effizientes und rechtsstaatliches Staateninsolvenzverfahren für
hoch verschuldete und zahlungsunfähige Staaten werden.
Die Bundesregierung sollte dazu regionale Initiativen wie sie die Gruppe der Niedrigeinkommensländer und die Karibische Staatengemeinschaft in der UNO angeregt haben, aktiv politisch unterstützen.
Nikita Pavlenko, Bryan Comer, PhD, Yuanrong Zhou, Nigel Clark, PhD, Dan Rutherford, PhD, The International Council on Clean Transportation, 2020.01.28
Figure 8 from climate implications of using LNG as a marine fuel
More and more ships, including container ships and cruise ships, are being built to run on liquefied natural gas (LNG), which emits approximately 25% less carbon dioxide (CO2) than conventional marine fuels in providing the same amount of propulsion power. However, LNG is mostly methane, a potent greenhouse gas (GHG) that traps 86 times more heat in the atmosphere than the same amount of CO2 over a 20-year time period. To better understand the full climate impacts of using LNG as a marine fuel, this study compares the life-cycle GHG emissions from LNG, including upstream emissions from leakage during extraction, processing, and transport and downstream emissions from combustion and unburned methane, to those of heavy fuel oil, very low sulfur fuel oil, and marine gas oil (MGO).
The authors use a representative life-cycle emission factor as well as the 100-year and 20-year global warming potentials (GWPs) for methane included in the Intergovernmental Panel on Climate Change’s Fifth Assessment Report. The 20-year GWP better reflects the need to reduce GHGs quickly, in order to meet the International Maritime Organization’s (IMO) climate goals, and the results show that when combined with a trend toward higher leakage, there is no climate benefit from using LNG, regardless of the engine technology.
Additionally, as illustrated in the figure below, the most popular LNG marine engine—low-pressure dual fuel (LPDF), medium-speed, four-stroke—is also the leakiest. Using LNG, this technology emitted 70% to 82% more life-cycle GHGs than MGO. The IMO has signaled that it will regulate GHGs under its initial GHG strategy and continued investment in LNG infrastructure on ships and on shore risks making it harder to transition to zero-emission vessels in the future. Investments should instead be focused on technologies that reduce total life-cycle GHG emissions, including energy-saving technologies, wind-assisted propulsion, zero-emission fuels, batteries, and fuel cells.
Methane emissions from the U.S. oil and natural gas supply chain were estimated using ground-based, facility-scale measurements and validated with aircraft observations in areas accounting for ~30% of U.S. gas production. When scaled up nationally, our facility-based estimate of 2015 supply chain emissions is 13 ± 2 Tg/y, equivalent to 2.3% of gross U.S. gas production. This value is ~60% higher than the U.S. EPA inventory estimate, likely because existing inventory methods miss emissions released during abnormal operating conditions. Methane emissions of this magnitude, per unit of natural gas consumed, produce radiative forcing over a 20-year time horizon comparable to the CO2 from natural gas combustion. Significant emission reductions are feasible through rapid detection of the root causes of high emissions and deployment of less failure-prone systems.
Zehn von über 1.200 überprüften Anbietern sind nach den ROBIN WOOD-Ökostromkriterien empfehlenswert.
Kriterien
100% Ökostrom
Der Anbieter verkauft ausschließlich Strom aus Erneuerbaren Energiequellen. Der Strom wird über direkte Lieferverträge mit Erzeugerkraftwerken bzw. über Zwischenhändler mit direkten Lieferverträgen bezogen.
Unabhängigkeit
Es gibt keine direkte eigentumsrechtliche Verflechtung des Anbieters mit einem Konzern, der Atom- oder Kohlekraftwerke betreibt oder mit Strom aus diesen Quellen handelt.
Zusätzlichkeit
Der Anbieter fördert die Energiewende durch den Bezug von Strom aus Neuanlagen und/oder feste Investitionsprogramme. Das heißt: mindestens 33 % der genutzten installierten Leistung stammt aus Anlagen, die nicht älter als zehn Jahre sind und/oder die Energiewende wird mit einem festen Förderbetrag von mind. 0,5 ct/kWh (im Durchschnitt der Tarife) gefördert.
Kein Geld für Kohle und Atom
Der Anbieter bezieht Strom von Erzeugungsanlagen, die allenfalls geringfügige Verflechtungen mit Kohle- oder Atomkonzernen aufweisen. Neuinvestitionen des Anlageneigentümers oder -betreibers in Kohle- und Atomkraftwerke sind nicht zulässig. Detaillierte Informationen zu den Kriterien gibt es hier.
Von Kai Rüsberg, Umwelt und Verbraucher, Deutschlandfunk, 4.2.2020
Die EU-Kommission will dem Gas den Rücken kehren, genauso wie Öl und Kohle. Doch ein Forschernetzwerk beklagt nun: Der Gasmarkt soll in den kommenden Jahren massiv ausgebaut werden, obwohl diese Kapazitäten nicht mehr benötigt würden.
In der EU sind in den nächsten Jahren öffentliche und private Investitionen in Gasinfrastruktur in gewaltiger Größenordnung geplant. Das weist der Bericht des Global Energy Monitor (GEM) nach,
in dem alle Gasinvestitionen in Planung oder Bau aufgelistet werden.
Insgesamt sollen Pipelines, Verladungshäfen oder Gaskraftwerke für 117 Milliarden Euro gebaut werden.
Die Investitionen würden Europas Gasimportkapazitäten um 30 Prozent erhöhen, fasst der Direktor des GEM, Ted Nace, zusammen.
"Die Gasinvestitionen werden 30 bis 40 oder sogar 50 Jahre in Betrieb sein, aber Ziel der Europäischen Regierung ist es eigentlich, fossiles Gas bis 2050 auslaufen zu lassen. Und es bis 2030 deutlich um 40 Prozent zu reduzieren.
Dabei würden diese Kapazitäten für Erdgas gar nicht benötigt, so der GEM. Bereits die aktuell vorhandene Kapazität sei 1,8 Mal so groß wie der aktuelle Bedarf. Nace befürchtet, wenn die Kapazitäten ausgebaut würden, einen Lock-In Effekt: eine Festschreibung auf viele Jahrzahnte.
"Der Lock-In-Effekt bedeutet, wenn man die Kapazitäten für nicht benötigte Anlagen aufbaut, wird es schwieriger auf die neuen nachhaltigen Anlagen umzustellen. Zudem wird dafür das Geld weggenommen."
Allein in Deutschland sind 15 Milliarden Euro an Investitionen für LNG Gas geplant, das ist verflüssigtes Erdgas, das vor allem per Schiff angeliefert wird. Darin enthalten sind Investitionen
in geplante oder in Bau befindliche Pipelines für 4,5 Milliarden Euro,
LNG-Terminals für knapp 2 Milliarden Euro sowie
Gaskraftwerke für fast 9 Milliarden Euro.
Claudia Kemfernt (DIW): "Wir denken sogar und haben das in einer Studie nachgewiesen, dass man damit den Umstieg hin eben zu einer Vollversorgung mit erneuerbaren Energien eher behindert, als unterstützt. Erneuerbare Energien sind heute schon preiswerte als fossiles Erdgas und aus dem Grunde braucht man eben keine neue fossile Erdgasinfrastruktur." Die Studie des GEM hält sie für hilfreich. Sie zeige, dass Deutschland und die EU diese Ausbauvorhaben überdenken müssten.
"Aber wir planen ja eine Vollversorgung mit erneuerbaren Energien und da ist die Frage, ob man überhaupt noch fossile Infrastruktur in dem Umfang benötigt. Gerade die fossile Erdgasinfrastruktur rechnet sich nur, wenn man sehr lange Zeiträume im Blick hat, also mehrere Jahrzehnte."
NRW-Wirtschaftsminister Andreas Pinkwart:
"Ich glaube, dass wir auf mittlere Sicht in Europa und auch in anderen Teilen der Welt einen wachsenden Gasbedarf haben werden – aufgrund der Tatsache, dass Länder wie Deutschland ja nicht nur aus Kernenergie aussteigen, sondern eben auch aus der Kohleverstromung und bei der Kohleverstromung haben wir natürlich auch die Kraft-Wärme-Kopplung, das heißt, sie haben auch entsprechend die Wärmeauskopplung."
Pinkwart sieht insbesondere für Nordrhein-Westfalen einen Bedarf aufgrund dessen, dass künftig kein Erdgas mehr aus den Niederlanden geliefert werden wird. Zudem sei der Ausbau eine Brückentechnologie hin zu Gasen aus erneuerbaren Quellen in Zukunft.
Die Kritiker von GEM:
wenn noch auf Jahrzehnte fossiles Gas verbrannt würde, würden die Klimaziele außer Reichweite geraten.
Nach Prognosen der EU-Kommission muss vielmehr die Nutzung von fossilem Gas um 29 Prozent reduziert werden, um die 2030-Klima- und Energieziele noch zu erreichen.
Von Anne Neumann, Leonard Göke, Franziska Holz, Claudia Kemfert und Christian von Hirschhausen, DIW-Wochenbericht 27, 2018
Schlussfolgerung
Der Bau einer zweiten Erdgaspipeline zwischen Russland und der EU mit Anlandepunkt in Norddeutschland (Lubmin/Greifswald) ist sowohl politisch als auch energiewirtschaftlich heftig umstritten. Russland ist sowohl an einer starken Präsenz im westeuropäischen Erdgasmarkt interessiert als auch daran, mit Nord Stream 2 unabhängiger vom Erdgastransit durch die Ukraine zu werden.
Eine energiewirtschaftliche Analyse zeigt, dass die geplante zweite Erdgaspipeline Nord Stream 2
zur Sicherung der Erdgasversorgung in Deutschland und Europa nicht notwendig ist.
Einerseits ist damit zu rechnen, dass die Nachfrage nach Erdgas sowohl in Deutschland als auch in Europa weiter sinkt; Erdgas wird bei der Energiewende als Brückentechnologie nicht mehr benötigt und ist kurzfristig der kostengünstigeren Kohle und langfristig den erneuerbaren Energien in Verbindung mit Speichertechnologien unterlegen.
Andererseits ist das Angebot an Erdgas bereits heute diversifiziert und kann durch zusätzlich frei werdende Flüssiggaslieferungen noch ergänzt werden.
Aufgrund des absehbaren Rückgangs der europäischen Erdgasförderung wird daher eine teure Großpipeline aus Russland mit der geplanten Kapazität von 55 Milliarden Kubikmeter nicht benötigt.
Nord Stream 2 ist kein rentables Investitionsprojekt. Aus betriebswirtschaftlicher Perspektive erscheint es daher höchst fragwürdig. Den Wirtschaftlichkeitsberechnungen des Projektbetreibers liegen vermutlich unplausibel hohe Annahmen für Erdgasverbrauch und Marktpreise zugrunde. Allerdings ist die Faktenlage aufgrund mangelnder Transparenz der Berechnungen unklar.
Fest steht dagegen, dass die Netzbetreiber der Anschlussleitungen in Deutschland aufgrund einer übermäßig auskömmlichen, regulierten Rendite starke Anreize zum übermäßigen Leitungsausbau haben und daher Neuprojekte besonders konsequent verfolgt werden. Somit ist davon auszugehen, dass ErdgasverbraucherInnen in Deutschland sich an der Finanzierung des Projekts beteiligen müssten.
Die geplante zweite Ostseepipeline ist zur Sicherung der Erdgasversorgung in Deutschland und Europa nicht notwendig. Vielmehr ist zu befürchten, dass ihr Bau die Energiewende zu einer vollständigen Dekarbonisierung des Wirtschaftssystems in Deutschland und Europa behindert.
Martin Wolf is chief economics commentator at the Financial Times, London. He was awarded the CBE (Commander of the British Empire) in 2000 "for services to financial journaism".
To succeed in tackling the emergency, we need dramatic policies that are effective, legitimate and global.
... British journalist Paul Mason argues: "Labour wants to combat climate change through three mechanisms:
state spending,
state lending and the
state direction of private finance.”
This approach allows opponents to argue that the left is more concerned with destroying market economies than saving the planet. The mess created by trying to plan an economy into zero net emissions in a decade might bring all attempts at mitigation into disrepute.
... What, then, is to be done? The answers include a programme of action over three decades, starting now;
pragmatic resort to all policy tools, including
market-based incentives;
use of the revenue raised from carbon pricing to compensate losers and make the tax system and climate mitigation more efficient;
a stress on the local environment benefits of eliminating the use of fossil fuels; and, above all,
a commitment to climate as a shared global challenge.
In an era of populism and nationalism, is there any chance of all this? Not obviously, alas. If so, we will indeed have failed. But the young are surely right to expect better.
by The International Monetary Fund (IMF), October 2019
The October 2019 edition of the Fiscal Monitor focuses on the design of fiscal policies for climate mitigation at the domestic and international level.
This report emphasizes the environmental, fiscal, economic, and administrative case for using carbon taxes, or similar pricing schemes such as emission trading systems, to implement climate mitigation strategies. It provides a quantitative framework for understanding their effects and trade-offs with other instruments and applies it to the largest advanced and emerging economies. Alternative approaches, like "feebates” to impose fees on high polluters and give rebates to cleaner energy users, can play an important role when higher energy prices are difficult politically. At the international level, the report calls for a carbon price floor arrangement among large emitters, designed flexibly to accommodate equity considerations and constraints on national policies. The report estimates the consequences of carbon pricing and redistribution of its revenues for inequality across households. Strategies for enhancing the political acceptability of carbon pricing are discussed, along with supporting measures to promote clean technology investments.
Executive Summary
... The technological and policy means are available to switch from coal and other polluting fossil fuels to cleaner energy while maintain- ing robust economic growth and creating jobs. For the needed transformation to take place, a key challenge is to distribute its costs and benefits in a manner that can muster enough political support—both domestically and internationally.
This Fiscal Monitor argues that, of the various mitiga- tion strategies to reduce fossil fuel CO2 emissions, carbon taxes—levied on the supply of fossil fuels (for example, from oil refineries, coal mines, processing plants) in proportion to their carbon content—are the most powerful and efficient, because they allow firms and households to find the lowest-cost ways of reducing energy use and shifting toward cleaner alternatives. The burden of the tax in proportion to household consump- tion is moderately larger for lower-income households than for higher-income households in some countries (for example, China and the United States), but roughly equal or slightly smaller in others (Canada, India).
This chapter analyzes the carbon prices countries must impose to implement their mitigation strategies and the tradeoffs with other mitigation instruments. Limiting global warming to 2°C or less requires policy measures on an ambitious scale, such as an immediate global carbon tax that will rise rapidly to $75 a ton of CO2 in 2030.
Under such a scenario
over 10 years electricity prices would rise, on average, by 45 percent cumulatively and gasoline prices by 15 percent, for households, compared with the baseline (no policy action).
The revenue from such a tax (1.5 percent of GDP in 2030, on average, for the Group of Twenty [G20] countries) could be redistributed, for example,
to assist low-income households,
support disproportionately affected workers or communities (for example, coal-mining areas),
cut other taxes,
fund investment in clean energy infrastructure or United Nations Sustainable Development Goals,
reduce fiscal deficits, or
pay an equal dividend to the whole population.
...The shift from fossil fuels will not only transform an economy but also profoundly change the lives of households, businesses, and communities. Importantly, the shift would generate additional and immediate domestic environmental benefits, such as lower mortality from air pollution (725,000 fewer premature deaths in 2030 for a $75 a ton tax for G20 countries alone). Businesses that deploy new technologies would earn profits and create jobs, which in the renewables sector already reached 11 million globally in 2017.
... Meeting temperature stabilization goals does not mean that overall global energy investment must increase much further, but it does imply an urgent need to shift energy supply investment toward low-carbon sources. This is because the infrastructure built today will determine emission levels for decades. Additional policies are needed, such as incentives for research and development, temporary fiscal incentives to promote demand for low-emission technologies until they yield sufficient economies of scale, and green bond markets to facilitate access to private capital. Businesses that are considering longer term investments, such as for power generation, must be certain about future tax and regula- tory policies, so policymakers should lock in mitigation policies for as long as possible, including making com- mitments to the global community.
Different policy tools have pros and cons, but the climate crisis is urgent and existential, calling on key stakeholders to deploy all appropriate policy measures. Finance ministers can confront this crisis by under- taking carbon taxation or similar policies, making climate change mitigation more acceptable through complementary tax or expenditure measures, ensuring adequate budgeting for clean technology investment, and coordinating strategies internationally.
Introduction
Without substantial mitigation of greenhouse gas emissions, global temperatures are projected to rise by around 4°C above preindustrial levels by 2100 (they have already increased by 1°C since 1900).1 Global warming causes major damage to the global economy and the natural world and engenders risks of cata- strophic and irreversible outcomes such as rising sea levels, extreme weather events (already more frequent) leading to loss of life, and the possibility of much higher warming scenarios.2 Carbon dioxide (CO2) emissions from fossil fuel combustion account for a dominant (63 percent) and growing share of global greenhouse gas emissions and are the most immediately practical to control (Figure 1.1, panel 1).3 Policy action is thus urgently needed to curtail emissions. The longer that action is delayed, the greater the accumulation in the atmosphere, and the more abrupt and costly will be the necessary action to stabilize global temperatures.
3. März, 2020
PEPs - Products, Environment, and Processes
Department of Chemical Engineering
Université de Liège - Sart-Tilman, Quartier Agora
Allée du Six Août 11, Bâtiment B6c, office 1/66
4000 Liège, Belgique
phone: +32 (0) 4 366-3521
andreas.pfennig@uliege.be
www.vision3000.eu
www.chemeng.uliege.be/pfennig
eigentlich muss meiner Meinung nach die Aussage differenzierter sein: Ohne aktives Zurückholen von CO2 aus der Atmosphäre ist das 1,5°C-Ziel nicht mehr zu erreichen. Da in den Studien nur von der transienten Temperaturerhöhung ausgegangen wird, die Gleichgewichtstemperatur Faktor 1,5 bis 2 darüber liegt (z.B. Eelco Rohling, The climate question, aber auch versteckt in den IPCC reports), das CO2 aber bei natürlichen Prozessen über Jahrhunderte in der Atmosphäre verbleibt, (zumindest der Anteil, die nicht von Ozean und Vegetation schnell aufgenommen wird - nur mit diesem Anteil müssen wir für die transiente Temperatur bis 2100 rechnen), müssen wir sowieso zwangsweise CO2 aktiv zurückholen, wenn wir Kipppunkte vermeiden wollen. Wir werden dann natürlich bis Ende des Jahrhunderts auf unter 1,5°C kommen können, wenn wir das Rückholen intensiv genug betreiben. Das ist natürlich eine ziemliche Hypothek auf die Zukunft. Die haben wir aber sowieso schon aufgenommen (auf uns und unsere Nachkommen genommen), weil wir die über 2Tt CO2 bereits in die Atmosphäre entlassen haben. Da kommt es meiner Meinung nach auch nicht auf die 100Gt CO2 wirklich an, um die sich das CO2-Budget nach neuesten Rechnungen verschiebt. Ich habe bei meinen Rechnungen übrigens mit 50% Wahrscheinlichkeit, 'alten' Werten für das Budget und mittlerem Bevölkerungswachstum gerechnet, wohl vorausgesetzt, dass sich die Gesellschaften ökonomisch weiter entwickeln und entsprechend mehr Energie nutzen (s. Zitat in E-Mail unten), weil nur so das Bevölkerungswachstum gestoppt werden kann. Verschiebung auf 67% Sicherheit ergibt eine 0,13°C höhere Temperatur bei dem Szenario - ohne CDR.
Die Konsequenz muss meiner Meinung nach sein, dass man sich nicht in das 1,5°C-Klimaziel verbeißt. Dies rührt womöglich aus der Bestrebung her, die Situation in einer einzigen Zahl kulminiert zu beschreiben. Das wird der Situation aber sowieso nicht gerecht, weil die deutlich komplexer ist als es eine Zahl ausdrücken kann. Ich formuliere dies in Vorträgen so:
Wir müssen CO2 aus der Atmosphäre wieder zurückholen: Welch' eine Hypothek!
Ohne CDR haben wir das 1,5°C-Klimaziel verschlafen.
Um die Energiewende möglichst einfach zu gestalten und hinterher möglichst wenig CO2 wieder zurückholen zu müssen, müssen wir dringendst den Energiekonsum reduzieren, was auch den CO2-Ausstoß reduziert.
Mir ist dabei immer wichtig, die Gründe sortiert zu haben:
Energiewende, um den Klimawandel zu stoppen
schnelle Energiewende, um möglichst wenig CO2 wieder zurückholen zu müssen und so die Hypothek zu verringern
Energiesparen, um die Energiewende zu erleichtern und weniger CO2 zurückholen zu müssen.
So müssen wir z.B. nach der Energiewende nicht mehr Energie sparen - es ist ja alles regenerativ... Ich weiß, mehr Energie braucht auch mehr Ressourcen insgesamt. Aber die Aussage deutet doch an, dass Energiesparen alleine wegen des Klimawandels nicht wirklich zwingend zu begründen ist, dazu braucht es eben einen Schritt mehr in der Logik.
Jürgen Blümer
3. März 2020
Im Anhang die Präsentation von Andreas Pfennig, die bereits einmal verschickt wurde:
"Szenarien, die eine lineare Abnahme der Emissionen annehmen, sind - unabhängig von dem womöglich zugrundeliegenden Wirtschaftsmodell - meiner Meinung nach unrealistisch. In der Vergangenheit ist das, was ich Substitutionsrate bezeichne (s. Anhang) exponentiell gestiegen (annähernd linearer Verlauf bei logarithmischer Skalierung). Wenn man dies weiterrechnet, kommt man auf die Szenarien im Anhang, die realistischer sind. Dabei sind 3% bis 4% pro Jahr Substitutionsrate maximal ökonomisch sinnvoll. Bei einer Lebensdauer von heute bereits 25 bis 30 Jahren bei Windrädern und Photovoltaik benötigen wir langfristig einen Austausch von Altanlagen zu 3,3% bis 4% pro Jahr. Wesentlich über diese Grenzen bei der Substitutionsrate zu gehen ist zwar möglich, aber - wohl recht unabhängig vom präferierten Wirtschaftsmodell - volkswirtschaftlich nicht sinnvoll. Für den Einfluss verzögerter Anstrengungen wurde eine Wachstumsrate von Solar&Wind von 30% p.a. angenommen, bis die maximale Substitutionsrate erreicht ist, die dann gehalten wird bis alle Energie erneuerbar erzeugt wird. Es wurde angenommen, dass bis 2050 der Pro-Kopf-Energiekonsum nach Arto et al. erreicht wird, was auch etwa dem Trend der Vergangenheit entspricht (I. Arto, I. Capellán-Pérez, R. Lago, G. Bueno, R. Bermejo, 2016: The energy requirements of a developed world. Energy Sustainable Dev. 33, 1-13. https://doi.org/10.1016/j.esd.2016.04.001). Danach sind gut 1,6°C gerade noch machbar. Wenn wir uns sofort mit maximal 4% p.a. Substitutionsrate anstrengen, sogar 1,7°C. Es wurde die mittlere Variante des Bevölkerungswachstums der UN (world population prospect 2019) zugrundgelegt. Wir die hohe Variante gewählt (vgl. https://doi.org/10.1002/cben.201900006), liegen die erreichbaren Temperaturen ein paar Hundertstel darüber. Und das alles mit der Temperaturantwort bei 50% Sicherheit, bei 67% wird es etwas schlimmer. Dies kann nur verhindert werden, wenn wir zügig anfangen aufzuforsten und/oder BECCS zu betreiben. Für beides fehlen uns aber aktuell die politischen/technischen Voraussetzungen, um dies im benötigten world-scale-Maßstab zu realisieren."
--> Fazit hier: "wir haben das 1,5°C-Klimaziel verschlafen!"
- Andreas geht in seinen Kalkulationen von einem Restbudget von 360 GT CO2 (für 66%-Wahrscheinlichkeit Einhaltung 1,5°C)
Niels-Arne Münch schrieb dazu:
"1. Ist das genannte Budget von 340GT Budget (so klein es auch ist) nach aktuellem Stand zu hoch: Die Budgetberechnungen beruhen auf den veralteten Berechnungen für den 5. Sachstandabericht. Inzwischen laufen die Berechnungen für den kommenden 6. Bericht und "laufen heiß". Wo das hinführen wird, ist derzeit noch unklar, aber die aktuellsten mir bekannten Budgetberechnungen stammen aus dem constrain-eu Bericht berücksichtigen die verfügbaren CMIP6-Simulationen und einige Kippunkte. Demnauch beträgt das Restbudget für 66% nur noch 235GT:"
Fasst man beide Aussage zusammen, muss man festhalten: 1.5°C ist nicht mehr zu halten als Ziel.
by Sam Meredith, Published Tue, Jan 14 20205:01 AM EST, Updated Tue, Jan 14 20204:43 PM EST
In an annual letter to CEOs published Tuesday, BlackRock Chief Executive Larry Fink said: “Climate change has become a defining factor in companies’ long-term prospects … But awareness is rapidly changing, and I believe we are on the edge of a fundamental reshaping of finance.”
“Climate change is almost invariably the top issue that clients around the world raise with BlackRock. From Europe to Australia, South America to China, Florida to Oregon, investors are asking how they should modify their portfolios,” Fink continued.
“And because capital markets pull future risk forward, we will see changes in capital allocation more quickly than we see changes to the climate itself.”
“In the near future — and sooner than most anticipate — there will be a significant reallocation of capital,” he added.
by Pippa Stevens, Published Thu, Jan 16 20207:27 AM EST, Updated Thu, Jan 16 20209:23 AM EST
McKinsey said (in cache) trillions of dollars in economic activity and hundreds of millions lives are at risk from a changing climate.
“Much as thinking about information systems and cyber-risks has become integrated into corporate and public-sector decision making, climate change and its resulting risks will also need to feature as a major factor in decisions,” McKinsey Global Institute director Jonathan Woetzel said.
BlackRock CEO Larry Fink warned this week that the intensifying climate crisis will bring about a fundamental reshaping of finance, with a significant reallocation of capital set to take place “sooner than most anticipate.”
The U.S. Nuclear Regulatory Commission (NRC) has published the Draft Environmental Impact Statement (DEIS) for the Holtec International/Eddy-Lea Energy Alliance irradiated nuclear fuel consolidated interim storage facility (CISF) in New Mexico. See the U.S. Nuclear Regulatory Commission (NRC) press release. And see the 488-page NRC DEIS NUREG-2237 DFC, "Environmental Impact Statement for the (sic) Holtec International's License Application for a Consolidated Interim Storage Facility for Spent Nuclear Fuel and High Level Waste" (executive summary 40 pages).
Das langfristige Ziel muss ein umfassendes und damit effizientes EU-Emissionshandelssystem über alle Sektoren und europäischen Länder sein“, sagt IfW-Präsident Gabriel Felbermayr. Wie dies möglich ist, zeigen die Experten des IfW Kiel Gabriel Felbermayr, Sonja Peterson und Wilfried Rickels in dem heute erschienenen Kiel Policy Brief „Schrittweise zu einem umfassenden europäischen Emissionshandel“. Der existierende europäische Emissionshandel EU ETS sei eine Erfolgsgeschichte: Die Emissionsziele werden effektiv und effizient erreicht. Emissionen weiterer Sektoren in das EU ETS einzubeziehen sei allerdings nur im Rahmen einer größeren EU-Reform möglich.
„Trotzdem kann Deutschland jetzt den ersten Schritt zu einem umfassenden System gehen“, so Felbermayr weiter, „und für die bisher nicht im EU ETS erfassten CO2-Emissionen einen innerdeutschen Emissionshandel einführen“. Dieses zweite System, etwa für die Bereiche Verkehr und Gebäude, könne zunächst von Deutschland und anderen willigen Mitgliedsstaaten wie Frankreich, den Niederlanden und den skandinavischen Ländern betrieben und mittelfristig auf alle EU-Staaten ausgedehnt werden. Schließlich sollten beide Emissionshandelssysteme, das bisherige und das neue, fusionieren.
Damit der heimische Klimaschutz nicht konterkariert wird, fordern die Autoren ein WTO-konformes CO2-Grenzausgleichssystem für das europäische Emissionshandelssystem: Vergleichbar zur Mehrwertsteuer wird der CO2-Gehalt der Exporte von der heimischen CO2-Bepreisung ausgenommen, jener der Importe aber der heimischen CO2-Bepreisung unterworfen. Andernfalls drohen Wettbewerbsnachteile für heimische Produzenten, die dann ins Ausland abwandern könnten. Ebenso droht sonst die Substitution von heimischen, der CO2-Bepreisung unterworfenen Produkten durch nicht der CO2-Bepreisung unterworfene Importe. Ein CO2-Grenzausgleichssystem erschwert es, dass der CO2-Ausstoß lediglich in andere Länder verlagert aber nicht verringert wird.
Status quo: Stark schwankende CO2-Preise außerhalb des EU ETS
Das bisherige europäische Emissionshandelssystem EU ETS – das zentrale Instrument der europäischen Klimapolitik – deckt nur etwa 41 Prozent der europäischen Treibhausgasemissionen ab (2017). Nicht enthalten sind beispielsweise die Emissionen aus den Sektoren Verkehr, Gebäude, Landwirtschaft und Abfall. In diesen Sektoren, so der aktuelle Stand, soll eine Emissionsreduktion über nationale Ziele der einzelnen Mitgliedsstaaten erreicht werden. Während dies für das Jahr 2020 noch voraussichtlich immerhin 20 von 28 Staaten erreichen werden, schätzt die Europäische Umweltagentur, dass nur sechs Staaten ihre Zielvorgaben im Jahr 2030 erfüllen werden.
Deutschland gehört sogar zu den Ländern, die ihre nationalen Reduktionsziele für Emissionen außerhalb des EU ETS sowohl in 2020 als auch in 2030 (voraussichtlich) verpassen werden. Besonders problematisch ist der Verkehrssektor, hier steigen die Emissionen sogar, während sie bei den privaten Haushalten und in der Landwirtschaft stagnieren.
Den ausbleibenden Emissionsreduktionen steht eine Vielzahl von unterschiedlichen Instrumenten gegenüber, die implizit dafür sorgen, dass es in Deutschland sehr stark schwankende CO2-Preise gibt. Ein aktuelles Gutachten des wissenschaftlichen Beirats beim BMWi zeigt, dass
elektrischer Strom für private Haushalte durch die Stromsteuer, die EEG- und die KWKG-Umlage mit ca. 184 Euro je Tonne CO2 belastet wird;
Erdgas und leichtes Heizöl zur Wärmegewinnung mit nur 29 bzw. 23 Euro Energiesteuer pro Tonne CO2,
Benzin und Diesel werden durch die Ökosteuer mit etwa 64 bzw. 58 Euro pro Tonne CO2 belastet.
Felbermayr: „Die Bandbreite dieser Preise – insbesondere auch, wenn man die Preise im EU ETS berücksichtigt – zeigt, wie weit Deutschland von einem einheitlichen CO2-Preis und damit von einer effizienten Klimapolitik entfernt ist.
Eine fatale Entwicklung für das Gemeinschaftswerk Energiewende und konsequenten Klimaschutz! Gerade dieser kann uns mit einem Plan für 100% Erneuerbare Energien und klimafreundliche Jobs den Weg aus der dramatisch drohenden Wirtschaftskrise weisen. In den vergangenen zwei Jahren sind allein in der Windindustrie 40.000 Arbeitsplätze verloren gegangen. Und das sind die Arbeitsplätze für die Zukunft der Wirtschaft und unseres Planeten!
Windenergie schafft Arbeitsplätze: 2016 waren 160.200 Menschen in der Windbranche beschäftigt. Davon 27.200 Menschen im Bereich Offshore- und 133.000 Menschen im Bereich Onshore-Windenergie. Im Jahr 2017 kam es aber zu einem deutlichen Arbeitsplatzabbau in der Branche. Demnach sind zum Jahresende nur noch 135.100 Menschen in der Windenergie beschäftigt (112.100 Onshore und 23.000 Offshore). Aufgrund der rückläufigen Installationszahlen ist mit weiterem Arbeitsplatzabbau in der Branche zu rechnen.
Quelle: Gesellschaft für wirtschaftliche Strukturforschung im Auftrag des BMWi (2016) bzw. des BWE, VDMA Power Systems und der Offshore-Wind-Industrie-Allianz.
Sven Ullrich, Erneuerbare Energien, 23. April 2020
„Eine vergleichbare Eintrübung in so kurzer Zeit haben wir nie zuvor beobachten können”, ist Carsten Körnig, Hauptgeschäftsführer des BSW Solar, entsetzt. „Immer mehr Solarunternehmen geraten in Existenzangst. Häufigste genannte Ursache ist der nahende Solardeckel, während sich das Coronavirus bislang kaum dämpfend auf die Nachfrage nach Solarstromanlagen auswirkt.”
Kommentar zum Pfeifferschen Vorstoß -
Verbesserte Ausbaubedingungen statt übler Tauschgeschäfte
Sven Ullrich, Erneuerbare Energien, 14.1. 2020
Das haben die Experten [Volker Quaschning et al.] von der HTW in Berlin ausgerechnet:
415 Gigawatt Photovoltaik (PV),
200 Gigawatt Onshore-Windkraft,
76 Gigawatt Offshore-Windkraft und
20 Gigawatt Biomasseleistung
werden gebraucht, um bei üppigen Effizienzmaßnahmen eine klimaneutrale Energieversorgung zu erreichen. Dieser Ausbau wiederum gelingt nicht ohne entsprechende Rahmenbedingungen, zu denen der Wegfalls des Ausbaudeckels für die Photovoltaik in Höhe von 52 Gigawatt genauso gehört wie die Möglichkeit, die Windkraft weiter auszubauen. Inzwischen liegen auch eine ganze Reihe von Vorschlägen auf dem Tisch, wie das bürgerverträglich passieren kann.
Da wäre eine
kommunale oder Bürgerbeteiligung an den Renditen der Anlagen, vereinfachte Genehmigungsverfahren, Abstandsregelungen, die den Ausbau der Windkraft weiter ermöglichen.
Ein zweiter Schritt wäre, die Netznutzungsgebühren vom Transportweg des genutzten Stroms abhängig zu machen.
Volker Quaschning
Werden die Effizienzmaßnahmen nicht umgesetzt, steigt der Strombedarf auf bis zu 3000 TWh/a an. Diese Strommenge in absehbarer Zeit klimaneutral zu decken ist unrealistisch. Selbst für einen Strombedarf von 1300 TWh/a muss das Ausbautempo von Solar- und Windkraftanlagen deutlich steigen.
Agora-Energiewende & Prognos in Studie (2020) "Klimaneutrales Deutschland" (s. unten): Nettostromerzeugung bei Sektorkopplung: 848 TWh/a
52-GW-Solardeckel trägt den technischen Restriktionen der Braunkohle- und Kernkraftwerke Rechnung. 60 GW PV lässt sich durch Androsseln dieser Grundlastkraftwerke noch verwirklichen. Langfristig bedeutet das maximal 10% Solarstrom im Netz. Das reicht ncht für die Energiewnde und den Klimaschutz.
Bei 200GW installierter Solarstromleistung erreicht man ....
... 25% Solarstrom im Jahresmittel
Ein Tag mit viel Windenergie.
10 GW Grundlast sind zur Gewährleistung der Versorgungsstabilität nötig.
Windenergieausbau: technisch ist das handhabbar. Aber man geht in den Regularien immer noch davon aus, dass klassische Anlagen die Grundlast sicherstellen und Schwankungen im Netz ausgleichen. Wenn diese nicht mehr da sind, müssen wir schnell daran arbeiten, die Erneuerbaren diese Aufgaben übernehmen zu lassen, und wir brauchen für die Aufgabe nicht nur Erbeuerbare Energie mit Regelauflagen sondern auch Speichern. ... Die Leitungen, die wir heute planen, gehen davon aus, dass wir einen sehr langsamen Ausbau der Erneuerbaren haben werden und die Kohlekraftwerke weiter betreiben.
Je dunkler das Gebiet, dest mehr Strom wird verbraucht.
Behauptung: Diese Leitungen werden gebraucht, um den Windstrom von Norddeutschland in den Süden zu transportieren. Aber die Leitungen gehen an den Verbrauchszentren vorbei und binden Kohlekraftwerke ein, nicht Windparks.
Es gibt keine seriösen Berechnungen für den Leitungsbedarf beim Einbinden der notwendigen Mengen an Erneuerbaren Energien.
Die Novelle des EEG soll den notwendigen Rahmen schaffen, um den Anteil erneuerbarer Energien an der Stromversorgung – als Zwischenziel auf dem Weg zu einer umfassenden Transformation der Energieversorgung – bis zum Jahr 2025 auf 40 bis 45 Prozent und bis 2035 auf 55 bis 60 Prozent zu steigern. Hierfür wird ein gesetzlicher Ausbaupfad für die einzelnen Erneuerbare-Energien-Technologien verankert, der
z.B. für die Windenergie an Land von einem jährlichen Zubau von 2 500 MW (netto) ausgeht. Um die Ausbauziele zu erreichen, werden neue Instrumente der Mengensteuerung eingeführt.
Der weitere Ausbau der erneuerbaren Energien soll sich stärker auf die kostengünstigen Technologien konzentrieren. Gleichzeitig soll die Kosteneffizienz durch den Abbau von Überförderungen, die Streichung von Boni und eine ambitionierte, stärker an dem tatsächlichen Zubau ausgerichtete Degression der Fördersätze verbessert werden.
Darüber hinaus sollen spätestens 2017 die finanzielle Förderung und ihre Höhe für die erneuerbaren Energien wettbewerblich über technologiespezifische Ausschreibungen ermittelt werden. Um Erfahrungen mit Ausschreibungen zu sammeln, wird die Förderung von Photovoltaik-Freiflächenanlagen als Pilotmodell auf ein Ausschreibungssystem umgestellt; hierfür legt dieses Gesetz die Grundlage. Die Umstellung der finanziellen Förderung auf andere erneuerbare Energien erfolgt durch ein anschließendes Gesetzgebungsverfahren.
Die Integration der erneuerbaren Energien in den Strommarkt wird vorangetrieben, indem die Direktvermarktung grundsätzlich verpflichtend wird. Bei Biomasse wird sichergestellt, dass die Anlagen künftig stärker bedarfsorientiert einspeisen; die damit verbundene Reduzierung der jährlichen Stromerzeugung wird durch einen Flexibilitätszuschlag ausgeglichen.
Schließlich sieht die EEG-Novelle Änderungen vor, die zu einer angemessenen Verteilung der Kosten des Ausbaus der erneuerbaren Energien führen. Es sollen alle Stromverbraucher in adäquater Weise an den Kosten beteiligt werden, ohne dass die internationale Wettbewerbsfähigkeit der stromintensiven Industrie gefährdet wird. Vor diesem Hintergrund wird eine ausgewogene Regelung für eigenerzeugten, selbstverbrauchten Strom eingeführt, und die Besondere Ausgleichsregelung soll anhand objektiver, transparenter und europarechtskonformer Kriterien überarbeitet werden (die entsprechenden Bestimmungen für stromintensive Unternehmen werden zeitnah im weiteren Verfahren nachgetragen).
Zu Artikel 25 (Inkrafttreten; Außerkrafttreten)
Nach Satz 1 tritt dieses Gesetz grundsätzlich am 1. August 2014 in Kraft. Dieses schnelle In- krafttreten nach dem Abschluss des Gesetzgebungsverfahrens trägt dem Wunsch Rech- nung, so schnell wie möglich bestehende Kostensenkungspotenziale zu heben. Damit sollen auch sogenannte Vorzieheffekte verhindert werden, d.h. nach Möglichkeit sollen nach Ver- abschiedung der Eckpunkte für die EEG-Novelle neu geplante Projekte und Projekte, die sich zu diesem Zeitpunkt noch in einem frühen Stadium der Planungen befanden, unter das neue Recht fallen. Um gleichzeitig das Vertrauen bei weit fortgeschrittenen Planungen zu schützen, sind Regeln zum Schutz dieses Vertrauens in den Übergangsregelungen vorge- sehen (siehe oben). Hintergrund für das schnelle Inkrafttreten bereits Mitte 2014 ist auch die seit Februar 2013 andauernde Debatte um eine schnelle Novelle des EEG. Aufgrund dieser Debatte mussten und konnten sich alle Wirtschaftsteilnehmer auf eine baldige Reform ein- stellen, die nunmehr auch schnellstmöglich in Kraft treten soll.
Gleichzeitig treten das EEG 2012 und die Managementprämienverordnung außer Kraft.
Figure 1: Global GDP scenarios used to estimate response to COVID-19 Pandemic. The “optimistic” recovery scenario assumes a fast return to global GDP growth close to 3.4% p.a (OECD, 2020), whereas the “pessimistic” recovery scenario assumes a significant adverse impact on long-term growth rates, returning to sustained growth rates 10% lower than this.
Der VDI fordert in diesem Zusammenhang, zügig die bestehenden Hemmnisse zum Ausbau der Windenergie zu überwinden. Nach wie vor sind hierfür vier Ansätze nötig:
Änderung der Abstandsregelungen für Radaranlagen der Flugsicherung/li>
Beteiligung der betroffenen Bürger beziehungsweise Gemeinden an örtlichen Windkraftanlagen zur Erhöhung der Akzeptanz durch beispielsweise eine stärkere Beteiligung der Gemeinden an den finanziellen Erträgen der Anlagen/li>
Vereinfachung von Genehmigungsverfahren
Der SRU schlägt vor, bei den CO2-Emissionen mit einem CO2-Restbudget zu rechnen, das sich nach der Einwohnerzahl richtet.
Scientists for Future, 26.06.2020 S4F Berlin (im Cache)
International vereinbarte Klimaschutzziele können nicht eingehalten werden
Zur Einhaltung der international vereinbarten Klimaschutzziele ist entscheidend, dass Deutschland sein Gesamtbudget nicht überschreitet.
Ein klimaphysikalisch und verteilungsethisch gut begründbares CO2-Budget für Deutschland ist rund 6,7 Gt CO2 (SRU 2020).
Um das Klima möglichst schnell wirksam zu schützen, müssen insbesondere Maßnahmen mit geringen Vermeidungskosten und sehr hohen Einsparungseffekten ergriffen werden.
Ein schneller Kohleausstieg ist dabei wesentlich einfacher und volkswirtschaftlich günstiger als die Reduzierung von Treibhausgasen in anderen Branchen, z.B. dem Verkehrssektor oder der Stahl- oder Zementindustrie.
Eine volkswirtschaftlich verträgliche und mit den internationalen Klimaschutzzielen kompatible Minderung der Treibhausgasemissionen lässt sich nur mit einem Kohleausstieg bis etwa 2030 realisieren (Parra et al. 2019; Oei et al. 2020a).
Ein späterer Kohleausstieg, der dennoch ein Paris-kompatibles CO2-Budget einhält, wäre nur bei einer Reduktion der Kohleverstromung um bis zu 2/3 in der nächsten Legislaturperiode möglich (SRU 2017)./li>
Die absehbare Verschärfung der europäischen Klimaschutzziele – von minus 40 % auf minus 50 % oder gar minus 55 % in 2030 – würde zudem eine proportionale Verschärfung auch in Deutschland nach sich ziehen oder zumindest gefordert werden (Hainsch et al. 2020). Wenn Deutschland seine Emissionen weniger als proportional reduzieren wollte, müssten andere EU-Staaten mehr Reduktionen leisten, da die EU sich als Ganzes dem Pariser Klimaschutzabkommen verpflichtet hat und entsprechend ihre Beiträge berichten muss./p>
Zahlreiche Studien belegen, dass ein schnellerer Kohleausstieg bis 2030 möglich wäre (z.B. Oei et al. 2019, Kittel et al. 2020, Oei et al. 2020c). Vor diesem Hintergrund kommt Verheyen (2020) zu dem Schluss, dass der “Reduktionspfad der Bundesregierung – niedergelegt im Klimaschutzgesetz und dem KVBG-E [Kohleverstromungsbeendigungsgesetz … ] aus völkerrechtlicher und grundrechtlicher Perspektive nicht ausreichend” ist.
Entwurf eines Gesetzes zur Reduzierung und zur Beendigung der Kohleverstromung und zur Änderung weiterer Gesetze (Kohleausstiegsgesetz). Veröffentlichung 24.02.2020 https://dip21.bundestag.de/dip21/btd/19/173/1917342.pdf (zuletzt aufgerufen am 25.6.2020)
Bartholdtsen, Hans-Karl, Anna Eidens, Konstantin Löffler, Frederik Seehaus, Felix Wedja, Thorsten Burandt, Pao-Yu Oei, Claudia Kemfert, Christian von Hirschhausen. “Pathways for Germany’s Low-Carbon Energy Transformation Towards 2050”. Energies 2019, 12(15), 2988. https://www.mdpi.com/1996-1073/12/15/2988
Hainsch, Karlo, Hanna Brauers, Thorsten Burandt, Leonard Göke, Christian von Hirschhausen, Claudia Kemfert, Mario Kendziorski, Konstantin Löffler, Pao-Yu Oei, Fabian Präger and Ben Wealer. 2020. “Make the European Green Deal Real – Combining Climate Neutrality and Economic Recovery” DIW Berlin: Politikberatung kompakt 153. https://www.diw.de/documents/publikationen/73/diw_01.c.791736.de/diwkompakt_2020-153.pdf
Kittel, Martin, Leonard Goeke, Claudia Kemfert, Pao-Yu Oei Christian von Hirschhausen. 2020. “Scenarios for Coal-Exit in Germany – A Model-Based Analysis and Implications”. European Context. Energies 13, 2041. https://www.mdpi.com/1996-1073/13/8/2041
Löffler, Konstantin, Thorsten Burandt, Karlo Heinsch, Pao-Yu Oei. 2019. “Modeling the low-carbon transition of the European energy system – A quantitative assessment of the stranded assets problem”. Energy Strategy Reviews, Volume 26, November 2019, 100422. https://www.sciencedirect.com/science/article/pii/S2211467X19301142?via%3Dihub
Oei, Pao-Yu, Hauke Hermann, Philipp Herpich, Oliver Holtemöller, Benjamin Lünenbürger, Christoph Schult. 2020c. “Coal phase-out in Germany – Implications and policies for affected regions”. Energy Volume 196. https://www.sciencedirect.com/science/article/pii/S0360544220301110
Parra, Paola Yanguas, Niklas Roming, Fabio Sferra, Michiel Schaeffer, Ursula Fuentes Hutfilter, Anne Zimmer, Tino Aboumahboub, Bill Hare. 2018. “Science based coal phase-out pathway for Germany in line with the Paris Agreement 1.5°C warming limit: Opportunities and benefits of an accelerated energy transition”. Climate analytics. https://climateanalytics.org/media/germany_coalphaseout_report_climateanalytics_final.pdf (im Cache)
Rinscheid, Adrian, Rolf Wüstenhagen. 2019. “Policy Brief: German voters would prefer a more ambitious timeline to phase out coal”. Nature Energy, Vol. 4, 1016-1017. https://rdcu.be/b5aDU
Gemeinsame Pressemitteilung von Umweltbundesamt und Bundesministerium für Umwelt, Naturschutz und nukleare Sicherheit
Treibhausgasemissionen gingen 2019 um 6,3 Prozent zurück
Große Minderungen im Energiesektor, Anstieg im Gebäudesektor und Verkehr (Safari-Link, Firefox-Link)
WEGE FÜR DIE ENERGIEWENDE
Kosteneffiziente und klimagerechte
Transformationsstrategien für das deutsche
Energiesystem bis zum Jahr 2050
M. Robinius, P. Markewitz, P. Lopion et al., Forschungszentrum Jülich GmbH
Institut für Energie- und Klimaforschung
Techno-ökonomische Systemanalyse (IEK-3)
Schriften des Forschungszentrums Jülich,
Reihe Energie & Umwelt/Energy & Environment, Band/Volume 499
Treibhausgasemissionen und nationale Reduktionsziele
Abb. 5.1:
Szenariovergleich der Entwicklung der sektoralen CO2-Emissionen
Abb. 5.2:
Szenariovergleich der Entwicklung des Prmärenergieverbrauchs nach Energieträgern
Abb. 5.3:
Änderung des Primärenergieverbrauchs nach Energieträgern in 95% gegenüber 80%
Abb. 5.4:
Szenariovergleich der Entwicklung des Endenergieverbrauchs nach Sektoren
Abb. 5.5:
Szenariovergleich des Endenergieverbrauchs und der Energieeinsparung nach Sektor
Abb. 5.6:
Szenariovergleich der Entwicklung der Änderung der jährlichen Gesamtsystemkosten gegenüber 2020 sowie deren Zusammensetzung
Abb. 5.7:
Änderung der Gesamtsystemkosten gegenüber2020 sowie deren sektoralen Zusammensetzung
Abb. 5.8:
Szenariovergleich der Entwicklung des Nettostromverbrauchs nach Sektor
Abb. 5.9:
Szenariovergleich der Entwicklung der installierten elektrischen leistung nach Energieträger
Abb. 5.13:
Szenariovergleich der Entwicklung der installierten elektrischen Leistung von Freiflächen-PV nach Region
Abb. 5.14:
Szenariovergleich der Entwicklung der Bruttostromerzeugung nach Energieträger sowie des Anteils erneuerbarer Energien an der Stromerzeugung
Abb. 5.15:
Szenariovergleich der installierten elektrischen Leistung und der bereitgestellten elektrischen Energie nach Energieträger im Jahr 2050 (Szenario Offshore 95 und Veränderungen gegenüber Szenario 95)
Abb. 5.20:
Szenariovergleich Nettostromverbrauch nach Sektorkopplung
Tab. 3.1:
Treibhausgasemissionen nach Emissionsart und Klimaziele
Tab. 5.1:
Szenariovergleich Kostenübersicht
Tab. 5.2:
Installierte Windkraftkapazität
Tab. 5.3:
Installierte PV-Kapazität
... [Es] werden zwei CO2 Reduktionsszenarien analysiert, die sich ausschließlich an den Minderungszielen für das Jahr 2050 von 80 % (Szenario 80) und 95 % (Szenario 95) orientieren. Für die Analyse wird eine neuartige Modellfamilie eingesetzt, die am Forschungszentrum Jülich1 entwickelt wurde. Diese ermöglicht es, die nationale Energieversorgung in all ihren Wechselwirkungen und Pfaden abzubilden.
... Bis zum Jahr 2050 ist eine Minderung der Treibhausgasemissionen um 80 % – sowohl aus technischer als auch aus ökonomischer Perspektive – machbar. Um jedoch die Forderung nach einem klimaneutralen Deutschland im Sinne des Pariser Klimaschutzabkommens erfüllen zu können, bedarf es einer deutlich stärkeren Reduktion.
Eine Steigerung des Reduktionsziels auf 95% bis zum Jahr 2050 bringt gegenüber dem 80 % Szenario anspruchsvollere technische und wirtschaftliche Herausforderungen mit sich.
Allerdings ist ein Teil des für die Umsetzung notwendigen Technikportfolios heute schon verfügbar.
Andere Technologien stehen bereits im Fokus aktueller Forschungs und Entwicklungsarbeiten, so dass eine rechtzeitige Verfügbarkeit erwartet werden kann.
Insgesamt ist der zusätzliche finanzielle Aufwand nennenswert, die Summen sind jedoch in ihren Größenordnungen mit den gegenwärtigen Energiekostenkategorien vergleichbar und um ein vielfaches geringer als die Klimafolgekosten.
Als demgegenüber von größter Bedeutung zeigt sich in der Analyse, dass sich die Maßnahmenportfolios, die für das 80 %- und das 95 %-Reduktionsziel jeweils angemessen sind, erheblich voneinander unterscheiden.
So sind einige Maßnahmen zwar für ein Erreichen des 80 %-Ziels hilfreich.
Für die Einhaltung eines 95 %-Ziels sind Teile der 80 %-Maßnahmenaber nicht zielführend und im Gegenteil unter Umständen sogar kontra-produktiv.
Konkret: heute mittelfristiggeplante Maßnahmen dieser Zielkategorie würden bei einem 95 %-Ziel über kurz oder lang als „stranded investments“ enden.
Um die finanziellen Mittel effizient einzusetzen, sollten Wirtschaft und Politik mittelfristige Minderungsstrategien und die damit verbundenen Investitionsmaßnahmen bereits zu Beginn der 2020-Jahre konsequent auf das 95 %-Reduktionsziel ausrichten.
Der Ausbau von Energieinfrastrukturen benötigt erhebliche Vorlaufzeiten für die Planung und Umsetzung.
Mit der Planung der erforderlichen Infrastrukturen (z. B. Langzeitspeicher, Pipelines) sollte daher bereits frühzeitig begonnen werden.
25.06.2020 | Autor / Redakteur: Nathalie Matter* / Dr. Ilka Ottleben
In ganz Südeuropa war es nicht nur kalt, sondern auch feucht; dementsprechend schlecht fiel die Ernte aus. Die Sommerniederschläge, so die Berner Modellberechnungen, lagen zwischen 50 und 120 Prozent höher als gewöhnlich, und im Herbst regnete es gar viermal soviel wie üblich. Die Leidtragenden dieser Klimaextreme waren unter anderem die sich in einem blutigen Bürgerkrieg gegenüberstehenden Armeen der Mörder von Cäsar und seiner Nachfolger, wie der antike Geschichtsschreiber Plutarch eindrücklich berichtet.
Ganz anders waren die Folgen des Vulkanausbruchs in Alaska für Ostafrika. Der Sommermonsun verschob sich in den Süden und in Ägypten blieb die jährliche Sommer-Flut des Nils vollständig aus, was sich verheerend auf die Getreideproduktion auswirkte. In historischen Quellen wird denn auch von Nahrungsmittelknappheit und Hungersnot berichtet, was Königin Kleopatra davon abhielt, die Bürgerkriegsparteien mit dringend benötigtem Getreide zu versorgen.
Die AutorInnen der Studie zu den Folgen des Okmok-Ausbruchs räumen ein, dass es unterschiedliche Faktoren waren, die zum Fall der Römischen Republik und des ptolemäischen Königreichs beitrugen. Aber sie sind überzeugt, dass der Vulkanausbruch in Alaska und die dadurch ausgelösten abrupten Umweltveränderungen zusätzliche Stressfaktoren für diese antiken Reiche darstellten. „Unsere Entdeckung trägt dazu bei“, freut sich Michael Sigl, „eine Wissenslücke zu schließen, die Archäologinnen und Althistoriker lange ratlos machte.
Joseph R. McConnell, Michael Sigl, Gill Plunkett et al.
Abstract
The assassination of Julius Caesar in 44 BCE triggered a power struggle that ultimately ended the Roman Republic and, eventually, the Ptolemaic Kingdom, leading to the rise of the Roman Empire. Climate proxies and written documents indicate that this struggle occurred during a period of unusually inclement weather, famine, and disease in the Mediterranean region; historians have previously speculated that a large volcanic eruption of unknown origin was the most likely cause. Here we show using well-dated volcanic fallout records in six Arctic ice cores that one of the largest volcanic eruptions of the past 2,500 y occurred in early 43 BCE, with distinct geochemistry of tephra deposited during the event identifying the Okmok volcano in Alaska as the source.
Climate proxy records show that 43 and 42 BCE were among the coldest years of recent millennia in the Northern Hemisphere at the start of one of the coldest decades.
Earth system modeling suggests that radiative forcing from this massive, high-latitude eruption led to pronounced changes in hydroclimate, including seasonal temperatures in specific Mediterranean regions as much as 7 °C below normal during the 2 y period following the eruption and unusually wet conditions.
While it is difficult to establish direct causal linkages to thinly documented historical events, the wet and very cold conditions from this massive eruption on the opposite side of Earth probably resulted in crop failures, famine, and disease, exacerbating social unrest and contributing to political realignments throughout the Mediterranean region at this critical juncture of Western civilization.
24.09.2019 | Autor / Redakteur: Sarah Werner* / Dr. Ilka Ottleben
Im Projekt MiKlip (Mittelfristige Klimaprognosen) hat das KIT gemeinsam mit dem Deutschen Wetterdienst (DWD), dem Max-Planck-Institut für Meteorologie in Hamburg (MPI) und weiteren Universitäten ein Vorhersagesystem entwickelt, das solche Klimaprognosen mit regionaler Auflösung, also konkret für Gebiete im Bereich von 25 Kilometern Größe, berechnet. ... Die globalen Klimaprognosen, die COSMO-CLM hierbei verfeinert, beruhen auf dem globalen Klimamodell ECHAM des MPI und unterscheiden sich von langfristigen Projektionen, wie etwa dem fünften Sachstandsbericht des IPCC, dadurch, dass sie die „Gedächtnisse“ verschiedener Komponenten des Klimasystems als Startbedingung einbeziehen.
21.08.2020 | Redakteur: Dipl.-Chem. Marc Platthaus
Die aktuelle Berner Studie zeigt nun, dass schnelle CO2-Anstiege ein weit verbreitetes Merkmal unseres Klimasystems sind – und dass diese sogar während Warmzeiten stattfinden können. „Bisher hatte man angenommen, dass das Klima während natürlichen Warmzeiten sehr stabil ist und es zu keinen schnellen CO2-Änderungen in der Atmosphäre kam“, erklärt Christoph Nehrbass-Ahles, der Erstautor der Studie.
... ... Ein durch die Klimaerwärmung ausgelöster zusätzlicher Anstieg des Treibhausgases CO2, wie er in der Vergangenheit auftrat, könnte die Menschheit beim Klimaschutz noch stärker unter Zugzwang bringen. [Rückkopplungen zwischen Erwärmung und atmosphärischer CO2-Konzentration wie dieser CO2-Anstieg sind in den Klimamodellen nicht berücksichtigt, mit denen man das 1.5-Grad-Ziel in noch erlaubte THG-Emissionen umrechnet.]
Even in earlier warm periods there were pulse-like releases of CO2 to the atmosphere. ... The researchers compared the CO2 jumps of the past with the ongoing human-driven rise of CO2 concentration in the atmosphere. According to Stocker, the largest centennial CO2 jump in the past was around 15 ppm, which is approximately equivalent to the increase caused by humankind over the last six years (1 ppm = 2.124 GtC = 7.7 GtCO2).
According to Nehrbass-Ahles, the abrupt rises were always evident when melting ice masses in Greenland or Antarctica considerably disturbed the ocean circulation. If the CO2 in the atmosphere rose quickly, simultaneous changes in the Atlantic Ocean's circulation could also be detected.
Climate Action Tracker, 11 August, 2020 (in cache)
Power Industry Specific Emissions (gCO2/kWh) by country
abbreviations:
BECCS: biomass with carbon capture and storage as well as reforestation and afforestation
B2DS: Below 2 Degrees Scenario
CDR: carbon dioxide removal
EWG: Copernicus Institute of Sustainable Development, Utrecht University
IAM Integrated Assessment Model
IEA: International Energy Agency
LUT: Lappeenranta University of Technology
PA: Paris Agreement
p75: 75 percentile of 11 assessment model pathways
Gross electricity generation
Gross electricity generation or gross electricity production refers to the process of producing electrical energy. It is the total amount of electrical energy produced by transforming other forms of energy, for example nuclear or wind power. It is commonly expressed in gigawatt hours (GWh) i.e. 1 billion (10^9) watt-hours.
Total gross electricity generation covers gross electricity generation in all types of power plants. The gross electricity generation at plant level is defined as the electricity measured at the outlet of the main transformers, i.e. including the amount of electricity used in the plant auxiliaries and in the transformers.
In 2018, the gross electricity production decreased only slightly compared with 2017 by 0.5 % and reached 2941 TWh, but showed a decrease of 1.8 % compared with the 2008 peak value.
In 2018 renewable energy sources were the largest contributor to electricity production, surpassing natural gas and manufactured gases, solid fossil fuels (coal) and nuclear energy. Since 2000, the electricity generation from renewable energy sources more than doubled (from 436 to 969 TWh). Compared with 5 years ago, electricity production from renewable sources increased by 15.9 %
Bis 2030 soll der Anteil an Ökostrom in Deutschland bei 65 Prozent liegen. Dafür will Wirtschafsminister Peter Altmaier (CDU) das EEG-Gesetz reformieren. Der Vorschlag enthalte gute Elemente, sagte der Energie-Ökonom Andreas Löschel im Dfl. Doch beim Thema Stromverbrauch gebe es kritische Annahmen.
Ökostrom aus Sonne und Wind ist klimaneutral und unbegrenzt verfügbar – aber leider nicht unbedingt zu den Zeiten und an den Orten, an denen man gerade viel Strom benötigt. Ein möglicher Ausweg: Chemische Energieträger als Zwischenspeicher nutzen. Die Technik dafür ist da – nur sie rechnet sich bislang nicht.
Benoit Martin, Julien Pestiaux, Quentin Schobbens (Climact)
Julie Emmrich and Markus Hagemann (NewClimate Institute, Köln)
NewClimate Institute Publications (Dec. 2019 - Sept. 2020)
Aligning transport investments with the Paris Agreement Sep 2020 - We assess the EIB's transport-related investment portfolio 2015-2019 and propose evaluation criteria to align transport investments with the Paris Agreement. (...)
Climate neutrality claims Sep 2020 - Country and company climate neutrality targets are not all equal. This discussion paper explores factors to consider in gauging the ambition of climate neutrality targets from climate leadership to greenwashing. (...)
Fair contributions versus fastest possible reductions Aug 2020 - In this paper with Fraunhofer ISI, we argue that only the combination of assessments on "what is a fair contribution" and of "how much could emissions technically be reduced" can give sufficient guidance for national greenhouse gas emissions targets that are in line with the Paris Agreement. (...)
Options for supporting Carbon Dioxide Removal Jul 2020 - This paper examines the broad policy frameworks that can support the development and upscaling of Carbon Dioxide Removal and, in particular, whether CDR can be supported by offsetting schemes. (...)
Making long-term low GHG emissions development strategies a reality May 2020 - This guidance provides recommendations to policy makers on how to approach the development of a long-term low greenhouse gas emission development strategy (LTS) given the unique circumstances of individual countries in 2020, and future revisions thereof. (...)
Zwei neue Klimaschutzziele für Deutschland May 2020 - Diese Kurzstudie beschäftigt sich mit den aktuellen Klimaschutzzielen der deutschen Bundesregierung und deren Kompatibilität mit dem deutschen CO2 Budget. Dafür hat NewClimate Institute die Entstehungsgeschichte der deutschen Klimaschutzziele zusammengetragen und ein Budget von Treibhausgasemissionen ausgerechnet, das einem fairen Beitrag für Deutschland entspräche. (...)
The ICAT Policy Assessment Guides May 2020 - The ICAT Assessment Guides provide governments and non-state actors with the means to assess the impacts of national policies and actions that reduce their greenhouse gas emissions. Besides assessing impacts on emissions, the Guides help to assess impacts on countries’ sustainable development goals and the potential for transformational change. (...)
Good Practice Database Summary Report Apr 2020 - In continuation of the Good Practice Analysis (GPA) 1.0 and 2.0, this analysis of new case studies for the Good Practice Database (GPD) enhances and expands the existing repository of good practice examples with a focus on NDC implementation. (...)
climate mitigation efforts Mar 2020 - Synthesis report on the impacts of electricity supply sector development in Mongolia on climate change targets and health impacts associted to air pollution from coal power plants. (...)
Ambitious climate actions and targets by countries, regions, cities and businesses Feb 2020 - This is a growing list of truly ambitious climate actions and targets by countries, regions, cities, and businesses. It shows that in all areas, there are actors that aim for the ambition level needed to fully decarbonise our society. (...)
A roadmap for the power supply sector in Argentina Feb 2020 - The “Ambition to Action” (A2A) project provided support to the Argentinian NDC process between March 2017 and December 2019. This report provides a synthesis of the results of three years of supporting governmental and non-governmental constituencies with analytical support for the energy supply sector. (...)
Tracking climate-related investments and finance flows Jan 2020 - This paper discusses ways to identify investments that can be accounted as low-carbon activities and offers further recommendations regarding the solutions that help to reduce the gap between current financial structures and the objectives of the national low-emission transition. (...)
The Climate Change Performance Index 2020 Dec 2019 - Developed by NewClimate Institute, Germanwatch and CAN, the index ties in with the global Climate Change Performance Index by Germanwatch, a rating of the 58 largest emitters of GHG emissions globally that has been published annually since 2006. (...)
NDC Update Report December 2019 – Long-term, society-wide visions for immediate action Dec 2019 - The NDC Update Report tracks the progress on the implementation of Nationally Determined Contributions (NDCs) to the Paris Agreement. The theme of this report is the role of long-term low greenhouse gas emission development strategies (LTSs) in achieving the Paris Agreement goal. (...)
Potsdam Institute For Climate Impact Research, 14 October 2020
... the first half of 2020 saw an unprecedented decline in CO2 emissions – larger than during
the financial crisis of 2008,
the oil crisis of 1979, or even
World War II.
An international team of researchers has found that in the first six months of this year, 8.8 percent less carbon dioxide were emitted than in the same period in 2019 – a total decrease of 1551 million tonnes [1.5 GtCO2eq]. ...
“What makes our study unique is the analysis of meticulously collected near-real-time data,” explains lead author Zhu Liu from the Department of Earth System Science at Tsinghua University in Beijing. “By looking at the daily figures compiled by the Carbon Monitor research initiative we were able to get a much faster and more accurate overview, including timelines that show how emissions decreases have corresponded to lockdown measures in each country. In April, at the height of the first wave of Corona infections, when most major countries shut down their public life and parts of their economy, emissions even declined by 16.9%. Overall, the various outbreaks resulted in emission drops that we normally see only on a short-term basis on holidays such as Christmas or the Chinese Spring Festival.” ...
“Largely because of working from home restrictions, transport CO2 emissions decreased by 40% worldwide.
In contrast, the power and industry sectors contributed less to the decline, with -22% and -17%, respectively, as did
the aviation and shipping sectors.
Surprisingly, even the residential sector saw a small emissions drop of 3%: largely because of an abnormally warm winter in the northern hemisphere ...
To paint this comprehensive and multidimensional picture, the researchers based their estimates on the widest array of data possible: precise, hourly datasets of electricity power production in 31 countries, daily vehicle traffic in more than 400 cities worldwide, daily global passenger flights, monthly production data for industry in 62 countries as well as fuel consumption data for building emissions in more than 200 countries.
But even if they remained at their historically low levels, this would have a rather minuscule effect on the long-term CO2 concentration in the atmosphere.
Thus, the authors stress that the only valid strategy to stabilize the climate is a complete overhaul of the industry and commerce sector. “While the CO2 drop is unprecedented, decreases of human activities cannot be the answer,” says co-author Hans Joachim Schellnhuber, founding director of the Potsdam Institute for Climate Impact Research. “Instead we need structural and transformational changes in our energy production and consumption systems. Individual behavior is certainly important, but what we really need to focus on is reducing the carbon intensity of our global economy.”
Abb. 6. Abnahme der deutschen jährlichenTreibhausgas (THG)-Emissionen zwischen 1990 und 2100.
y-Achse: deutsche jährliche THG-Emissionen (GtCO2e/a)
Gezackte Linie: THG-Emissionen (GtCO2e) 1990 - 2017 nach Umweltbundesamt
durchgezogene aus Geraden zusammengesetzte Linie: THG-Reduktionspfad nach Klimaschutzgesetz (KlimaSchG). Das KlimaSchG erstreckt sich nur bis zum Jahr 2030. In dieser Abbildung 6 sind die (im Gesetz linearen) KlimaSchG-Emissionsreduktionen linear über das Jahr 2030 hinaus verlängert worden.
gestrichelte Linie: Reduktionspfad nach FridaysForFuture
gepunktete abgeknickte Linie: Reduktionspfad nach Greenpeace/Client Earth
Niveaus (horizontale Linien) über dem Jahr 2050: Klimapfade für Deutschland nach Bundesverband der Deutschen Industrie (BDI)
Zum Vergleich:
Die lila Exponentialkurven repräsentieren Reduktionen der 2017er THG-Emissionen um 3% pro Jahr, 6% pro Jahr und 9% pro Jahr.
Die Welt müsste [bei einer Reduktionsrate von 5%] in jedem einzelnen Jahr die Reduktionsleistung erbringen, die im Kioto-Protokoll über zwei Jahrzehnte vorgesehen ist."
"globale Minderungsraten von 9% pro Jahr erfordern ... eine technische und gesellschaftliche Anstrengungen, die etwa mit der Mobilisierung der Alliierten während des zweiten Weltkriegs vergleichbar sind."
Florian Humpenöder et al, Environ. Res. Lett.
15, 104093, 2020
Peatlands cover only about 3% the global land area, but store about twice as much carbon as global forest biomass. If intact peatlands are drained for agriculture or other human uses, peat oxidationcan result in considerable CO2 emissions and other greenhouse gases (GHG) for decades or even centuries.
vgl.:
Amazon rainforest: 5.5 106 km2 = 550 106 ha = 550 Mha
In 2018, about 17% of the Amazon rainforest was already destroyed.
Research suggests that upon reaching about 20–25% (hence 3–8% more), the tipping point to flip it into a non-forest ecosystems – degraded savannah – (in eastern, southern and central Amazonia) will be reached.
48, 49
Verantwortlich für diese Seite ist Marianne Grimmenstein
Corneliusstr. 11, 58511 Lüdenscheid, marianne.grimmenstein@macshot.de
... Die konkret zu beschließenden Maßnahmen sind u. a.:
der sofortige Kohleausstieg
die Beendigung von umweltschädigenden, insbesondere fossilen Subventionen
der Wechsel von industrieller zu ökologischer Landwirtschaft
der Abbau von industrieller Viehwirtschaft
die Verkehrswende
ein neues Steuersystem, das Umweltschutz belohnt, um sowohl die Erderhitzung zu bremsen als auch die Biodiversität in Deutschland zu erhalten.
Möglicherweise sogar entscheidend für den Fortbestand der globalen Biodiversität sowie der globalen Lebensgrundlagen ist der sofortige höchst effektive Schutz des Amazonas-Regenwaldes durch die ausdrückliche Erklärung Deutschlands, das EU-MERCOSUR-Abkommen nicht zu unterzeichnen, weil es seit über einem Jahr der dramatischen Zerstörung des Amazonas-Regenwaldes durch garantierte gigantische Abnahmequoten von Fleisch und Soja (gegen deutsche Agrochemie und Autos) massiven Vorschub leistet.
Die radikale Vernichtung der Biodiversität wird in zahlreichen Studien mit handfesten Beweisen belegt. Die Studien fordern diesbezüglich radikale Umwälzungen, da das Überleben der gesamten Menschheit generell bedroht ist. Wir weisen auf die folgenden Studien hin:
Es liegen zahlreiche naturwissenschaftliche Studien über den Zusammenhang zwischen der ökonomischen Landnahme und der Entstehung und Ausbreitung tödlicher Viren vor. Entsprechende Epidemien und Pandemien wie SARS-Covid 2, Ebola, etc. sind auf das Engste mit dem Biodiversitätsverlust und dem Klimawandel verknüpft. Das zeigt die folgende Dokumentation: arte.tv/de/videos/096140-000-A/umweltzerstoerung-beeinflusst-epidemien/?its_url_id=16877
Von den neun definierten planetaren Grenzen sind laut unten angegebener Studie die Grenzen bei der Biodiversität, dem Stickstoff- und Phosphor-Kreislauf (Böden) sowie bei der Abholzung der Wälder (Landnutzungsänderung) heute schon deutlich überschritten. Will Steffen u. a. “Planetary boundaries: Guiding human development on a changing planet”. In: Science 347.6223 (2015). science.sciencemag.org/content/347/6223/1259855 und de.wikipedia.org/wiki/Planetare_Grenzen
... lead author Jorgen Randers, a professor emeritus of climate strategy at the BI Norwegian Business School, told AFP ... using a stripped-down climate model, Randers and colleague Ulrich Goluke projected changes out to the year 2500 under two scenarios:
the instant cessation of emissions, and
the gradual reduction of planet warming gases to zero by 2100.
[In detail]
In an imaginary world where carbon pollution stops with a flip of the switch, the planet warms over the next 50 years to about 2.3 degrees Celsius above pre-industrial levels—roughly half-a-degree above the target set in the 2015 Paris Agreement—and cools slightly after that.
... But starting in 2150, the model has the planet beginning to gradually warm again, with average temperatures climbing another degree over the following 350 years, and sea levels going up by at least three metres.
Under the second scenario, Earth heats up to levels that would tear at the fabric of civilisation far more quickly, but ends up at roughly the same point by 2500.
'Tipping points'
The core finding —contested by leading climate scientists— is that several thresholds, or "tipping points", in Earth's climate system have already been crossed, triggering a self-perpetuating process of warming, as has happened millions of years in the past.
One of these drivers is the rapid retreat of sea ice in the Arctic.
Another source is the thawing of permafrost, which holds twice as much carbon as there is in the atmosphere.
The third is increasing amounts of water vapour, which also has a warming effect.
"The model used here is ... not shown to be a credible representation of the real climate system," said Richard Betts, head of climate impacts research at the University of Exeter. "In fact, it is directly contradicted by more established and extensively evaluated climate models."
Mark Maslin, a professor of climatology at University College London, also pointed to shortcomings in the model, known as ESCIMO, describing the study as a 'thought experiment'. "What the study does draw attention to is that reducing global carbon emissions to zero by 2050"—a goal championed by the UN and embraced by a growing number of countries—"is just the start of our actions to deal with climate change."
Germany can achieve climate neutrality by 2050 in three steps while adhering to existing investment cycles.
The first step consists of a 65% reduction in emissions by 2030. The second step is the complete transition to climate-neutral technologies, for a total emissions reduction of 95%. The third step is the offsetting of residual emissions through carbon capture and storage.
The path to climate neutrality involves a comprehensive investment program comparable in scope to the German economic miracle of the 1950s and 60s.
The core elements of the program are the creation of a renewable-based energy sector, mass electrification, a smart and efficient modernization of buildings and the development of a hydrogen economy for the industrial sector. Besides achieving climate neutrality, the program will also improve people’s quality of life by reducing noise and air pollution.
An enhanced German reduction target of 65% for 2030, in line with the requirements of the European Green Deal, will require significantly accelerating the green transition in the energy, transport and heating sectors. This includes the complete phase-out of coal by 2030, a 70% share of renewables in electricity generation, 14 million electric cars on the road, 6 million heat pumps, an increase in the green retrofit rate of at least 50% and the use of some 60 TWh of clean hydrogen.
The next legislative period will determine how Germany goes about achieving climate neutrality by 2050 and a 65% reduction in GHG emissions by 2030. Government action after the 2021 federal election will be pivotal for future climate policy. Intelligent policy instruments will be needed to modernize Germany’s economy and make it sustainable and resilient. They will also be needed to ensure that the structural changes are as fair and inclusive as possible.
The EU will only be able to meet an increased interim target (-55% REL. 1990) for 2030 and thus its obligations under the Paris Convention if all its Member States make a fair contribution. What “fair” in this context means will ultimately be decided by the EU institutions. We assume Germany’s contribution to be 65% GHG reductions by 2030.
avoid stranded assets in fossil technologies,
massively improve the efficiency of energy use (Efficiency First),
expand renewable power generation to an extent that enables the necessary electrification of other sectors (Electrify Second)
use electricity from renewable sources to produce hydrogen that replaces fossil fuels in industry, but also in other sectors (Green Fuels Third).
Um global Netto-Null-Emissionen bis 2050 zu erreichen und (global) 2030 etwa 7.900 TWh Strom aus Windkraft zu erzeugen, muss der globale durchschnittliche jährliche Kapazitätszubau auf fast 250 GW erhöht werden, was mehr als das Doppelte des (globalen) Rekordwachstums von 2020 ist.
Die energiebedingten Treibhausgas-Emissionen bestehen zu 98 % aus Kohlendioxid (CO2),
Methan (CH4) und Lachgas (N2O) machen den Rest aus.
Methan wird zum Großteil aus sogenannten diffusen Quellen freigesetzt, vor allem bei der Kohleförderung als Grubengas.
Energiebedingte Lachgas-Emissionen entstehen durch Verbrennungsprozesse.
Als energiebedingte Emissionen bezeichnet man die Freisetzung von Treibhausgasen und Luftschadstoffen, die durch die Umwandlung von Energieträgern etwa in Strom und Wärme entstehen.
Sie machen etwa 85 % der deutschen Treibhausgas-Emissionen aus. Der Trend ist seit 1990 leicht rückläufig.
1 in Kohlendioxid-Äquivalenten, berücksichtigt sind Kohlendioxid (CO2), Methan (CH4) und Lachgas (N4O)
2 einschließlich Militär und Landwirtschaft (energiebedingt)
3 enthält nur Emissionen aus Industriefeuerungen, keine Prozessemissionen
4 durch Gewinnung, Umwandlung und Verteilung von Brennstoffen.
Hauptverursacher ist mit 37 % der energiebedingten Treibhausgas-Emissionen die Energiewirtschaft, also
die öffentliche Strom- und Wärmeerzeugung,
Raffinerien sowie
Erzeuger von Festbrennstoffen.
Danach folgen die Sektoren Verkehr mit Anteilen in der Größenordnung von 25 %,
Industrie 18 %,
private Haushalte 13 % und
der Gewerbe-, Handels- und Dienstleistungssektor mit 6 %.
FZJ – Forschungszentrum Jülich (2019). Wege für die Energiewende. Kosteneffiziente und klimagerechte Transformationsstrategien für das deutsche Energie- system bis zum Jahr 2050. [Kurzfassung]
(PBS Eons, 2017)
56 Ma, peak appr. 200 000 a wide, 4 to 8 °C higher temp., release of 4000 to 7000 GtC (about the size of our entire fossile fuel reservoir) in a few millennia (at least 7000 a)
unter Beteiligung von Energiewirtschaftliches Institut an der Universität zu Köln (EWI),
Forschungsinstitut für Wärmeschutz (FIW) München, Institut für technische Gebäudeusrüstung (ITG) Dresden, Jacobs University Bremen, Stiftung Umweltenergierecht, Wuppertal Institut für Klima, Umwelt, Energie
GREEN PUBLIC WORKS — A HISTORIC INVESTMENT PROGRAMME TO DRIVE THE TRANSITION TO SUSTAINABILITY
1 Establish the Green Public Works (GPW), a public investment agency that will channel Europe’s resources into green transition projects around the continent.
2 For all EU institutions, switch to a Genuine Progress Indicator system of accounting rather than Gross Domestic Product (GDP).
3 Introduce a new Regulation to clarify that the European Central Bank must prioritise employment, social progress and environmental protection.
4 Abandon the dominant model of public-private financing and invest in the transition directly.
5 Adopt a multi-stakeholder governance model for the European Investment Bank (EIB), ensuring that decisions are made with input from scientists, activists, country representatives and other key groups.
6 Fund the green transition by mobilising a coalition of Europe’s public banks — led by the European Investment Bank — to issue green bonds to raise at least five percent of Europe’s GDP in funding that can be channelled into the GPW.
7 Establish multilateral working groups on the green transition at the European System of Central Banks.
8 Intervene in the design of global prudential standards to introduce punitive capital requirements for investments in fossil fuel-heavy and environmentally destructive projects and businesses in the Basel framework.
9 Spend GPW funding on guaranteeing decent public jobs to all European residents who seek one. These jobs will be based on a three-day weekend or four-day working week with lower overall working hours. They will provide workers and communities of democratic control over their workplaces. And they will be local — ensuring that all European residents can earn fair wages in their local communities.
10 Use the GPW to fund an income guarantee for workers in fossil-fuel industries.
11 Fund a Care Income to compensate activities like care for people, the urban environment, and the natural world.
12 Devolve investment decisions made under the GPW to national, regional, and municipal government levels.
13 Allocate distinct lines of funding within the GPW for experimentation in increasing public participation in investment decision making — with a view to entrenching greater participation in local governance.
14 Simplify funding application and reporting processes, and include a free-to-use support service, ensuring greater participation and access of grassroots civil society organisations in investment decision making.
15 Provide incentives for authorities to set up local GPW agencies, to help steer investment decisions and provide technical support.
16 Tie all GPW funding to strict public-procurement criteria that shift public spending towards green materials, fossil-free energy, and community wealth building. Issue funding to authorities that subscribe to a shared set of fundamental principles, including democracy, transparency, and sustainability.
17 Fund a Green Solidarity Network to unite twinning and cooperation arrangements between municipalities, regions, farmers, and communities — enhancing horizontal information-sharing and political decision-making across the continent.
18 Develop a GPW Tracking Tool to allow for public scrutiny and monitoring of GPW-funded projects.
19 Introduce a new EU Public Integrity Authority with the power to investigate and refer violators of European common standards and national regulations to national enforcement agencies.
20 Invest in the European Anti-Fraud Office to reinforce capacity to investigate abuse of public money across the EU.
21 Fund a major buy-back programme for vacant housing stock, repurposing it for public use wherever practicable.
22 Refurbish and retrofit existing housing stock for sustainability through large scale participatory and integrated, neighbourhood-level initiatives to ensure every home is well insulated and in good repair.
23 Accommodate needs created by the changing climate in all new housing, which will be safe and non-toxic, and designed with the participation of the communities that will ultimately use it.
24 Ensure that construction processes are accountable to workers and communities. New buildings will be suitable given the location and nature of existing structures, avoid creating damp or other hazards through unsuitable retrofits, and minimise emissions of greenhouse gases and other environmental breakdown.
25 Establish a Mobility Cohesion Fund to invest in the integration and improvement of Europe’s public transport systems, ensuring cohesion in mobility within and between Europe’s rural communities, towns, cities, regions and countries.
26 As part of the Mobility Cohesion Fund, make all municipal public transport around the continent free at the point of use or available at a low cost that incentivises its use.
27 To ensure maximum mobility for all Europeans — including persons with disabilities — fund a fleet of public taxis and car-pooling services.
28 Invest in an integrated, efficient high-speed rail system using sustainably produced energy, combined with a kerosene tax on intra-EU flights, to eventually replace air travel within the continent.
29 Support the public buy-out of utilities companies across EU member states.
30 Fund projects and organisations engaged in cooperative approaches to socio-digital innovation, such as community-owned internet service providers.
31 Create a democratically-controlled European Data Commons to unlock the power of aggregated data for the common good, while safeguarding privacy, individual sovereignty, security and anonymity.
32 Introduce a European Health and Care Standard, a minimum standard for public healthcare across the continent. Make GPW funding available to parts of Europe that fall below it.
33 Fund a Europe-wide Training Guarantee, supporting opportunities for jobs training across the continent.
34 Invest in shared public services across the continent — from public parks to childcare centres.
35 Support the emergence of workplace democracy across the continent, focusing investment on worker cooperatives and community-led projects based on municipal or local ownership.
36 Invest in establishing the Green Horizon 2050 research and development programme.
37 Ensure that any technologies or techniques developed under the Green Horizon 2050 programme are open source and devised in collaboration with other countries to support the emergence of sustainable economies across the globe.
38 Make GPW transition funding available to firms that meet a high standard of both sustainability and worker empowerment.
39 Establish the Europe Award, a prize for firms that meet the principles of the Green New Deal for Europe and make great strides towards sustainability and workplace democracy.
40 Channel investments towards reinvigorating Europe’s rural communities, supporting environmentally-sustainable food production across the continent.
ENVIRONMENTAL UNION — AN EMERGENCY PACKAGE OF LEGISLATION, REWIRING EUROPE FOR SUSTAINABILITY AND SOLIDARITY
41 Declare a climate and environmental emergency in the EU and commit to continuously updating targets to align with the scientific consensus.
42 Introduce legislation mandating that Europe’s economies operate within the planetary boundaries.
43 Base legislation on detailed data collection on the health of natural systems and new targets for biodiversity across the EU — which must be gathered with a view to informing the legislative process.
44 Replace the EU emissions trading scheme with a fee-and-dividend system, after piloting the new model on a small scale and with the participation of Europe’s residents.
45 Introduce legislation to shut down tax havens, which deprive the European public of vital funds that must be mobilised in support of the transition.
46 Introduce additional fiscal measures, such as an environmental damages tax and a financial transaction tax, to generate funds to support communities on the frontline of the climate and environmental crises.
47 Introduce a new ‘Euro 7’ vehicle emissions standard to prohibit the production of fossil fuel vehicles. This will prohibit dividends for shareholders, or pay for directors of corporations who fail to comply after a transitional period.
48 Pass a new Public Enterprise Directive to codify the right of EU member states and regional states to create golden shares in manufacturing companies to decarbonise production.
49 Amend the Railways Directive to electrify all rail in Europe.
50 Legislate to collect data and phase out all aeroplane flights with comparable times to rail alternatives.
51 Renegotiate the International Convention for the Prevention of Pollution from Ships to require decarbonisation of fleets to limits of available technology.
52 Negotiate a new International Convention for the Elimination of War Industry to free countries around the world to invest in the fight against climate damage.
53 Encourage taking energy utilities back into public ownership using the Open Method of Coordination and require public voting rights in public utilities.
54 Amend the Electricity Directive, Renewable Energy Directive, and Gas Directive to require 100 percent clean and sustainable energy generation.
55 Introduce robust fossil fuel subsidy reporting standards under the NECP.
56 Link GPW funding to fossil fuel subsidy withdrawal during a transitional period — ensuring that no taxpayer shoulders the burdens of the transition, particularly in fossil-fuel dependent countries.
57 Entrench durability and sustainability at the heart of European manufacturing. As part of that, enhance consumer rights to products of lasting and durable quality, while enshrining in law a right to repair and recyclability.
58 Introduce a new Supermarkets and Stores Directive to require traffic light labelling for carbon and nutrition, no unnecessary plastic, decarbonising transport, a living wage for agricultural workers, and effective enforcement.
59 Introduce new legislation governing both domestic and international supply chains, ensuring that they achieve a reduction in material throughput in Europe and are grounded in principles of justice.
60 Require companies to account for climate risks, and reserve capital fossil fuel assets, on the assumption of paying full compensation for damage caused.
61 Fast-track progress of the Technical Working Group on sustainable finance, and incorporate the taxonomy of social and green investments into a new, punitive prudential framework.
62 Building on the new taxonomy, make emergency amendments to Europe’s prudential rules to penalise investments in non-renewables. In addition to introducing a new ‘brown penalising factor’ for banks and insurers, extend the same principle to securities financing transactions, introducing ‘brown penalising’ margins and haircuts.
63 To safeguard depositors, legislate for the separation of commercial and investment banking, as well as robust and mandatory new disclosure requirements on non-renewable investments.
64 Democratise finance through an Economic Democracy Directive that empowers people to exercise control through elected representatives over all voting rights attached to investments on their money.
65 Expand the mandate of Europe’s financial regulators to monitor progress against climate, environmental and social indicators — and to support the smooth implementation of the new requirements.
66 Entrench sustainability within all firms, amending the Company Law Directive to codify a duty on directors to invest in renewable and sustainable energy, transport, buildings and other practices, with multiplying damages for delay, enforceable by investors, employees, creditors and representative environmental groups.
67 Empower businesses and others to make transparent agreements to eliminate greenhouse gas emissions, waste, and pollution exempt from competition rules.
68 Make agricultural subsidies conditional upon increasing ‘ecological focus areas’ with forests, meadows and rewilding, from five percent to 20-50 percent of farmed land.
69 Make agricultural payments conditional upon sustainable land practices, including eliminating all unnecessary tilling, fertilisation, pesticides, and machinery, to prioritise retention and reduction of carbon.
70 During a transitional period, withdraw subsidies for big farming corporations and businesses entirely upon the completion of restoration in the natural environment — redirecting the funds towards sustainable food production.
71 Adopt the Common Food Policy, a framework that realigns the various sectoral policies affecting food systems, puts an end to conflicting policy objectives and their hidden costs and puts trade in the service of sustainable development.
72 Terminate all Investor State Dispute Settlement agreements, and introduce the right of communities and democratic representative groups to bring claims to enforce trade rules.
73 Renegotiate the World Trade Organisation rules to include human rights, including the right to the benefits of science, a clean environment and labour standards.
74 Recalibrate EU trade rules to support diversified, self-sustainable economies in Europe and around the world, according to the principle of decarbonisation.
75 Revise Europe’s international development policies to align with the priorities of the Common Food Policy.
76 Recognising that environmental destruction is a threat to human and non-human life, introduce an Environmental Abuse Directive to codify the civil wrong for contributing towards climate and environmental damage, with personal and punitive liability for those who profit from pollution.
77 Recognise that climate damage is criminal damage, and that ecocide is also a crime.
78 Reorient international criminal law to recognise climate damage that amounts to ecocide is a ‘crime against humanity’.
ENVIRONMENTAL JUSTICE COMMISSION — RESEARCH, MONITORING, AND RECOMMENDATION
79 Establish an Environmental Justice Commission to monitor implementation of the programme along the dimensions of international, intersectional and intergenerational justice.
80 Ensure that the EJC is guided by principles of equal distribution, recognition, and participation of communities across Europe.
81 Structure the EJC across four tiers, from Chairpersons elected to represent EU member-states down to People’s Panels that inform the EJC’s work.
82 Empower the EJC to investigate issues pertaining to environmental justice and propose recommendations to legislative bodies both inside Europe and around the world to address them.
83 The EJC should investigate the international dimension of environmental justice, ranging from trade relations to the rules of the game for transnational corporations.
84 The EJC should address intersectional inequalities inflicted by the environmental crisis and its variable impact on communities in Europe.
85 The EJC should pay particular attention to the challenge of intergenerational justice — both looking addressing past injustices and promoting tools to ensure that future generations inherit a habitable world.
For us to be able to detect the drop in emissions caused by the pandemic it needs to be large enough to stand out from natural CO2 variability caused by how plants and soils respond to seasonal and annual variations of temperature, humidity, soil moisture, etc. CO2 increases everywhere in the atmosphere but super-imposed on that are seasonal cycles. After removal of the long-term increasing trend at each site one is left with a seasonal cycle caused primarily by seasonal photosynthesis and respiration of ecosystems on land.
The three figures below show the 10-year average seasonal cycle, and the year-to-year variations. These natural variations are large, and so far the "missing" emissions from fossil fuel burning have not stood out. Here is an example: If emissions are lower by as much as 25%, then we would expect the monthly mean CO2 for March at Mauna Loa to be lowered by about 0.2 ppm, and again in April by another 0.2 ppm, etc. Thus, when we compare the average seasonal cycle of many years we would expect a difference to accumulate during 2020 after a number of months. The International Energy Agency expects global CO2 emissions to drop by 8% this year. Clearly, we cannot see a global effect like that in less than a year. In addition, the fires are producing CO2 at perhaps a similar rate as the modest lowering of emissions resulting from the pandemic. It does look like CO2 continues to increase at the same rate as in previous years, which illustrates that we need to make aggressive investments in renewable energy sources to tackle our global heating emergency.
Fig. 1, upper panel: At the Mauna Loa Observatory, after removal of the long-term increase of CO2, the purely seasonal component is left. It is almost entirely caused by terrestrial plants and soils. The blue line is the average seasonal cycle during 2010-2020. The gray band shows the variability of the seasonal cycle (one standard deviation) in different years. The red line is the seasonal cycle during 2020 so far. The lower panel only shows deviations from the blue line above for both the gray uncertainty band and the red line.
Fig. 2: Same for Pt. Barrow, on the North Slope of Alaska. Note the scale change on the y-axis.
Fig. 3: Right figure: Same for South Pole. Again, the y-axis has a different scale.
Advanced Nuclear Power Plants, Small Modular Reactors
Enviro Close-Up #674 Gordon Edwards, president, Canadian Coalition for Nuclear Responsibility, YouTube Link,
Feb 13, 2023
Gordon Edwards refutes the claims of the nuclear industry as it pushes purportedly “new and improved” nuclear power plants, so-called “advanced” nuclear power plants, and particularly small modular reactors.
These smaller nuclear power plants are not new and not improved, but were “things that were tried 50 and 60 years ago” and didn’t succeed then.
Now with governments prepared to spend “bundles of money…trillions of dollars” to combat climate change, the nuclear industry is wheeling out these old designs to “try to rescue itself from a very rapid decline.”
These smaller nuclear power plants are not safer than large nuclear power plants. They “are just as prone to failure as large reactors.”
Any nuclear power plant is “a warehouse of radioactive poisons, and anything that blows these poisons out into the environment constitutes a disastrous accident.
That can happen “if you’re small, that can happen when you’re big.”
Furthermore, the small plants produce more nuclear poisons, more nuclear waste, than large nuclear reactors.
Meanwhile, safe, clean, green renewable energy is here with its costs having plummeted. “Renewables are now about 4 times cheaper than nuclear” with solar and wind systems far quicker to build, thus having a “rapid payback” to challenge climate change and swiftly.
International Energy Agency: 91% of new energy growth is expected to be renewables
nuclear power plant construction time: 10 years
high nuclear plant decommissioning costs
high nuclear plant radwaste disposal costs
statistics show that nuclear power does not provide a suitable electrical base load for fluctuating renewables
because nuclear and renewables are competitors for money, countries that have heavily invested in nuclear power have done poorly in
emissions reductions and
installing renewables.
Renewables
low costs, short construction time
short construction time
renewables pay themselves off in shorter time than nuclear power
capital investment brings profits within 2 years -> can be readily re-invested in new plants
small modular reactors generate more radwaste than large reactors, because more construction material (steel, concrete) is close to the nuclear reaction and gets activated by stray neutrons. Activation products are tritium H-3(essential part of biosphere), C-14 (half-life = 5700 years), Cl-36 (half-life: 3 10ˆ8 years
time: 11:39
Nuclear power plants generate a blip of electricity (for 20 to 40 years) and produce radioactive waste that lasts hundreds of thousands of years
Themen
Die Stiftung KlimaWirtschaft bearbeitet die zentralen Handlungsfelder für die Transformation zur Klimaneutralität. Dafür führt sie eigene Projekte, Studien und Veranstaltungen durch und arbeitet eng mit relevanten politischen, gesellschaftlichen und wissenschaftlichen Akteuren, wirtschaftlichen Verbänden und klimapolitischen NGOs zusammen. In branchenübergreifend angelegten Transformationsallianzen erarbeiten Unternehmen aktiv praxisorientierte Lösungen.
Klimaschutz in Unternehmen
Die Transformation zu einer klimaneutralen Wirtschaft ist eine große Herausforderung. Mit unserer Transformationsallianz "Unternehmerische Klimaneutralität" bieten wir eine Plattform, um sektorübergreifend konkrete Lösungen zu entwickeln.
Klimapolitik
Die Stiftung KlimaWirtschaft setzt sich für einen politischen Rahmen ein, der sowohl Klimaschutz wie auch nachhaltigen wirtschaftlichen Erfolg ermöglicht. Denn wir sind überzeugt: Das Klima schützen wir am besten, indem wir Klimaschutz zu einem international erfolgreichen Geschäftsmodell machen.
EU Green Deal
Der Green Deal ist das größte und ehrgeizigste Projekt für nachhaltiges Wachstum und zukünftige Wettbewerbsfähigkeit seit der Gründung der Europäischen Union. Gemeinsam mit unseren Förderunternehmen begleiten wir die weitere Ausgestaltung und Umsetzung des Fit-for-55-Pakets konstruktiv.
Industrietransformation
Die Industrie ist Motor der deutschen Wirtschaft und zugleich Verursacher von etwa 20% unserer Treibhausgasemissionen. Klimaneutralität lässt sich nur gemeinsam mit einer Industrie erreichen, die international wettbewerbsfähig ist.
Sustainable Finance
Für klimafreundliche Technologien und den Ausbau von Infrastrukturen braucht es erhebliche, zukunftsgerichtete Investitionen von sowohl privaten als auch öffentlichen Kapitalgebern. Die Stiftung KlimaWirtschaft zeigt, dass Investitionen in Klimaschutz ein zukunftsfähiges Geschäftsmodell sind.
Verkehr und Mobilität
Mobilität ist das Rückgrat unserer gesellschaftlichen und wirtschaftlichen Entwicklung. Gleichzeitig ist in Deutschland der Verkehrs- und Mobilitätssektor der drittgrößte Verursacher von Treibhausgasemissionen. Es braucht deshalb schnell eine erfolgreiche Verkehrswende und neue Mobilitätskonzepte.
Jesse F. Abrams et al., Earth's Future, 11, 11, Nov. 2023
Abstract
Many scenarios for limiting global warming to 1.5°C assume planetary-scale carbon dioxide removal sufficient to exceed anthropogenic emissions, resulting in radiative forcing falling and temperatures stabilizing. However, such removal technology may prove unfeasible for technical, environmental, political, or economic reasons, resulting in continuing greenhouse gas emissions from hard-to-mitigate sectors. This may lead to constant concentration scenarios, where net anthropogenic emissions remain non-zero but small, and are roughly balanced by natural carbon sinks. Such a situation would keep atmospheric radiative forcing roughly constant. Fixed radiative forcing creates an equilibrium “committed” warming, captured in the concept of “equilibrium climate sensitivity.” This scenario is rarely analyzed as a potential extension to transient climate scenarios. Here, we aim to understand the planetary response to such fixed concentration commitments, with an emphasis on assessing the resulting likelihood of exceeding temperature thresholds that trigger climate tipping points. We explore transients followed by respective equilibrium committed warming initiated under low to high emission scenarios. We find that the likelihood of crossing the 1.5°C threshold and the 2.0°C threshold is 83% and 55%, respectively, if today's radiative forcing is maintained until achieving equilibrium global warming. Under the scenario that best matches current national commitments (RCP4.5), we estimate that in the transient stage, two tipping points will be crossed. If radiative forcing is then held fixed after the year 2100, a further six tipping point thresholds are crossed. Achieving a trajectory similar to RCP2.6 requires reaching net-zero emissions rapidly, which would greatly reduce the likelihood of tipping events.
Key Points
We conduct a thought experiment on equilibrium global warming and tipping point likelihood under constant greenhouse gas concentration scenarios
Maintaining radiative forcing at or above current levels would commit multiple parts of the climate system to passing tipping points
Only a lower emissions scenario, which would require rapidly reaching net-zero emissions, avoids crossing most climate tipping points
... If the large-scale carbon dioxide removal needed to reach net-zero emissions is unfeasible and instead, the remaining hard-to-mitigate emissions approximately balance natural sinks, atmospheric greenhouse gas (GHG) concentrations will remain constant. Such fixed GHG levels will result in continued warming until the climate system reaches a state of radiative balance, which we call “committed warming.” We investigate the committed warming associated with the CO equivalent (CO e) for each year for three emission scenarios. Critically, we then examine the probability of breaching tipping point thresholds at different levels of committed warming, finding that under the scenario that best matches current national commitments, we will be committed to crossing the critical temperature threshold for six key climate tipping points by 2100. Maintaining radiative forcing at only slightly elevated levels above present GHG concentrations will substantially alter parts of the Earth System through such “locked-in” impacts. Society will only be able to avoid breaching tipping point thresholds through rapid and very substantial reduction of human emissions.
Fig. 3
(a) Pre-commitment transient and (b) committed equilibrium warming temperatures for RCP8.5 (green curves), RCP4.5 (blue), and RCP2.6 (purple). The shaded area represents the uncertainty (standard deviation) of the model ensemble, while the dashed lines represent minimum and maximum modeled values. The black line is an overlay of historic temperature observations. Tipping point threshold best estimates from Armstrong McKay et al. (2022) are shown as the horizontal colored lines with the threshold range shown in panel (c) Tipping point abbreviations as follows: GRIS—Greenland Ice Sheet collapse, LABC—Labrador/SPG Convection collapse, AMAZ—Amazon Rainforest dieback, AMOC—Atlantic Meridional Overturning Circulation collapse, AWSI—Arctic Winter Sea Ice collapse, EAIS East Antarctic Ice Sheet collapse, PFTP—Boreal Permafrost collapse, WAIS—West Antarctic Ice Sheet collapse, EASB–East Antarctic Subglacial Basins collapse.
Meine Emails, Kommentare und Briefe an Fachleute, Politiker, Zeitungen und TV-Sender
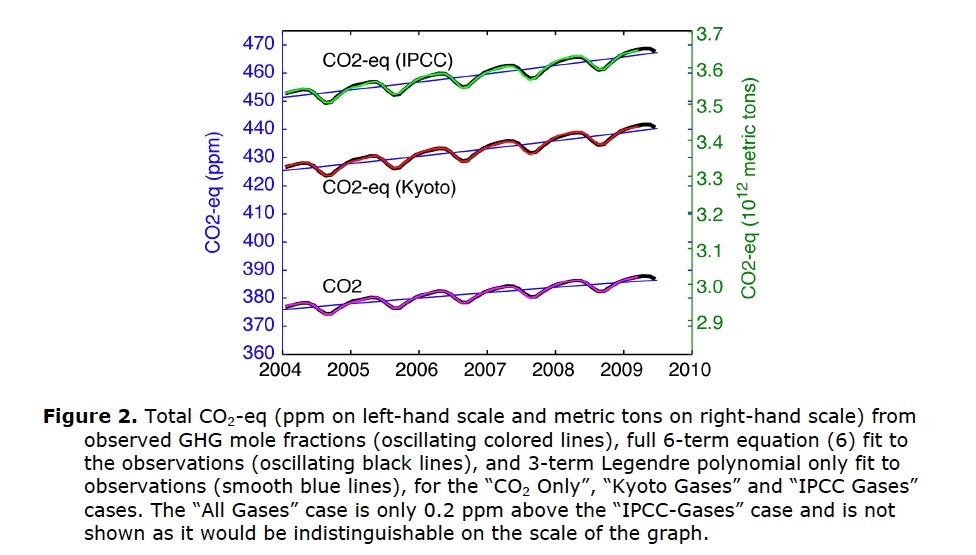
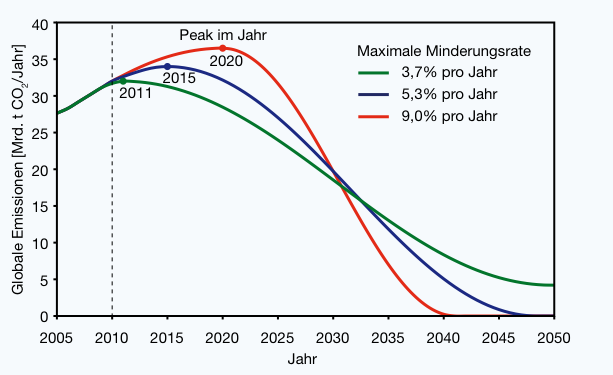
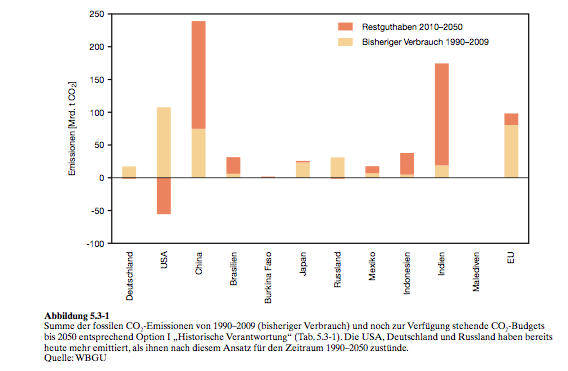
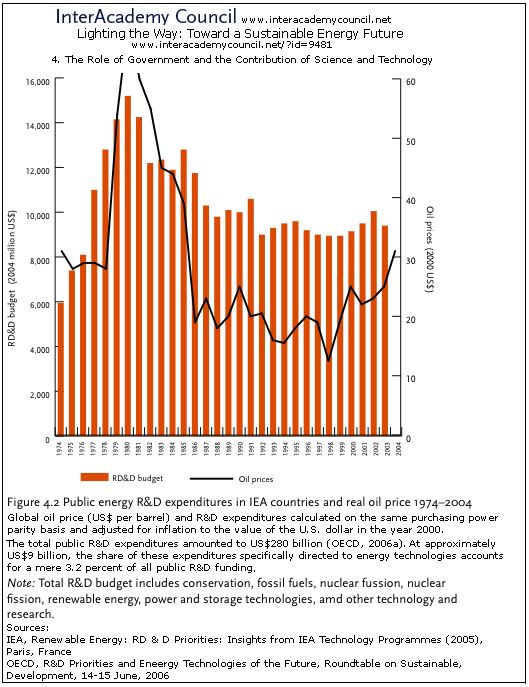
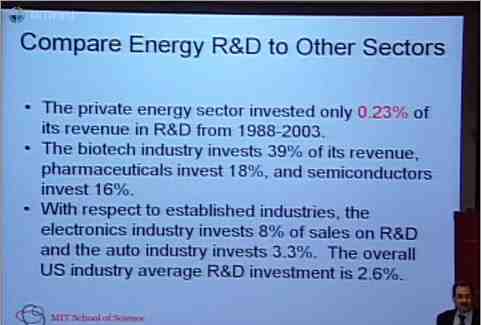 From Marc A. Kastner:
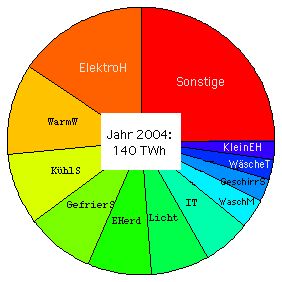

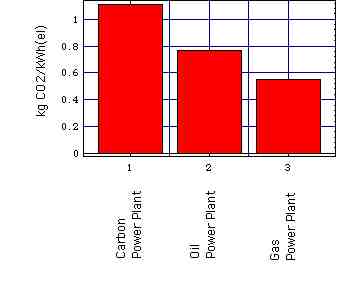
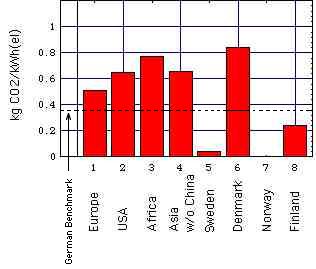

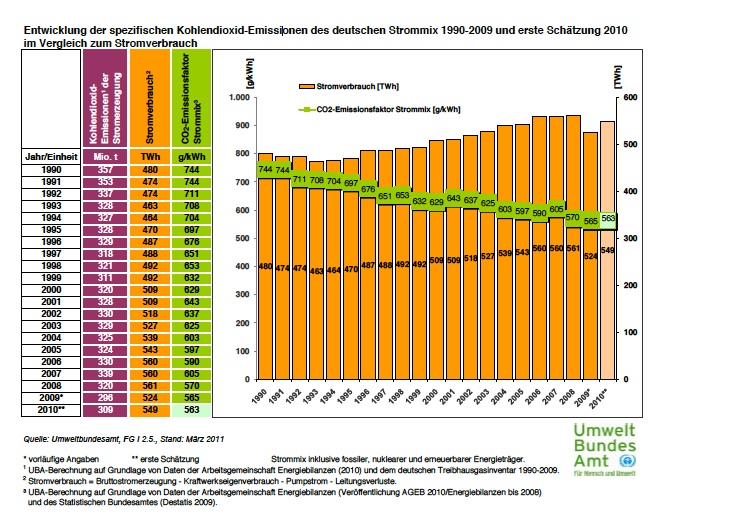
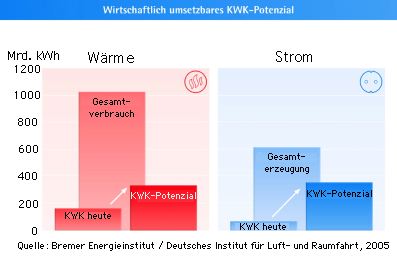
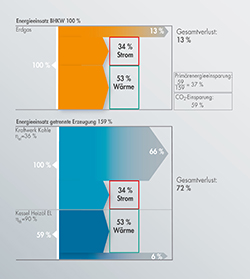
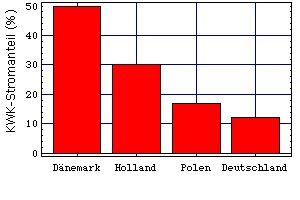
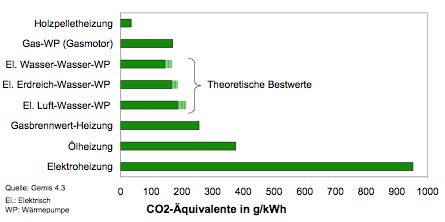
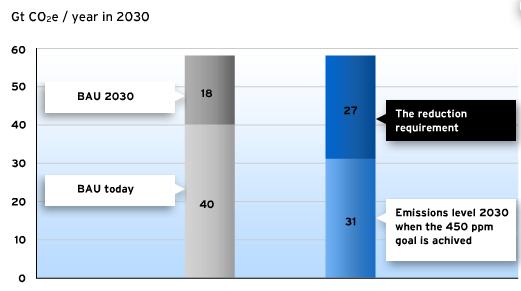
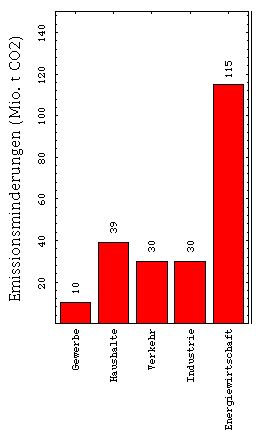
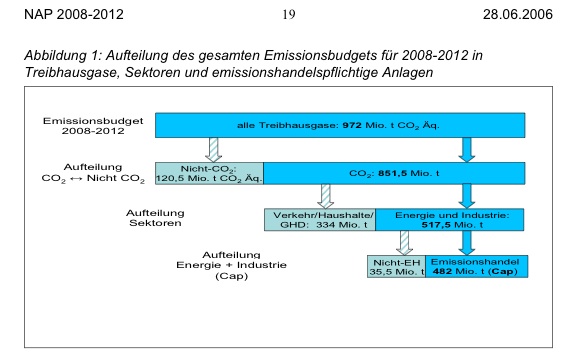
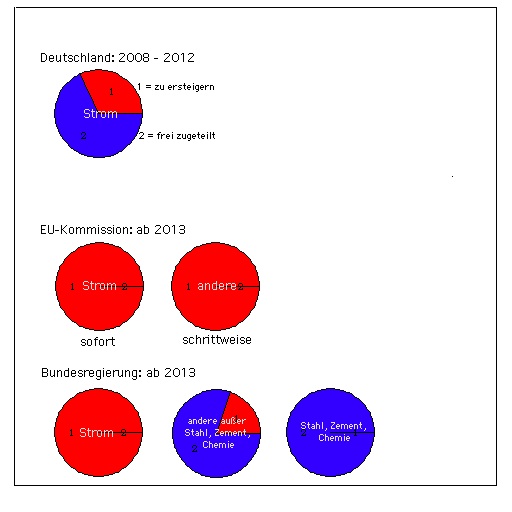
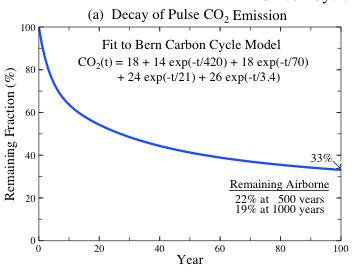
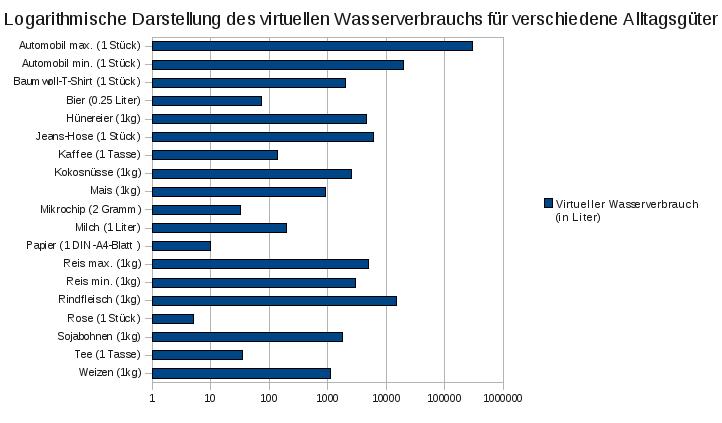
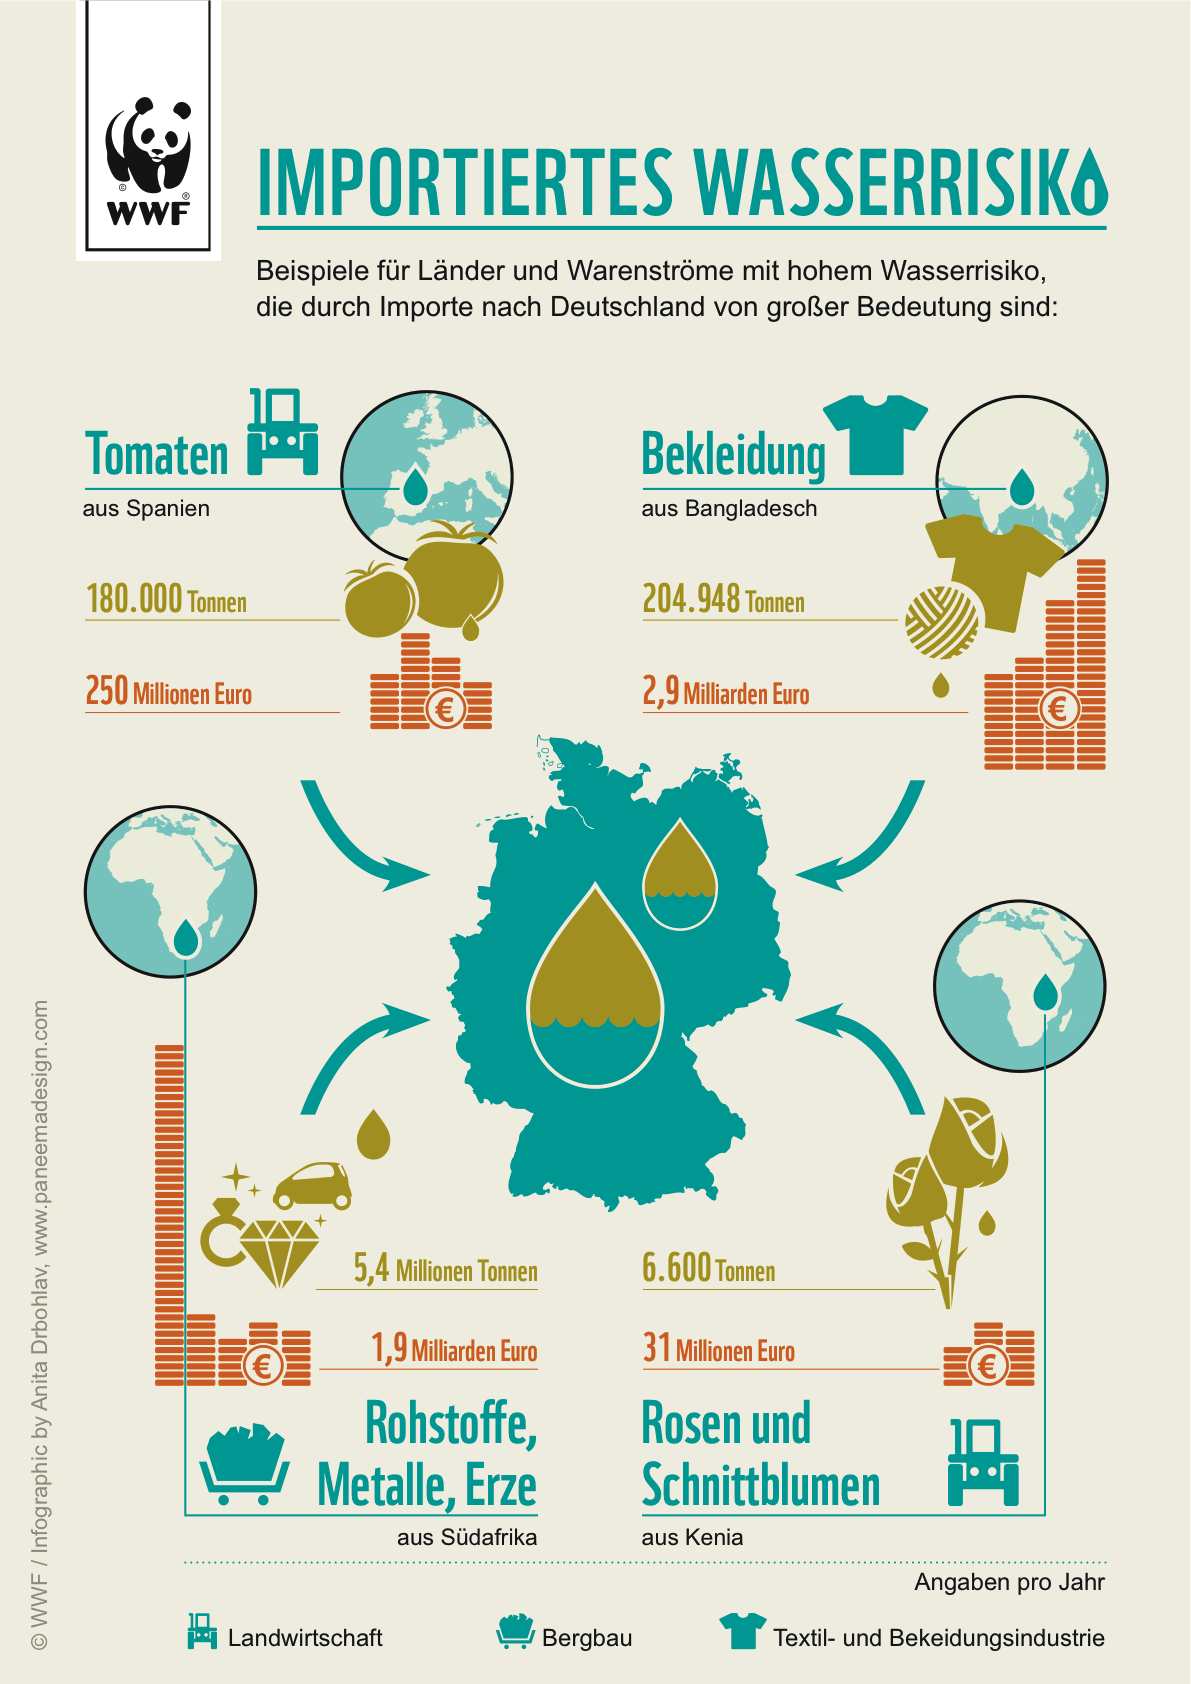
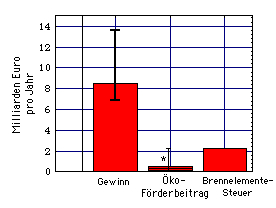
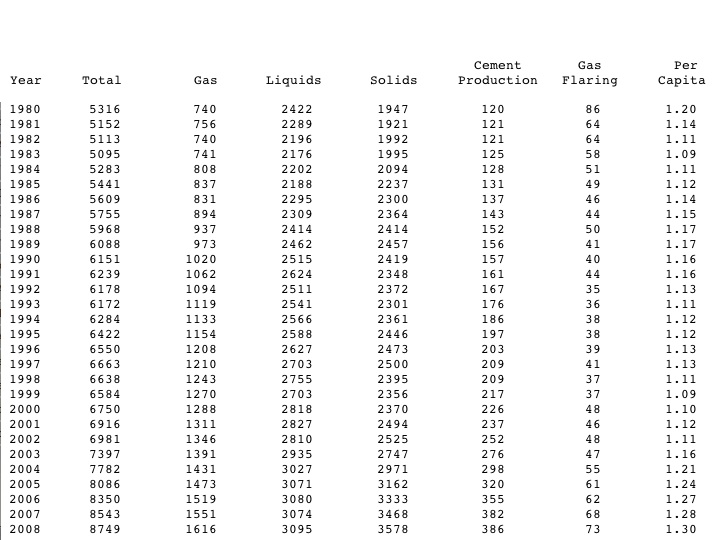
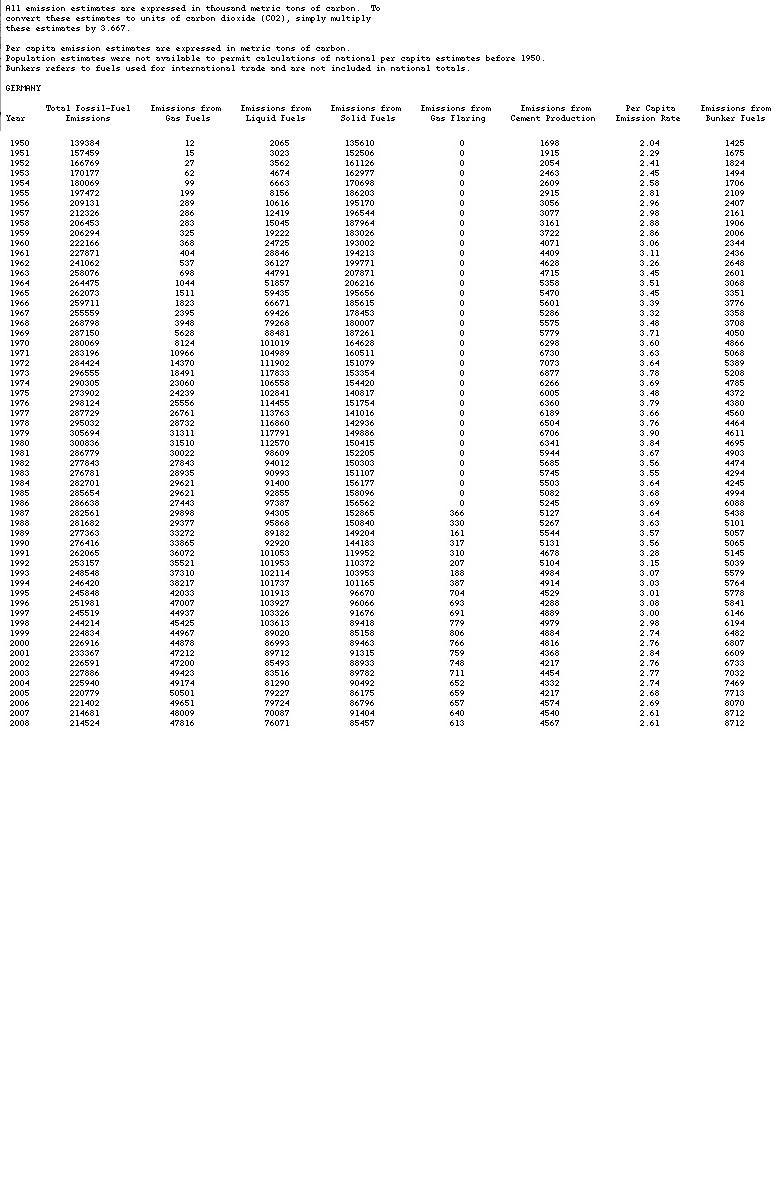
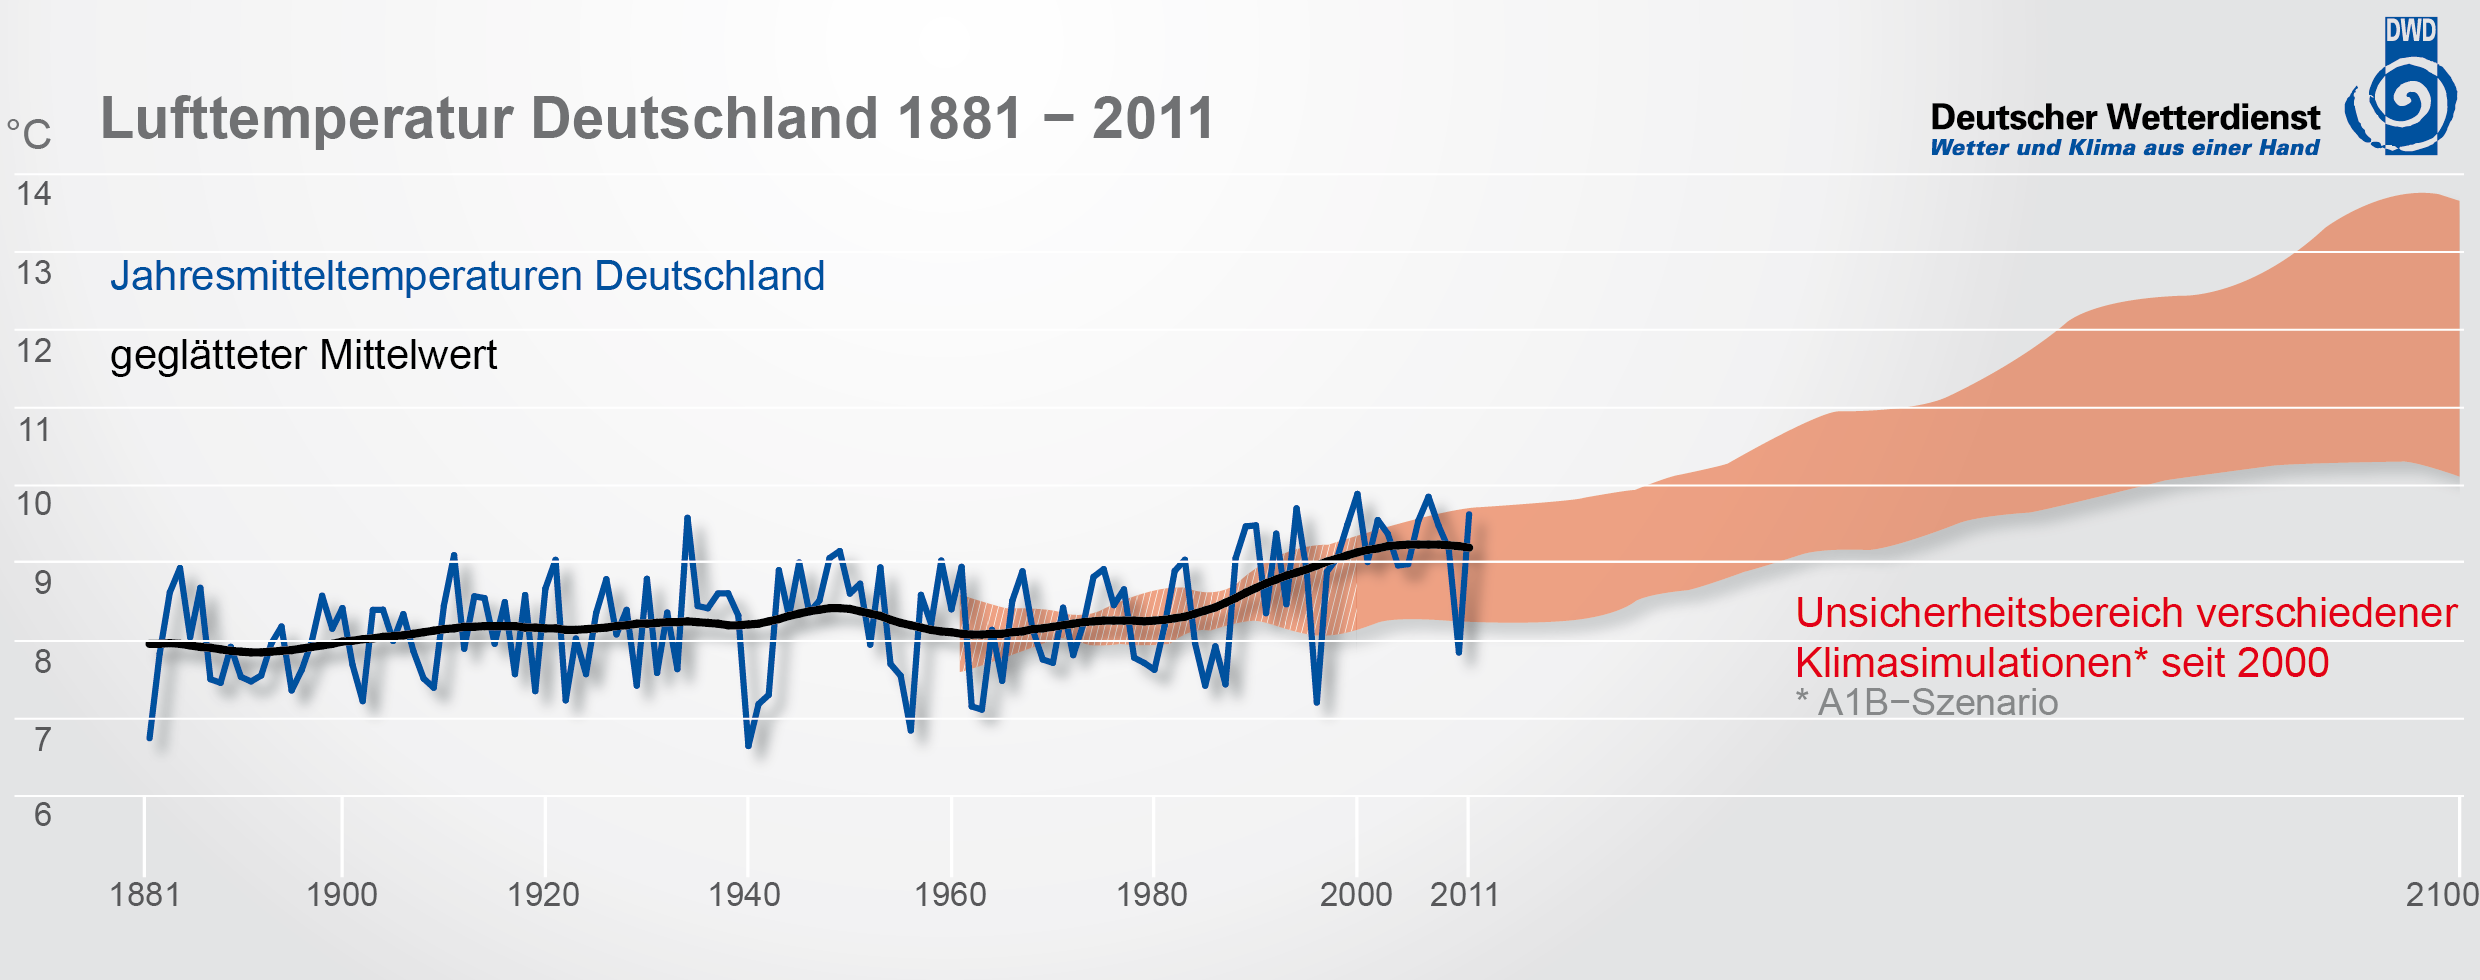
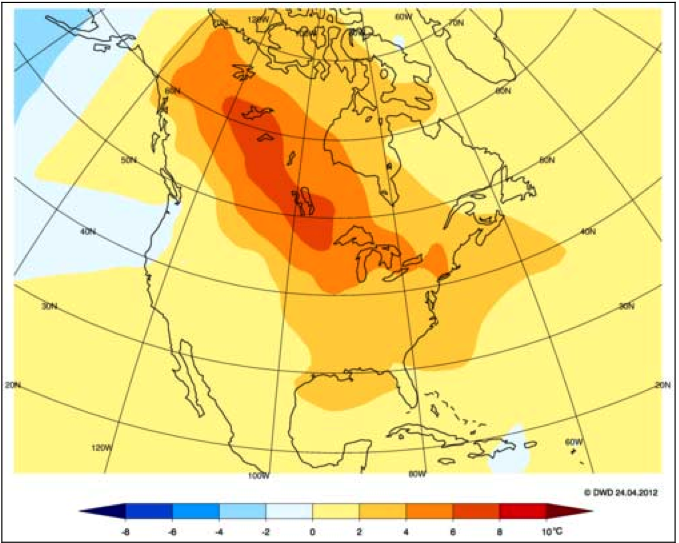

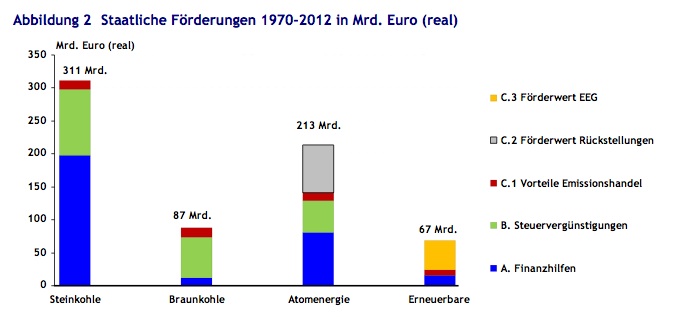
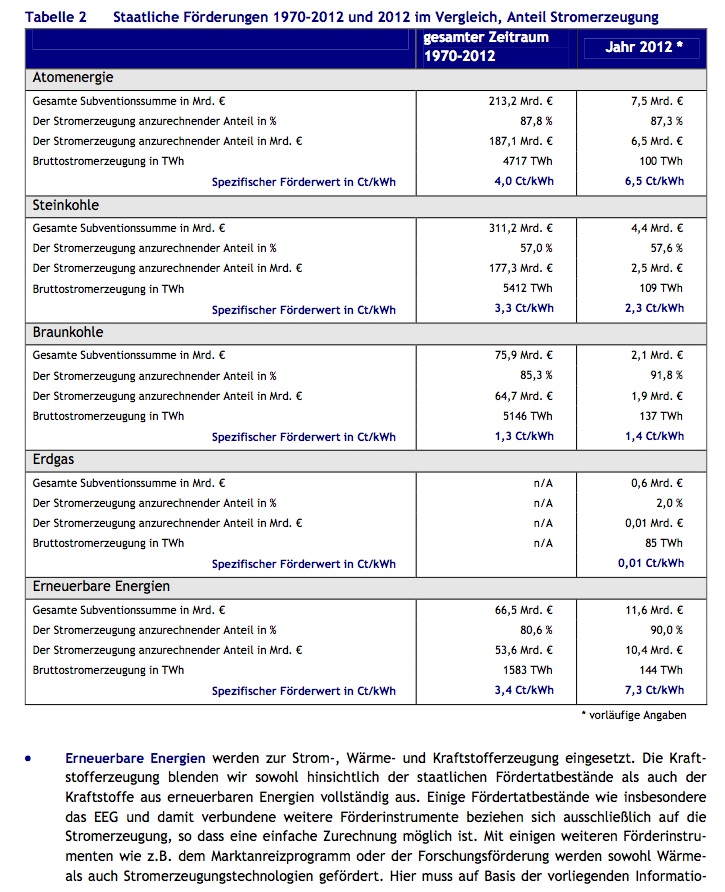
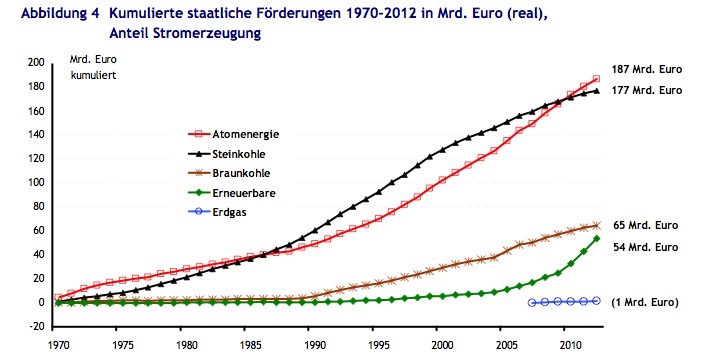
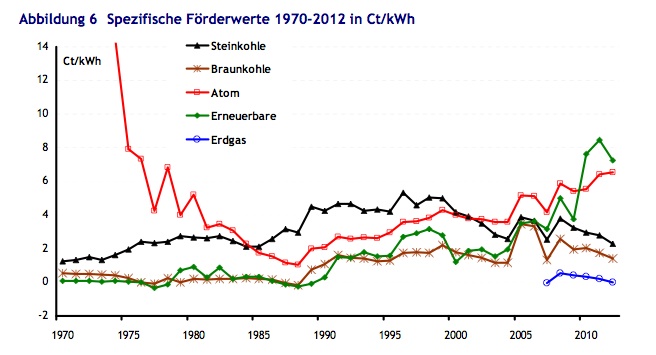
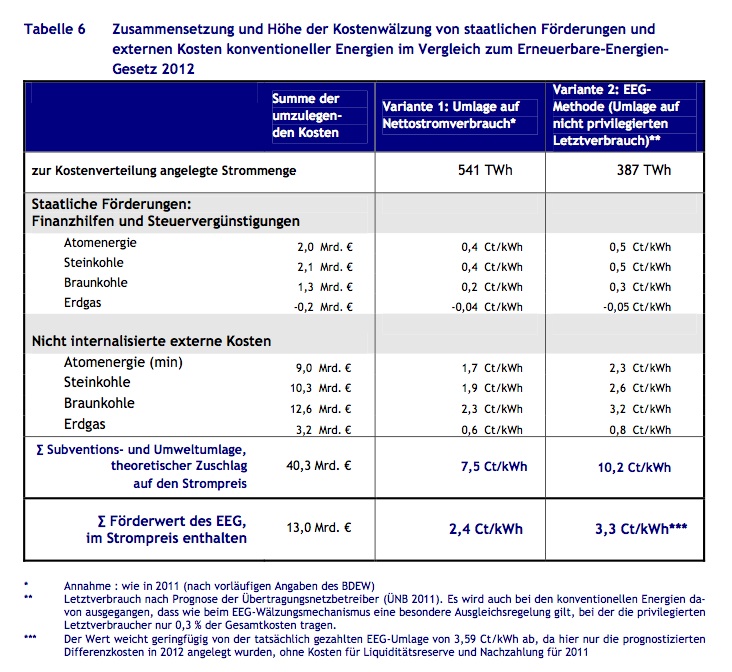
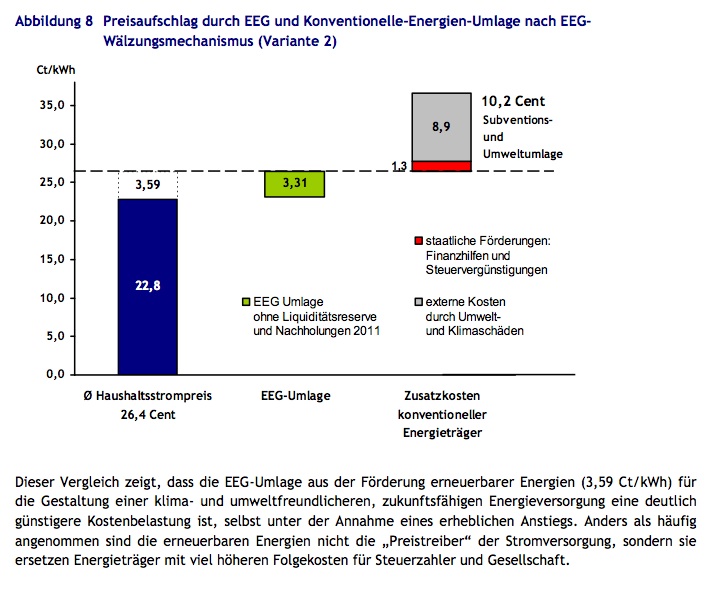
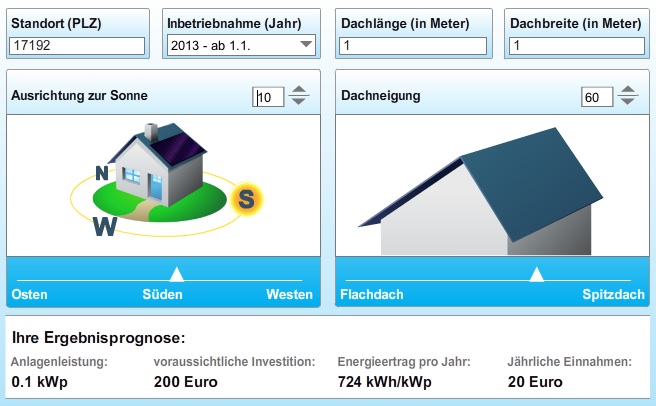
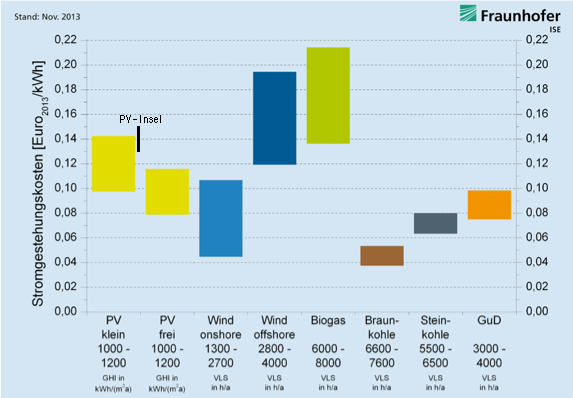
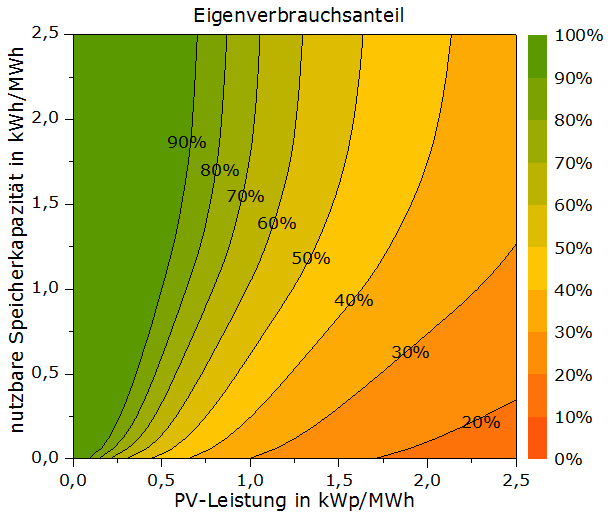
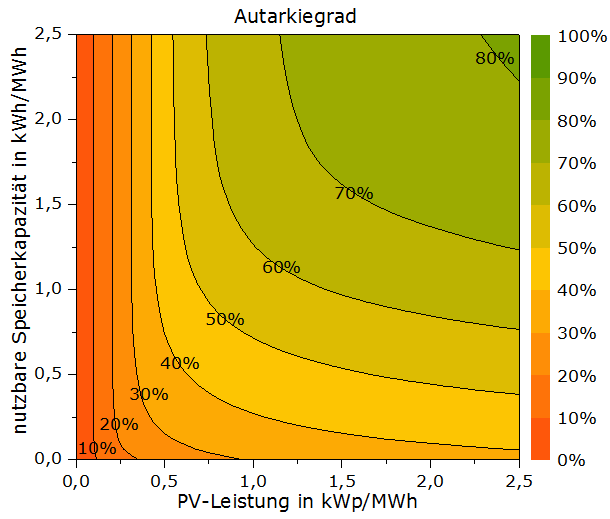
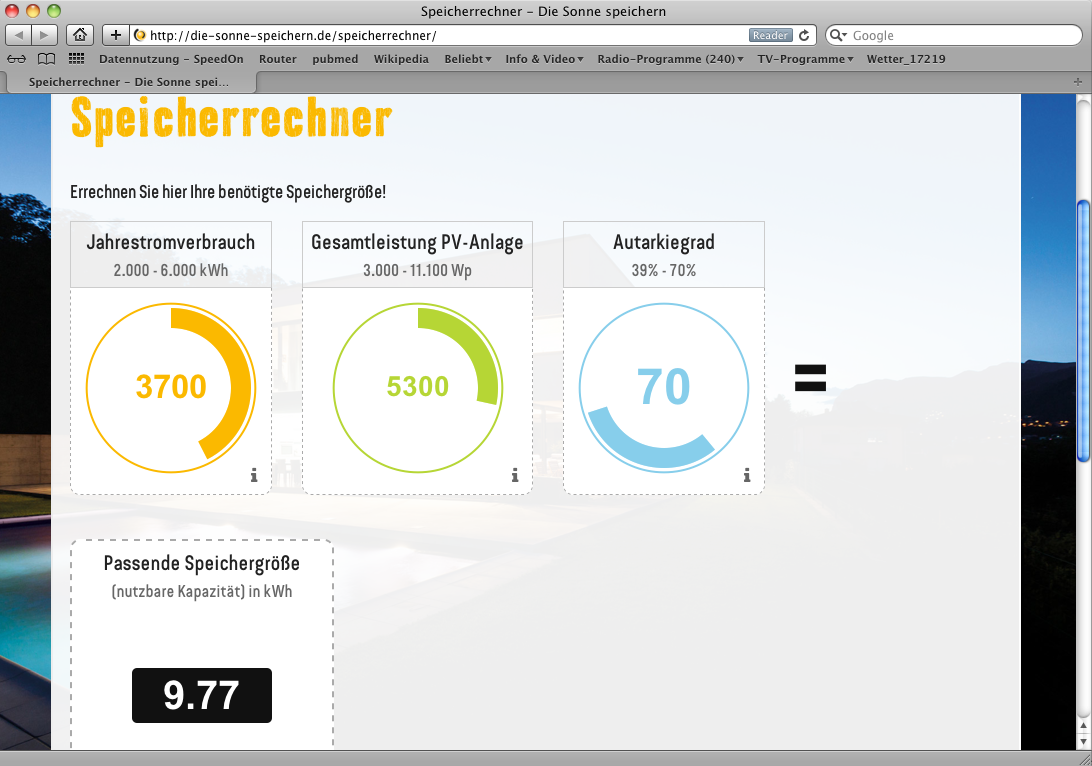

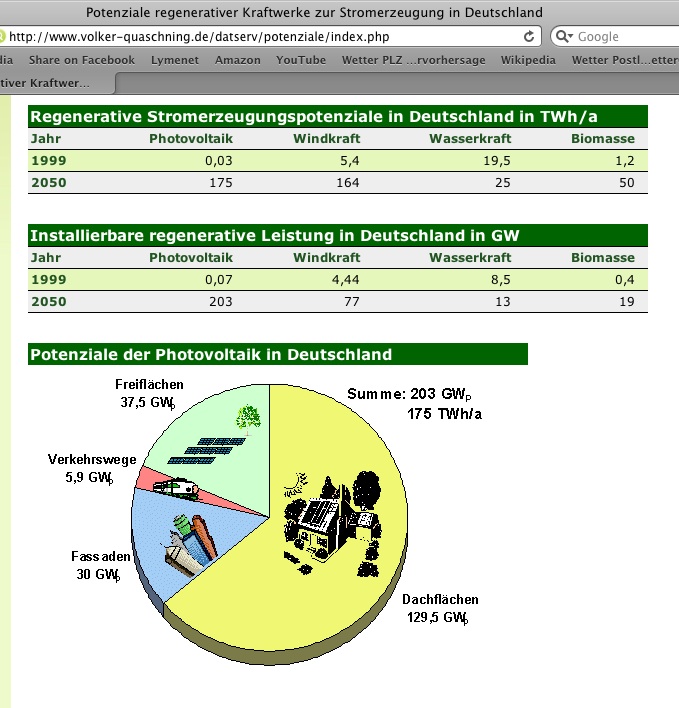
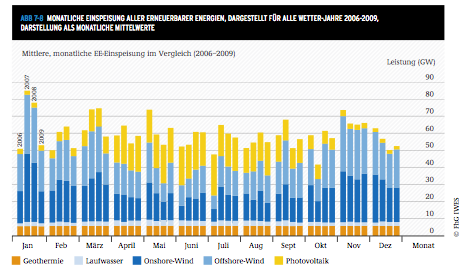
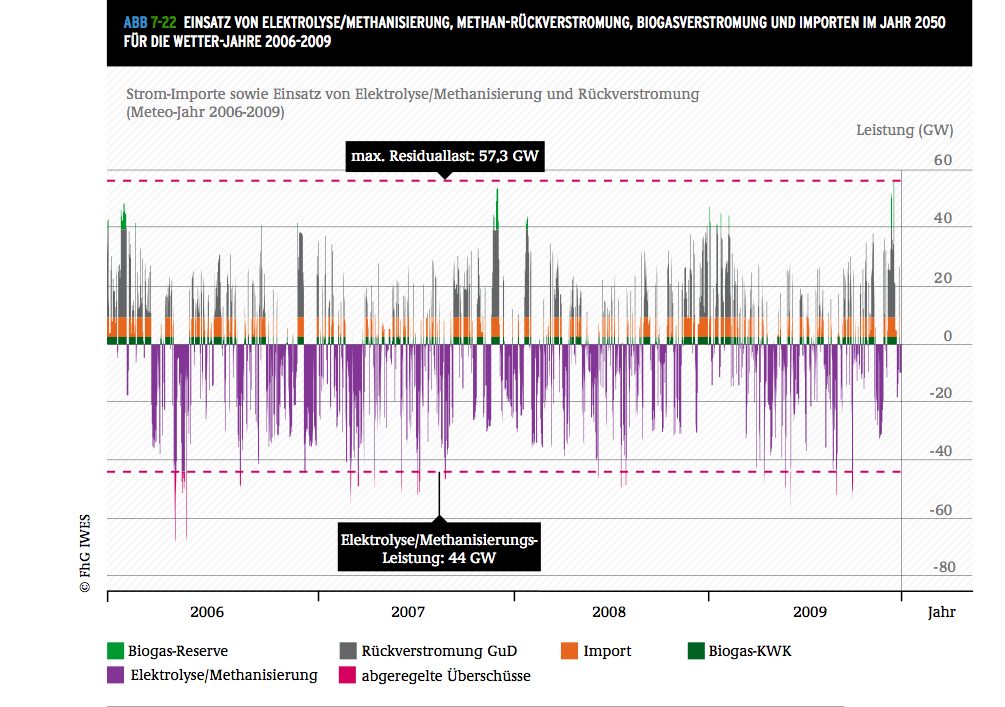
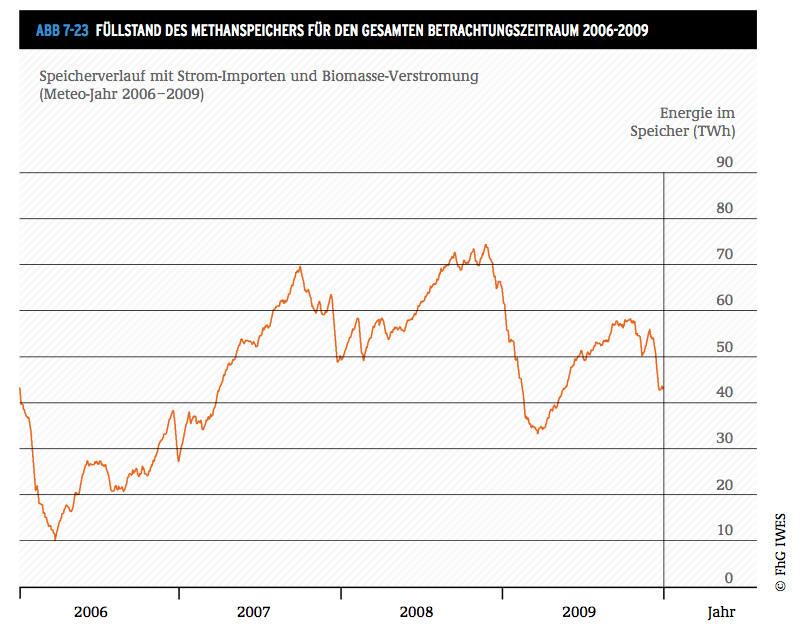

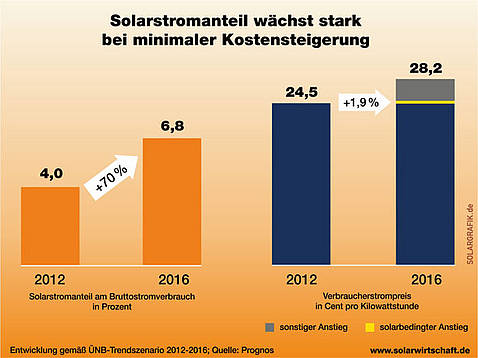
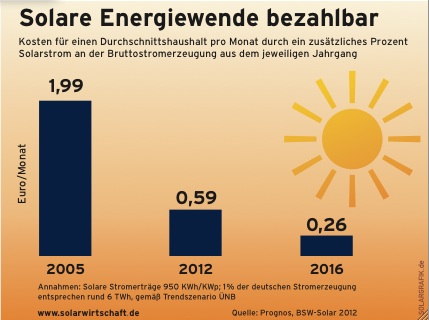
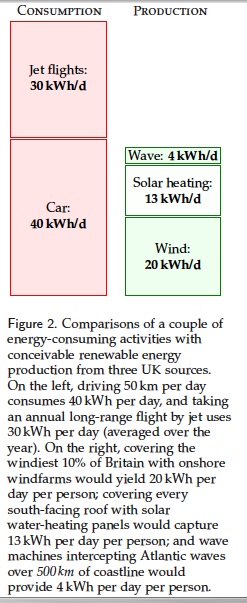
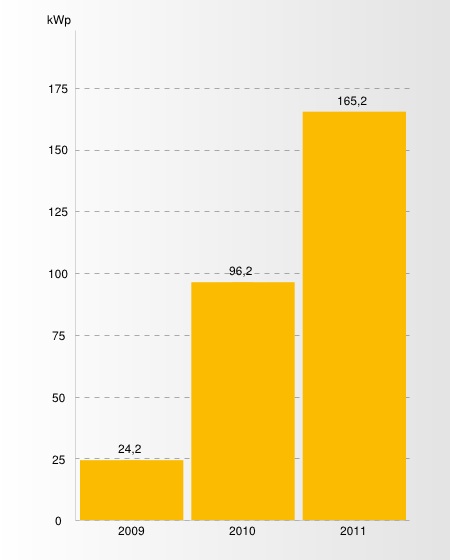
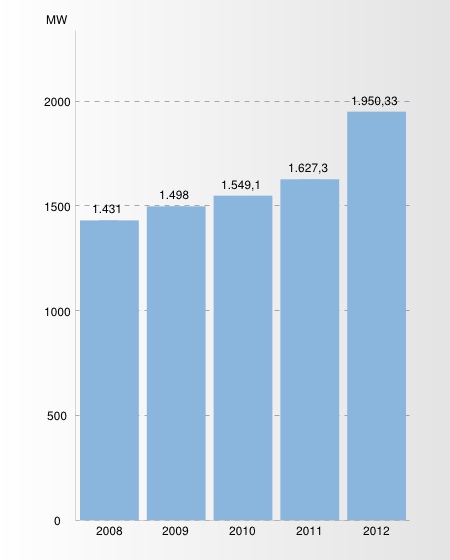

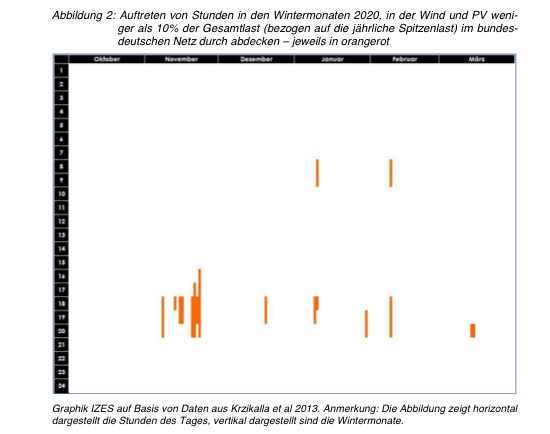
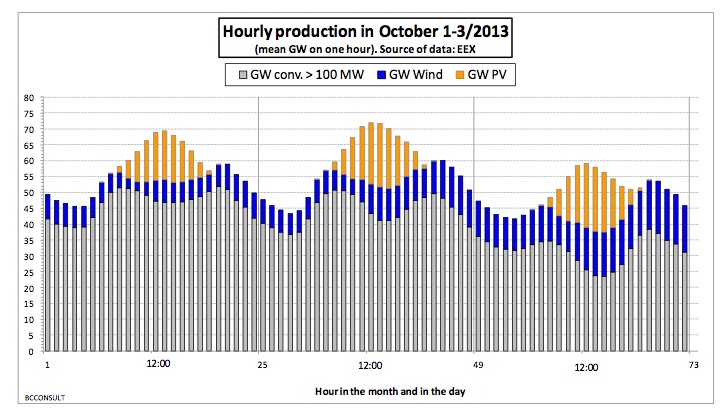
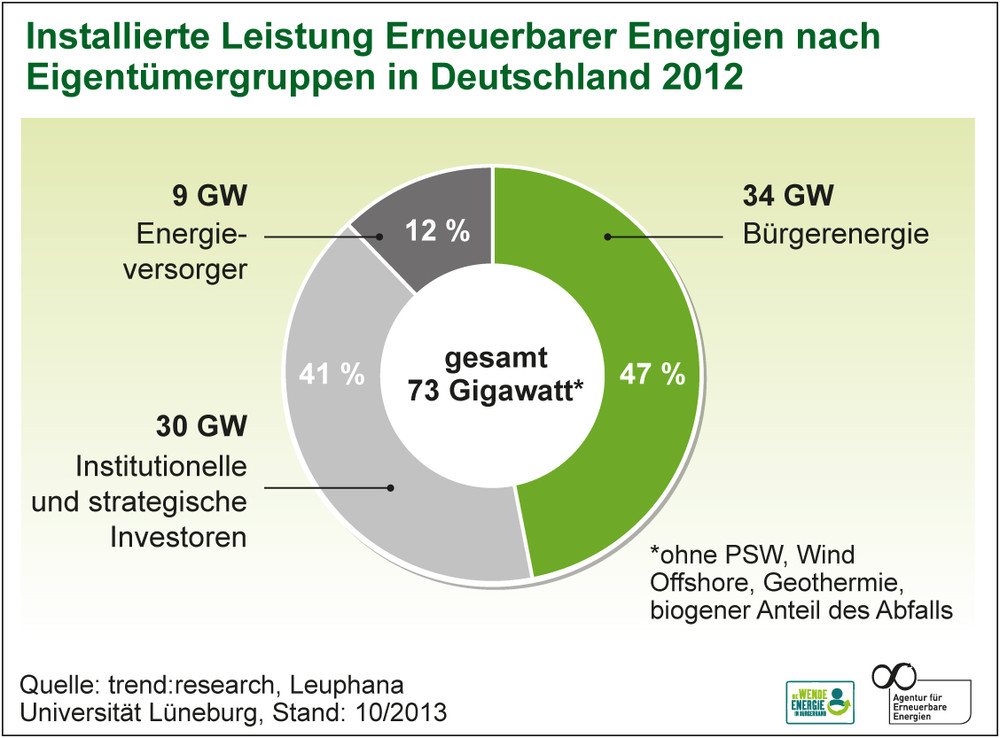
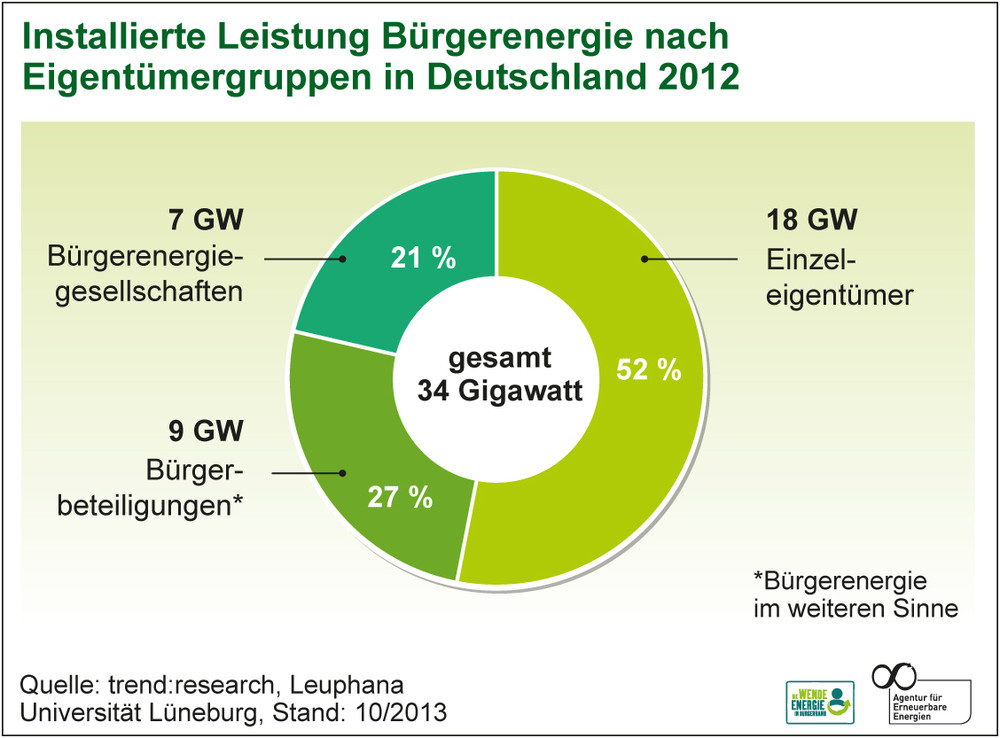

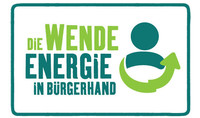

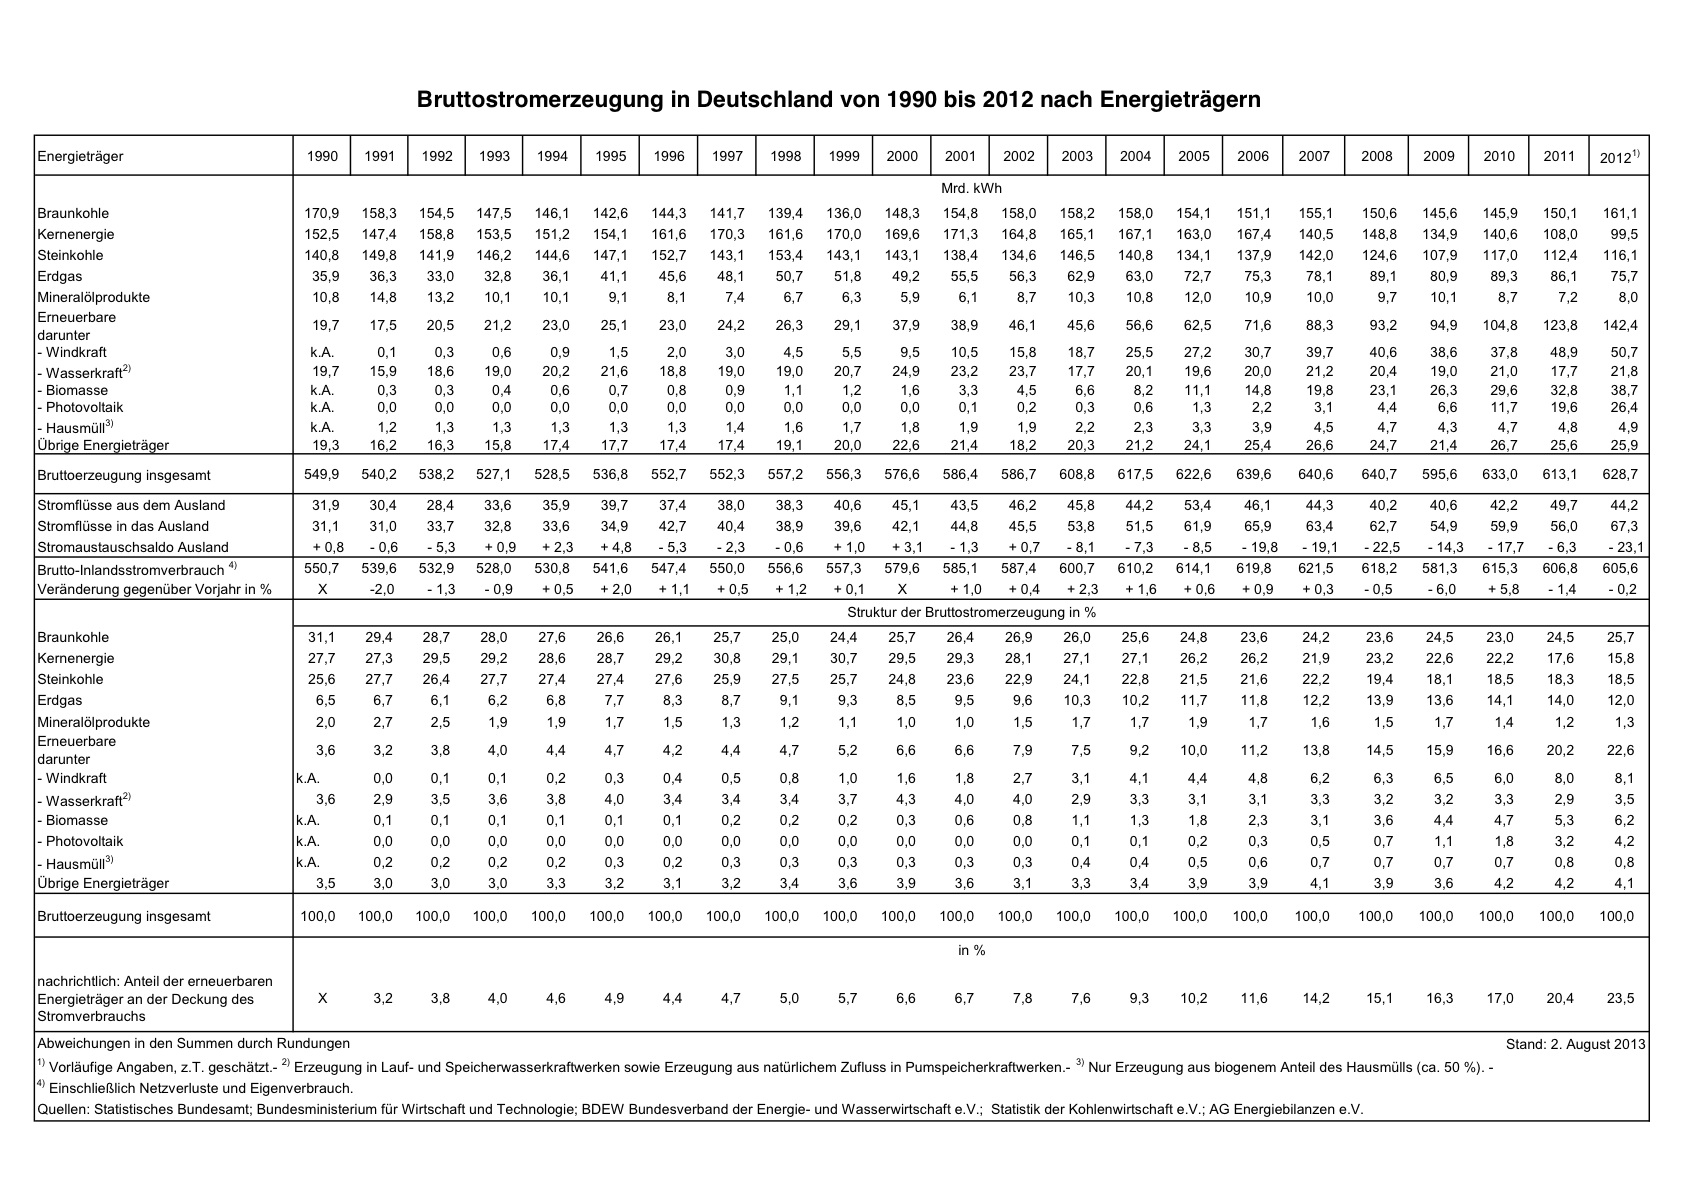
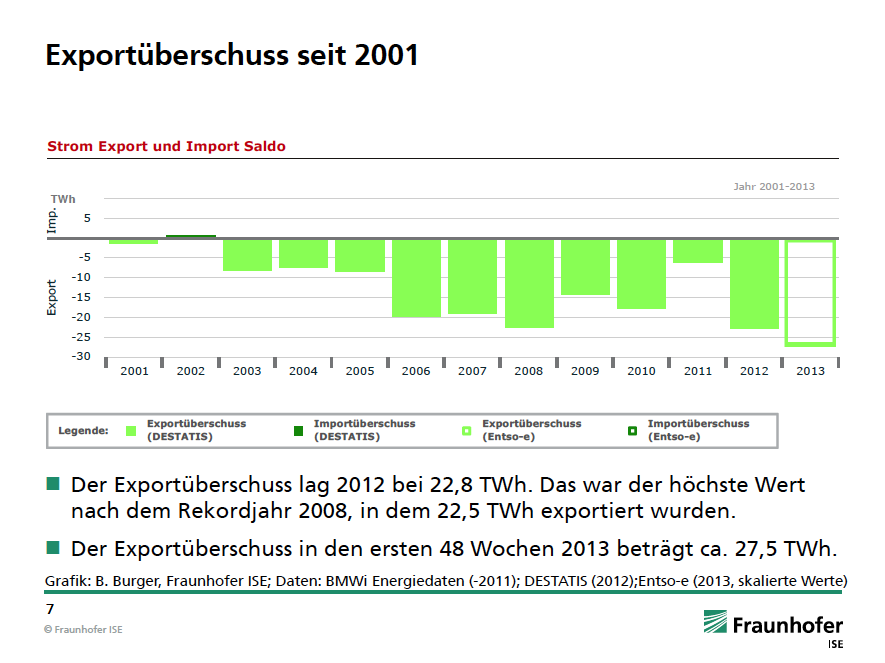
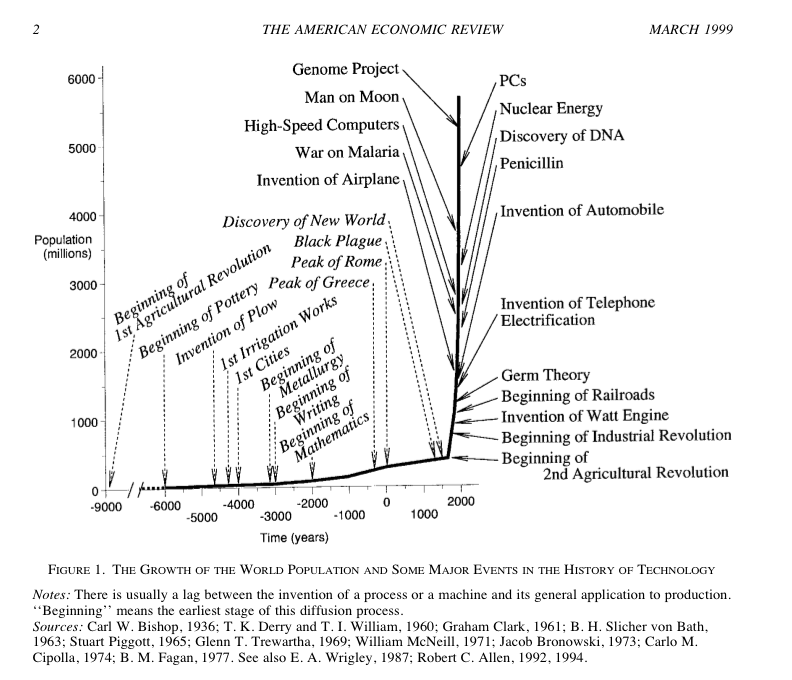
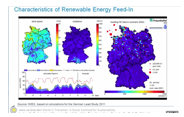
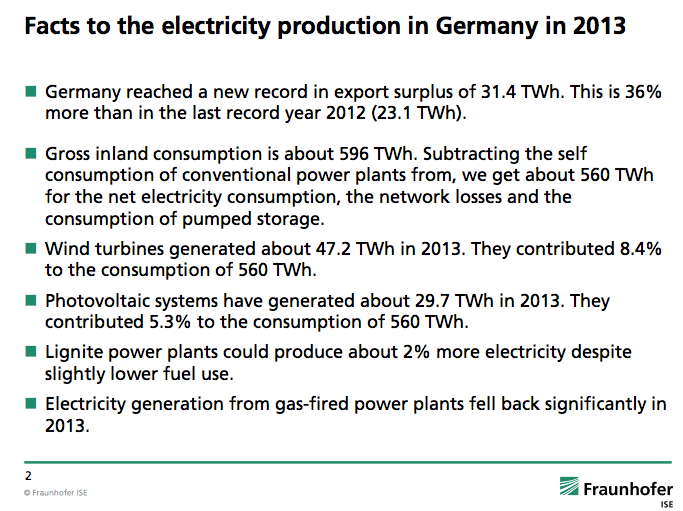
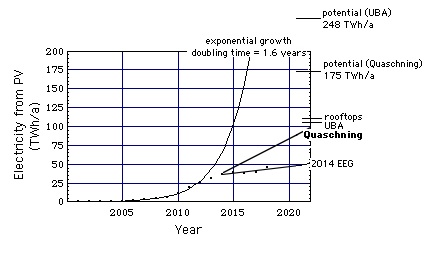
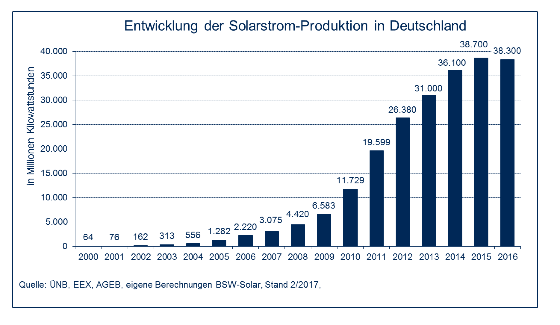
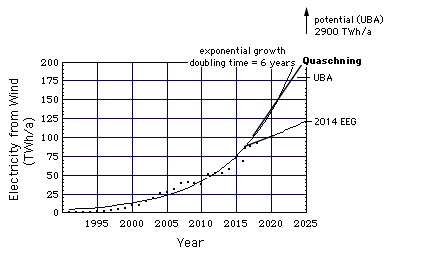
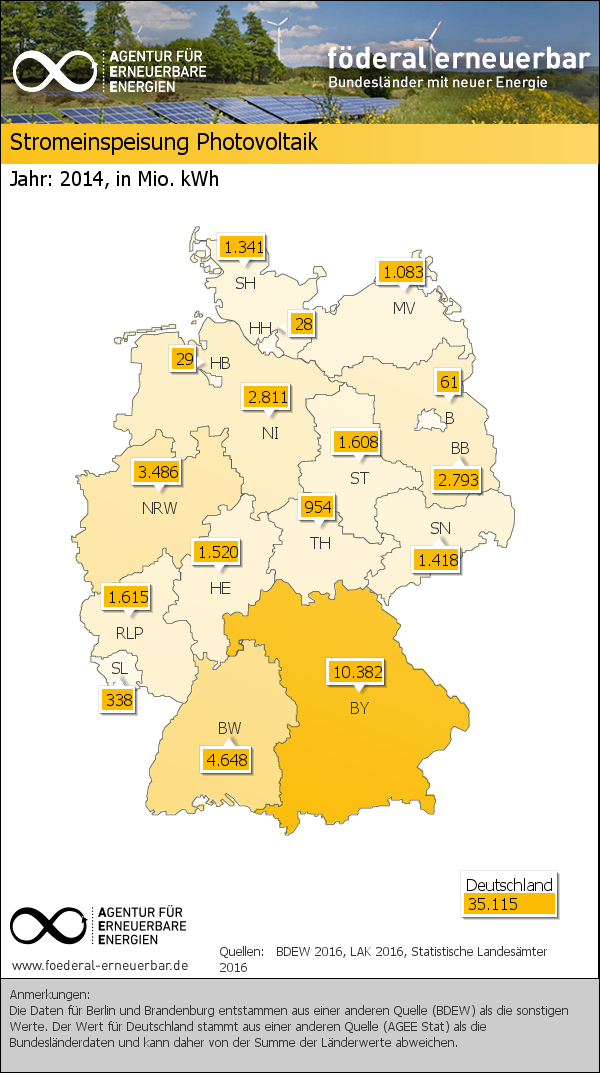
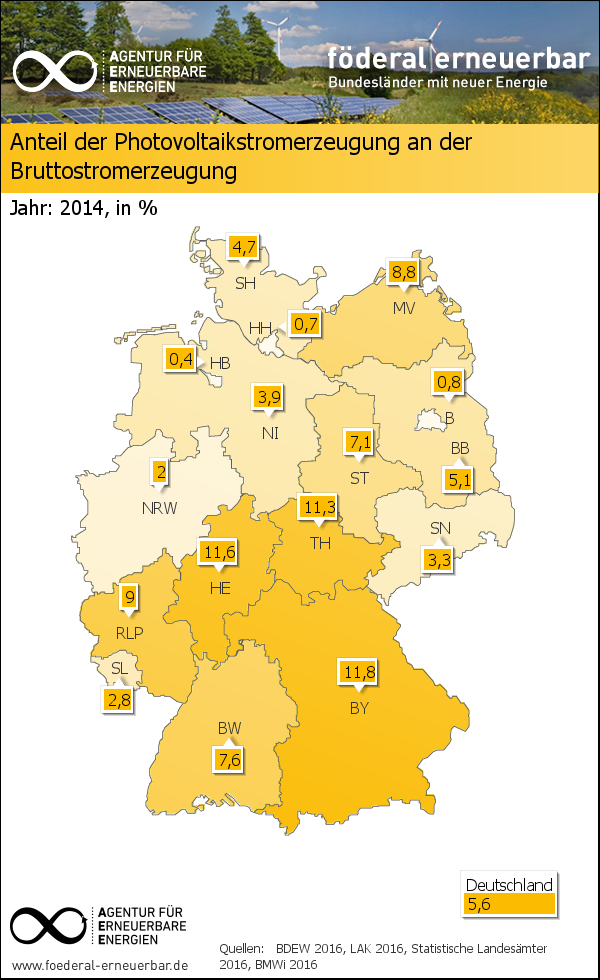
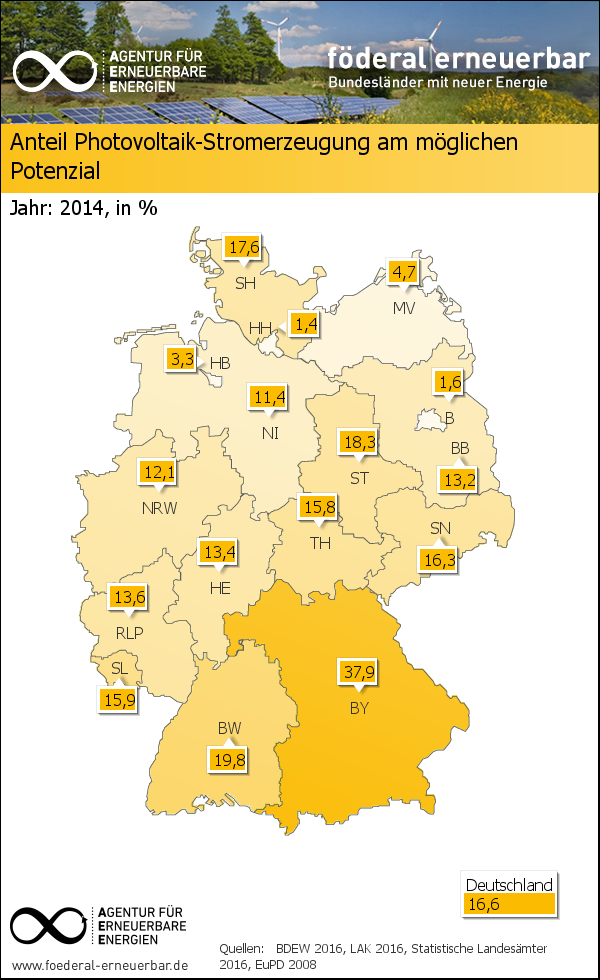
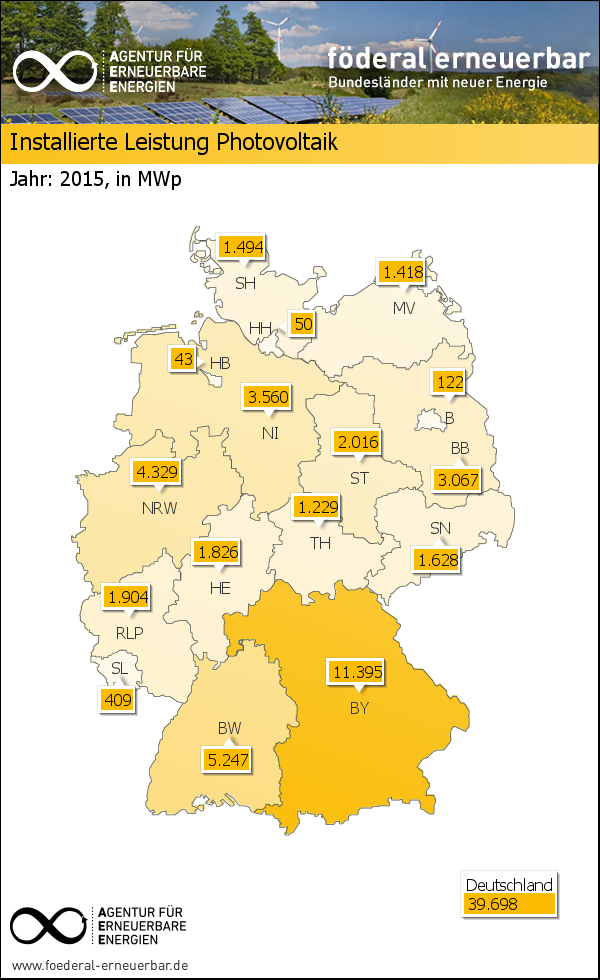
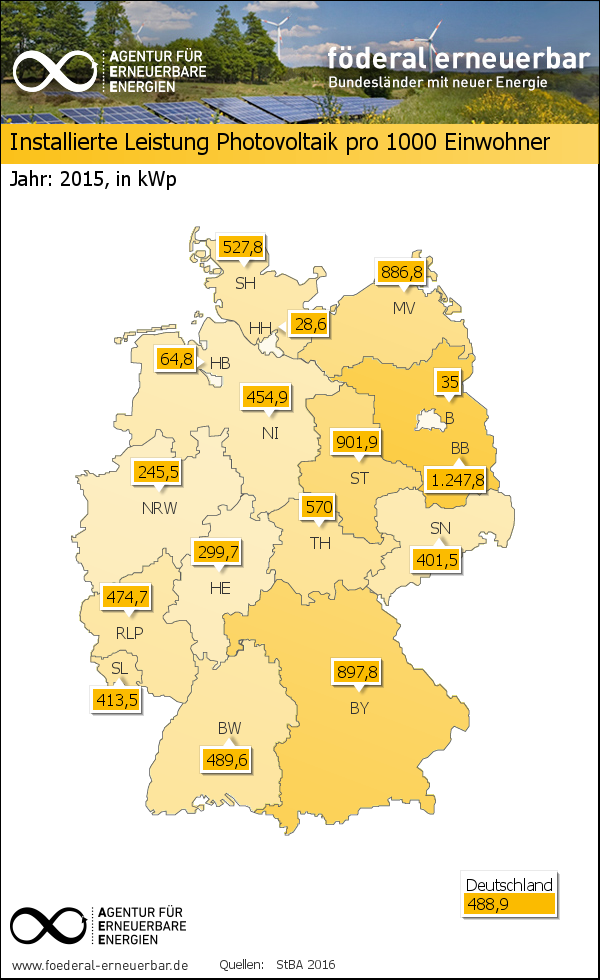
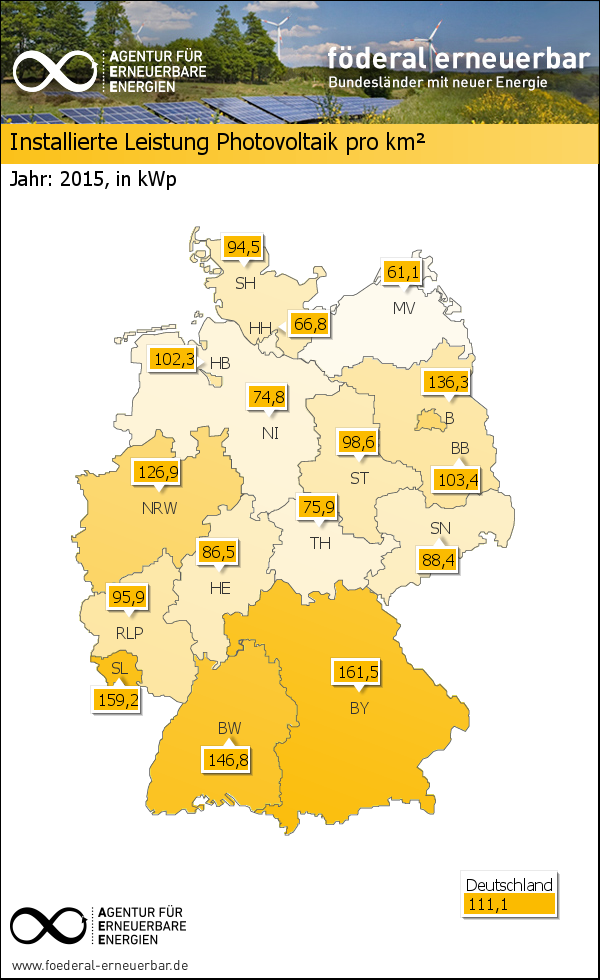
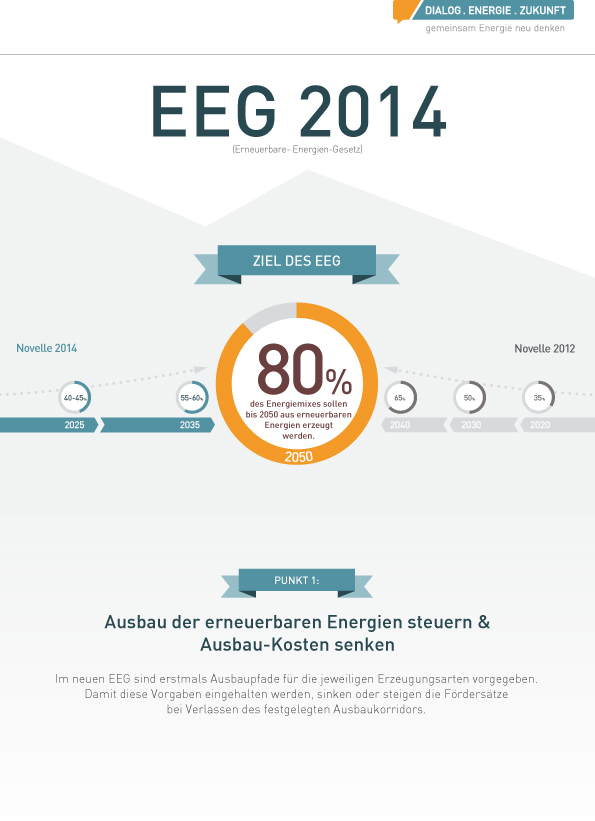
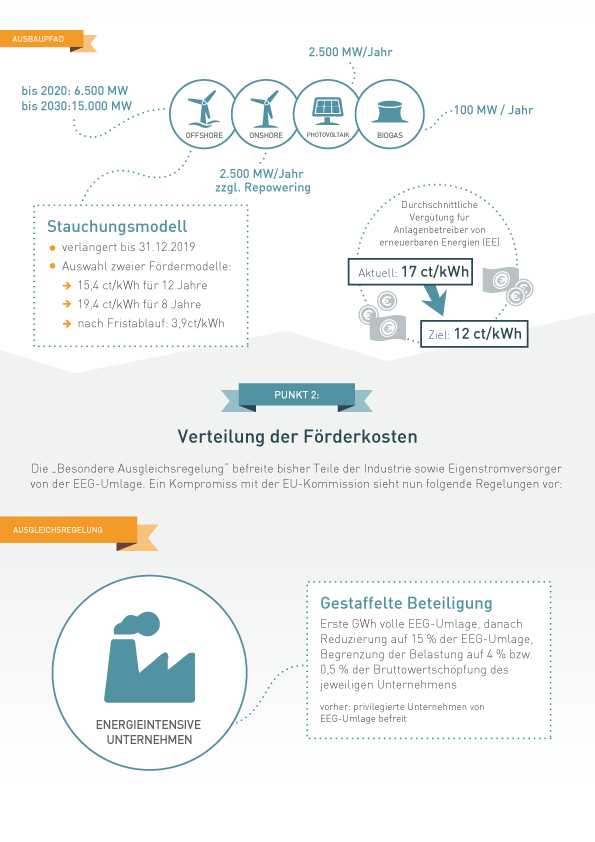
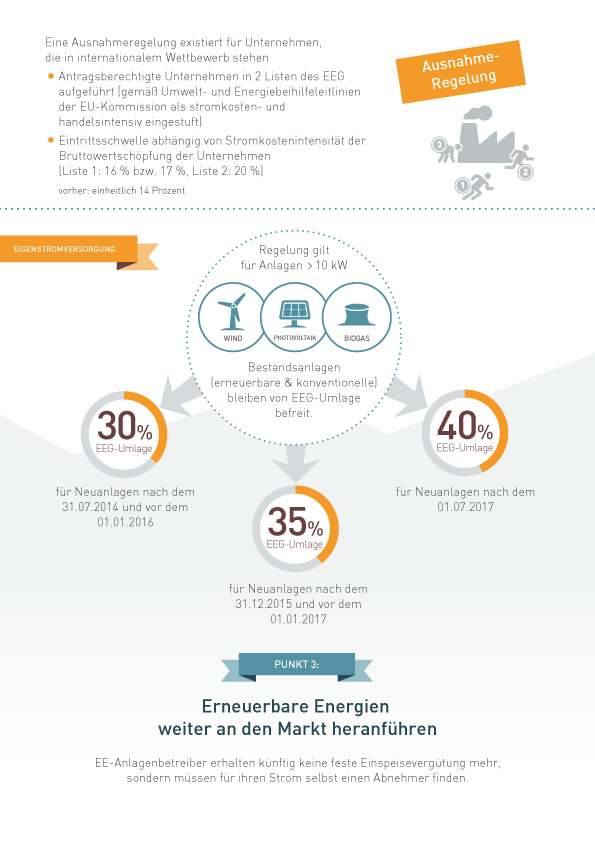

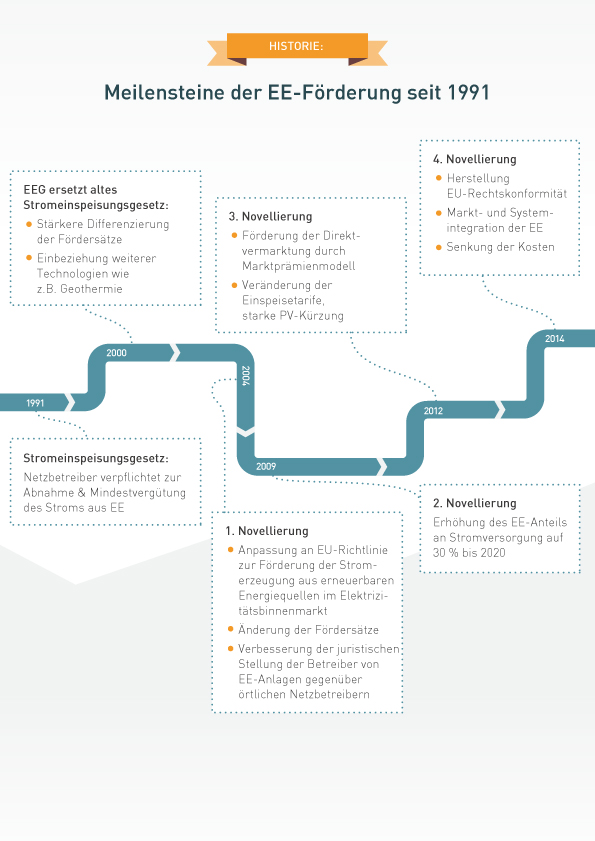
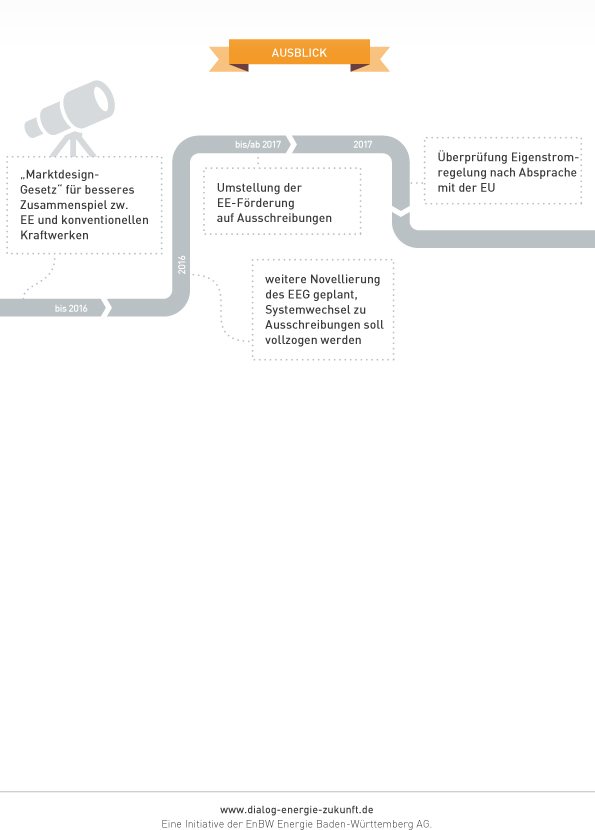
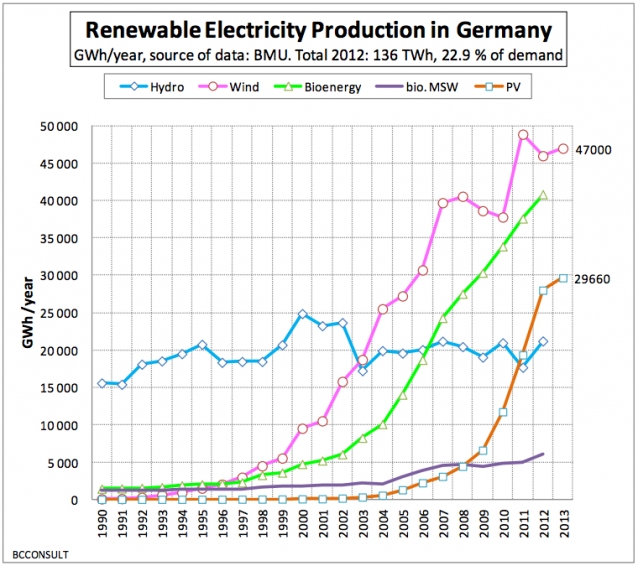
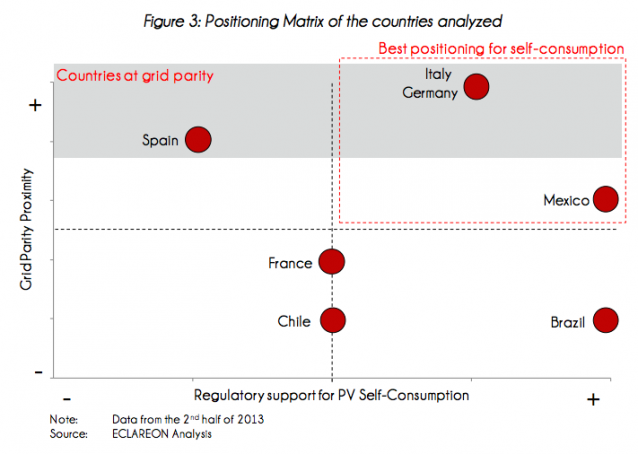
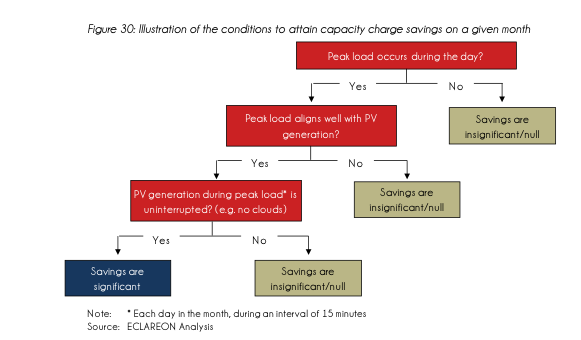
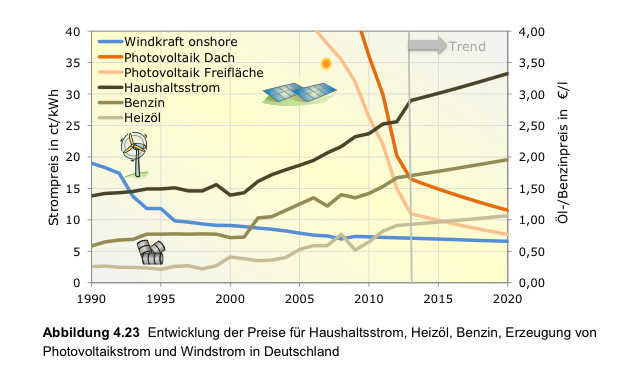
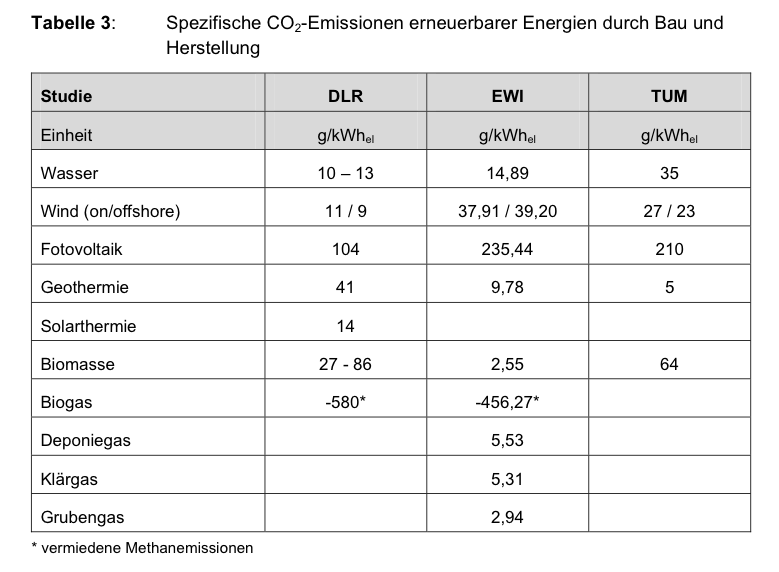


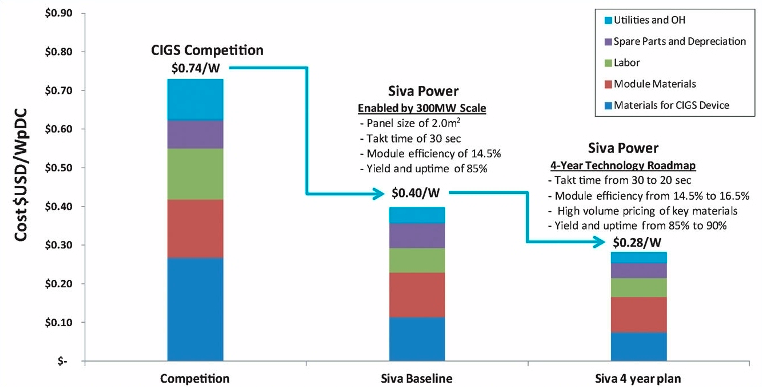
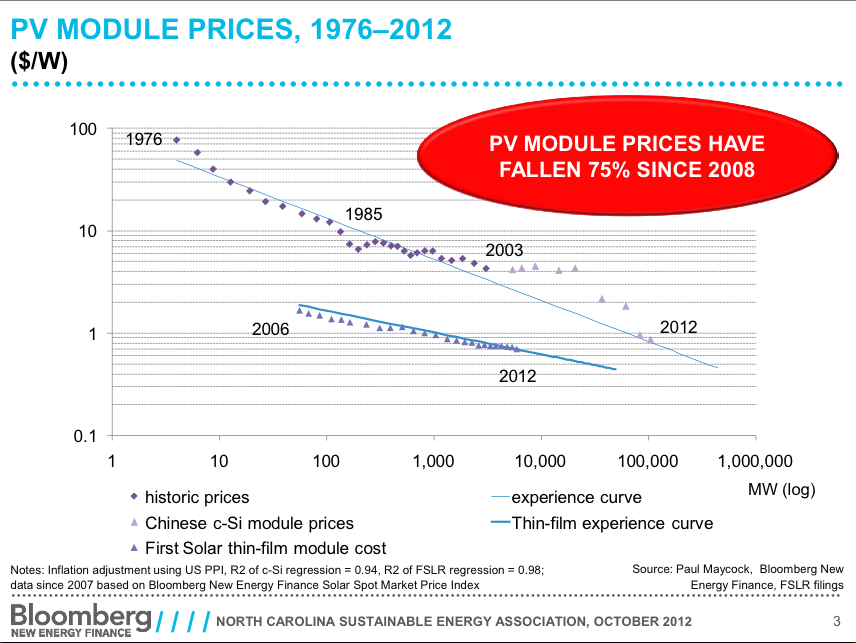
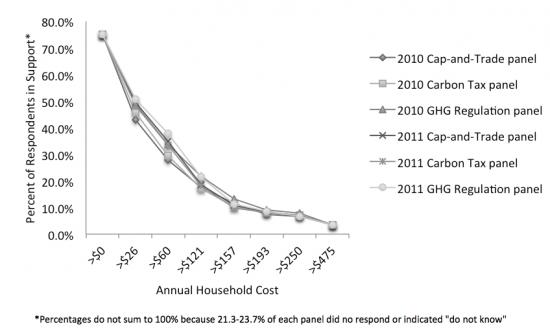
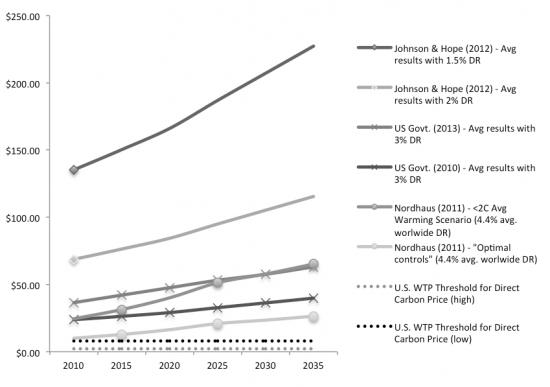
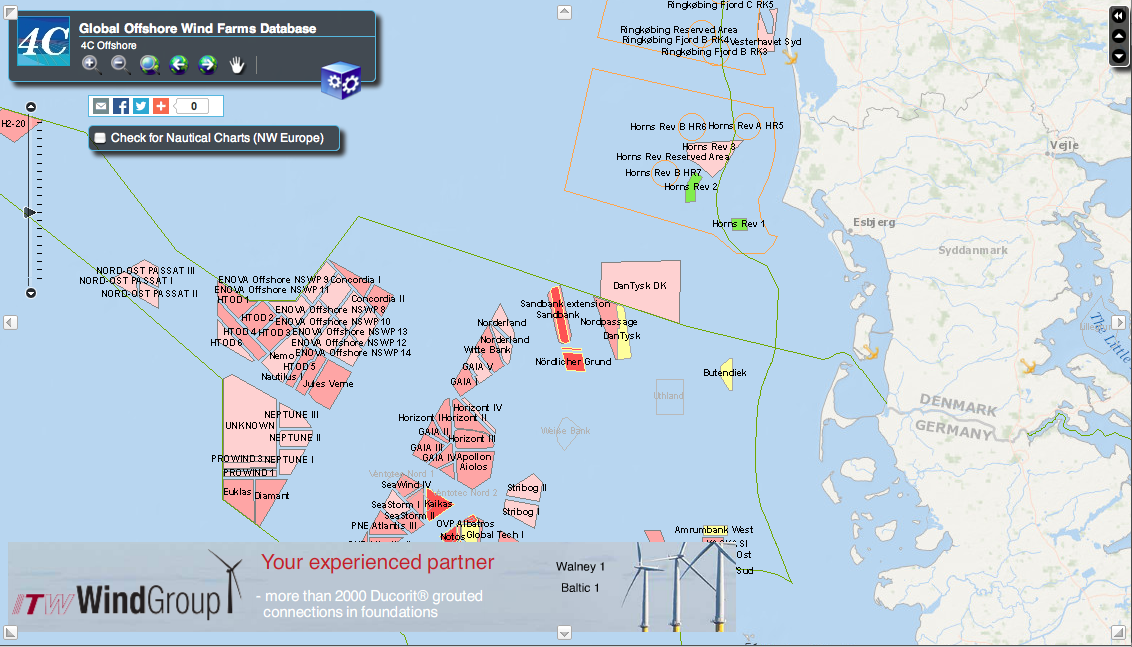
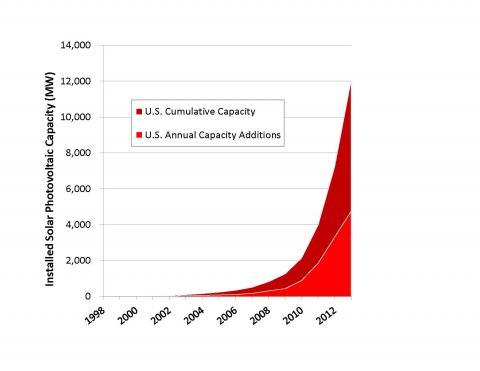
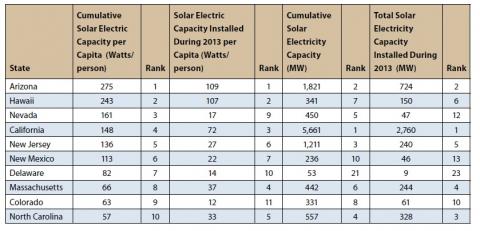

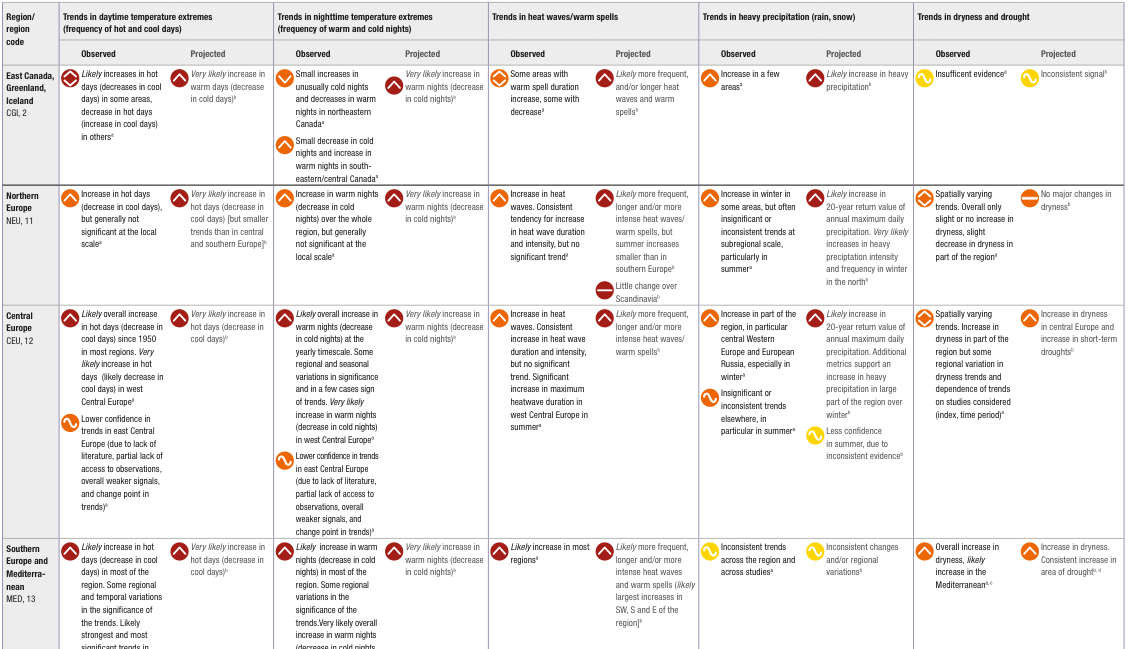
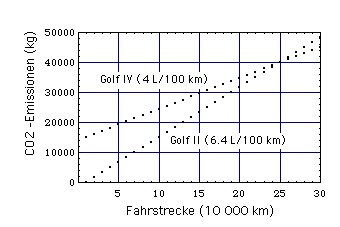
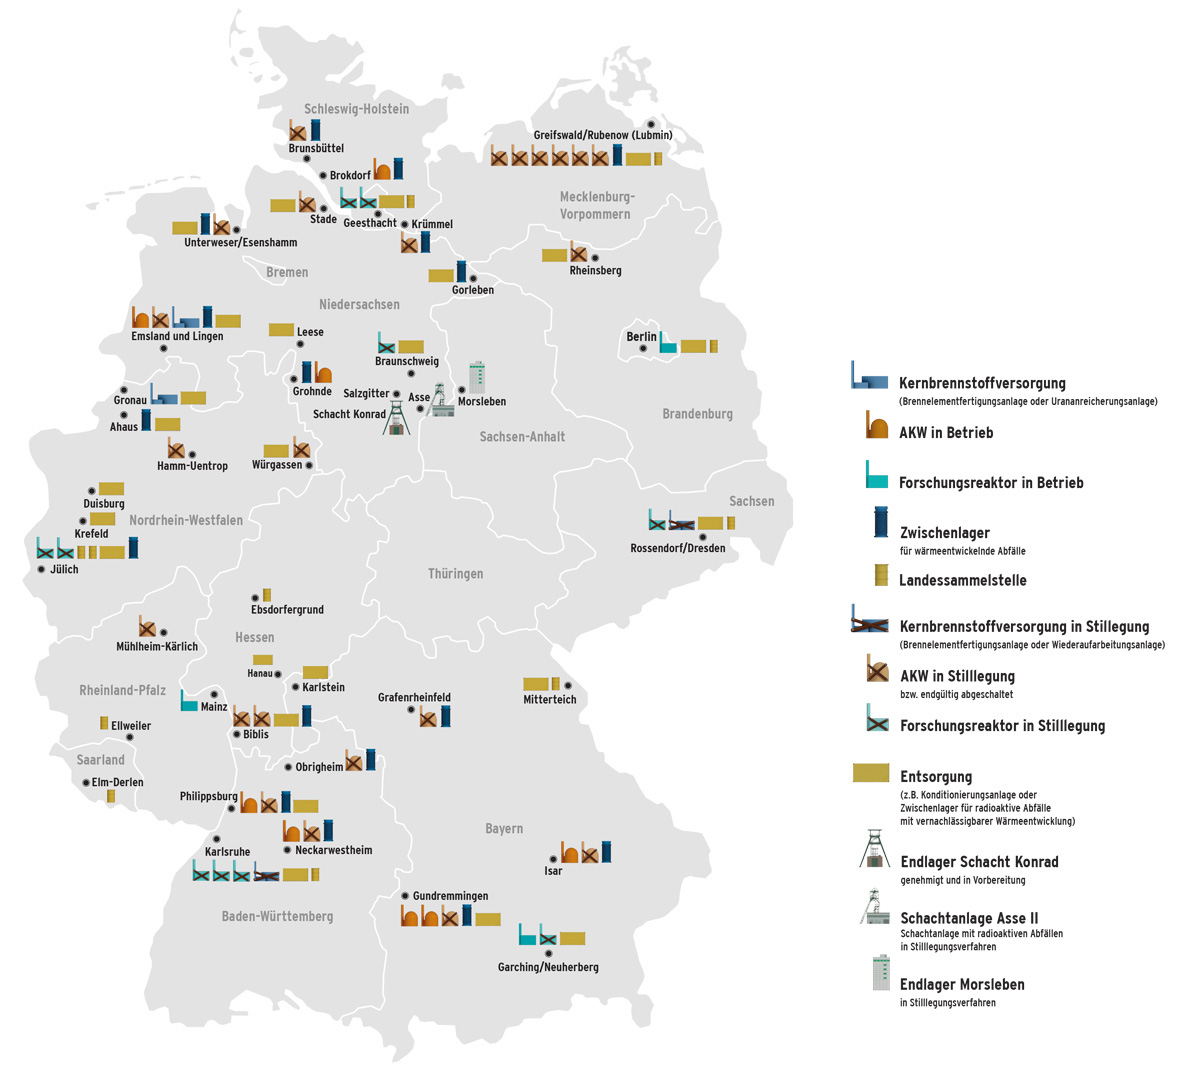

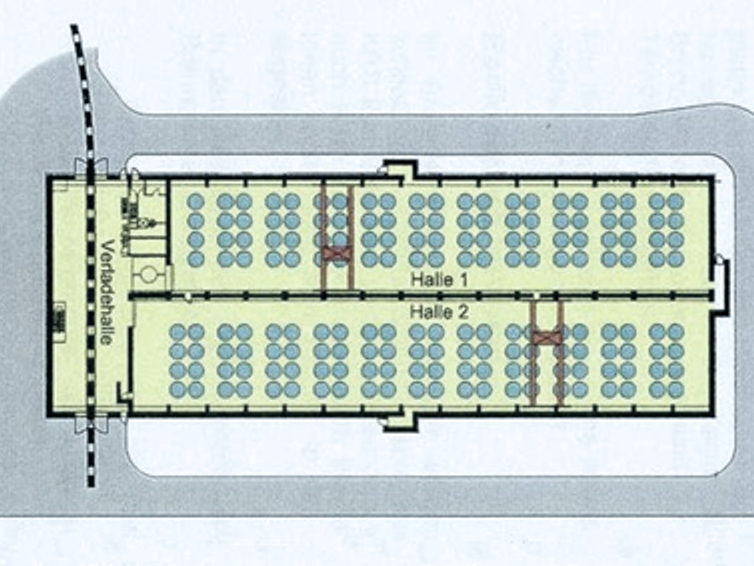
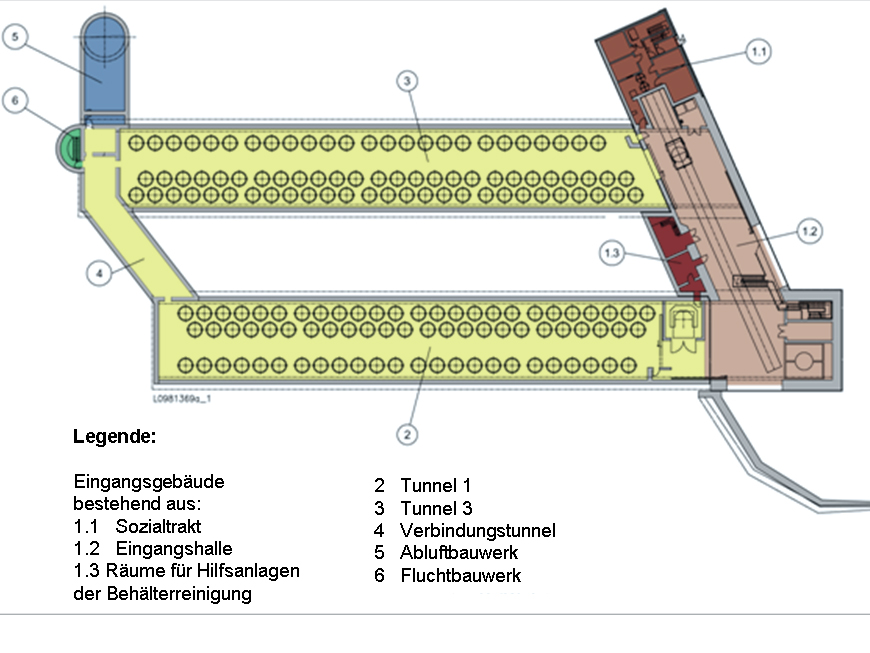
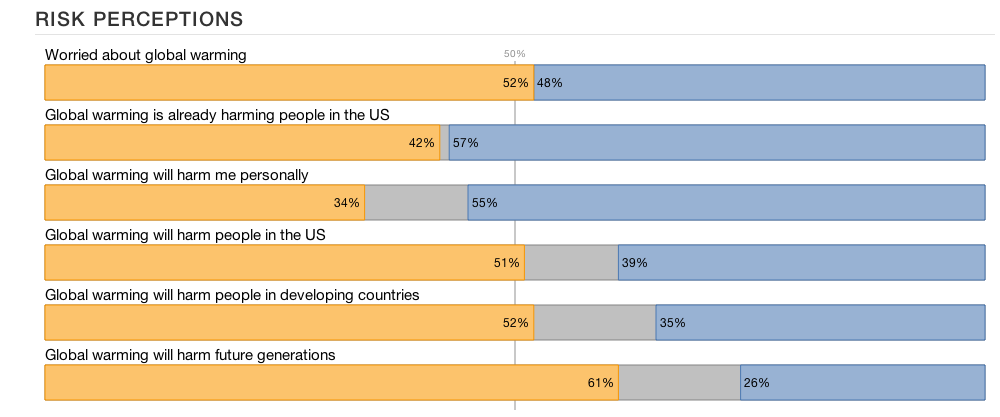
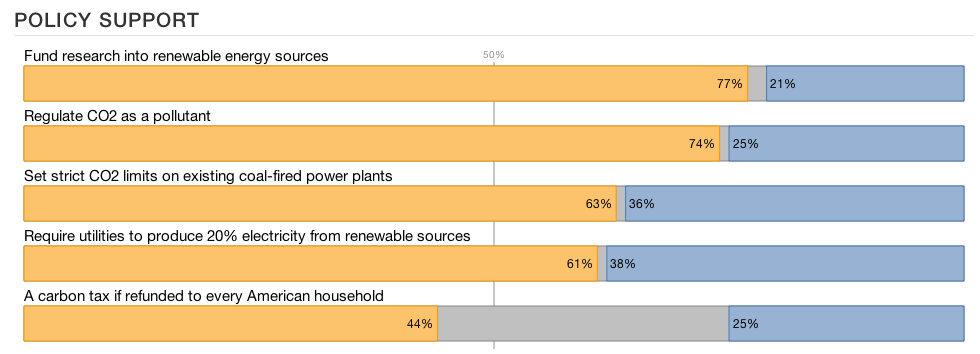

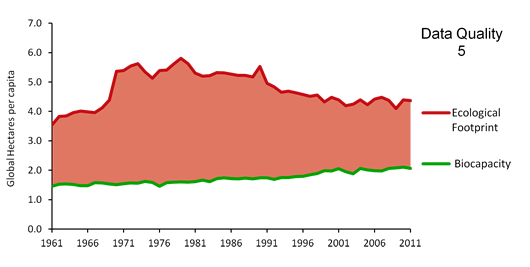
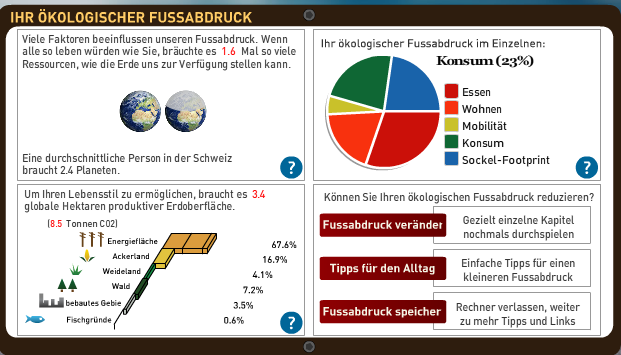
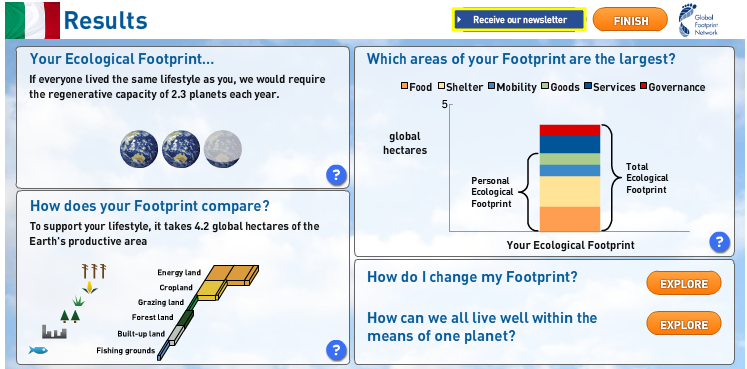
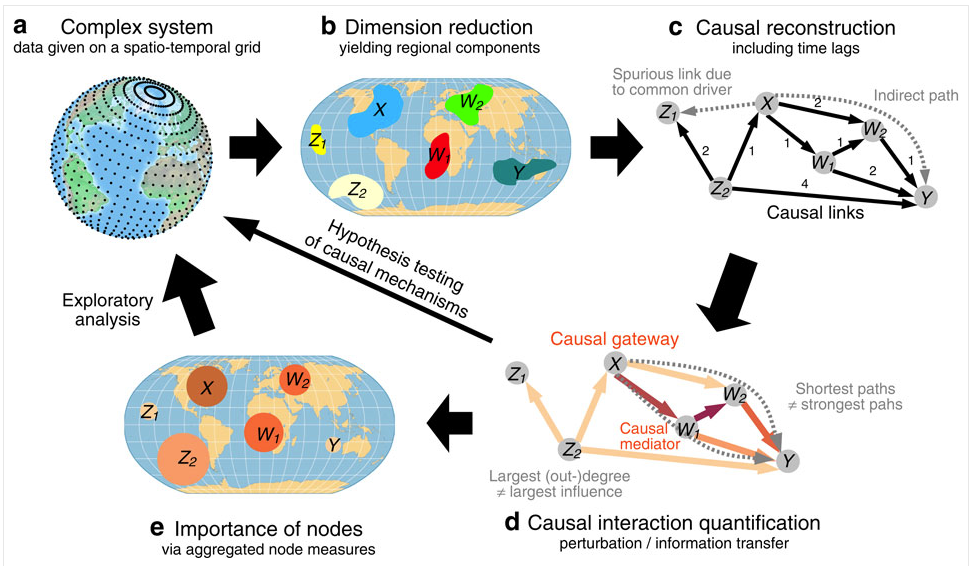
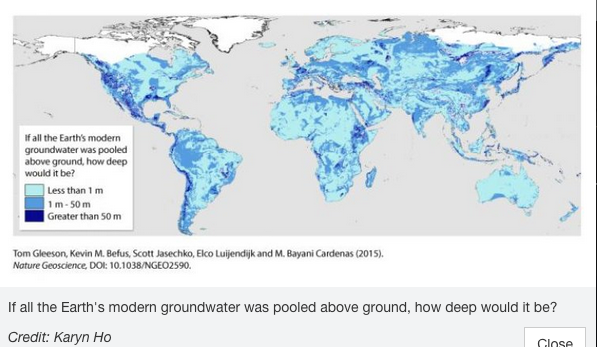

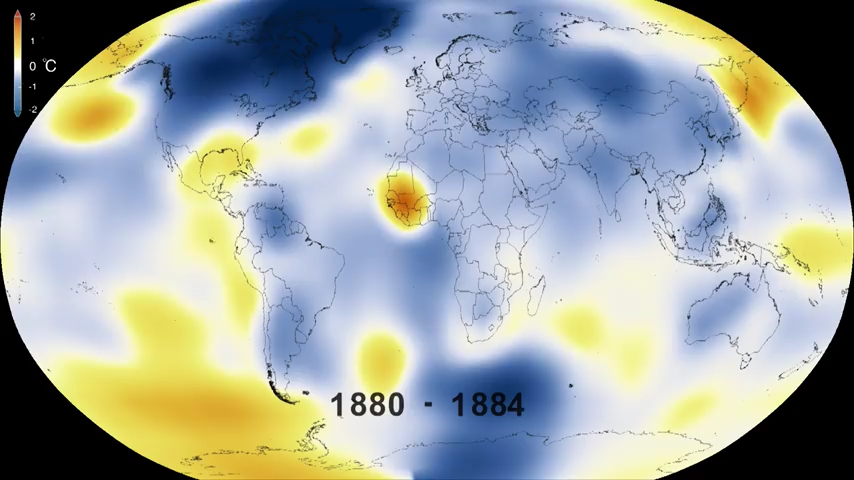
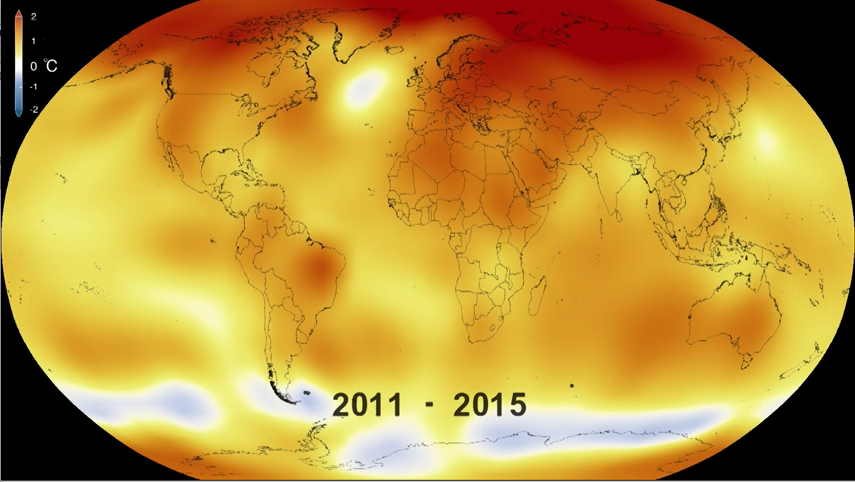
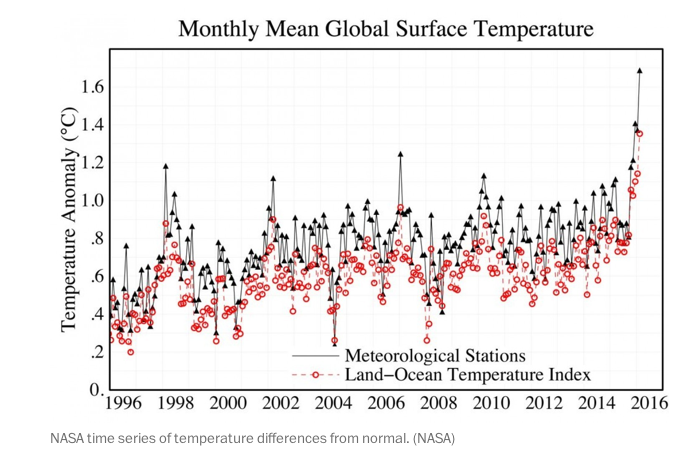

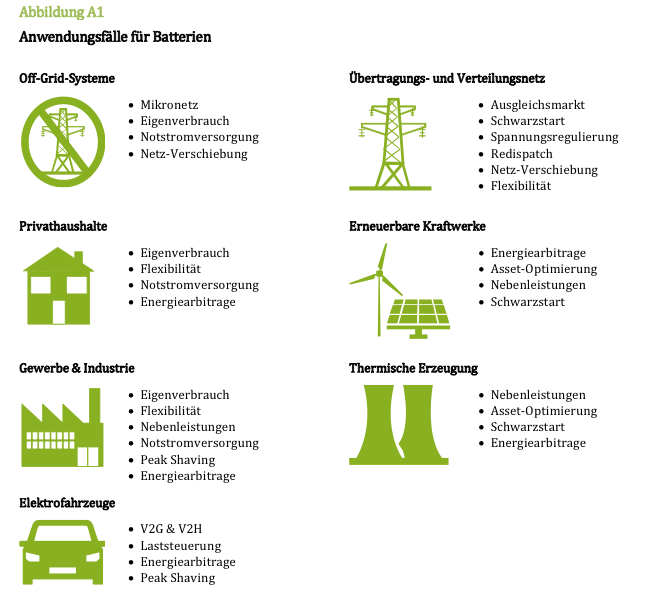
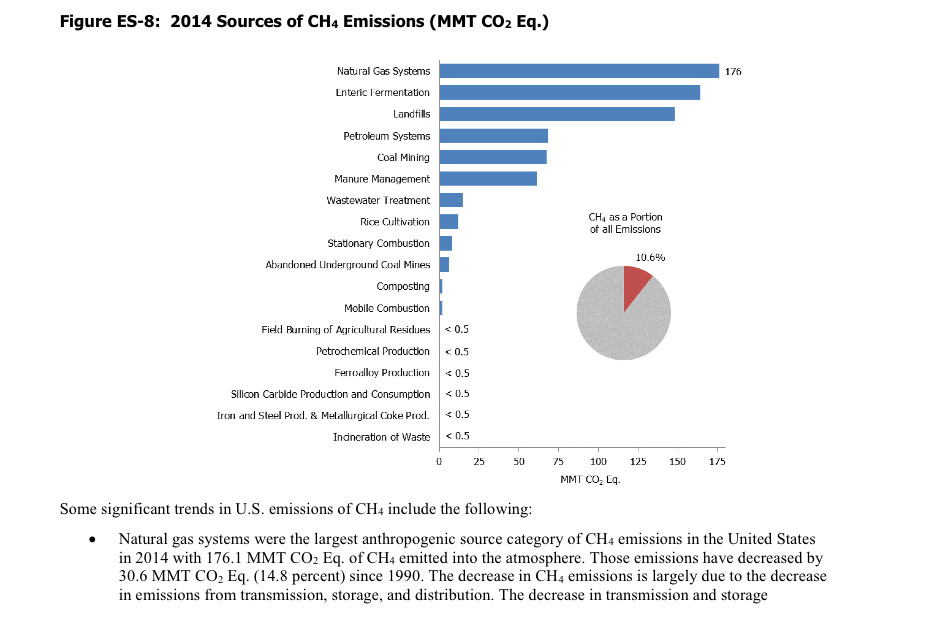
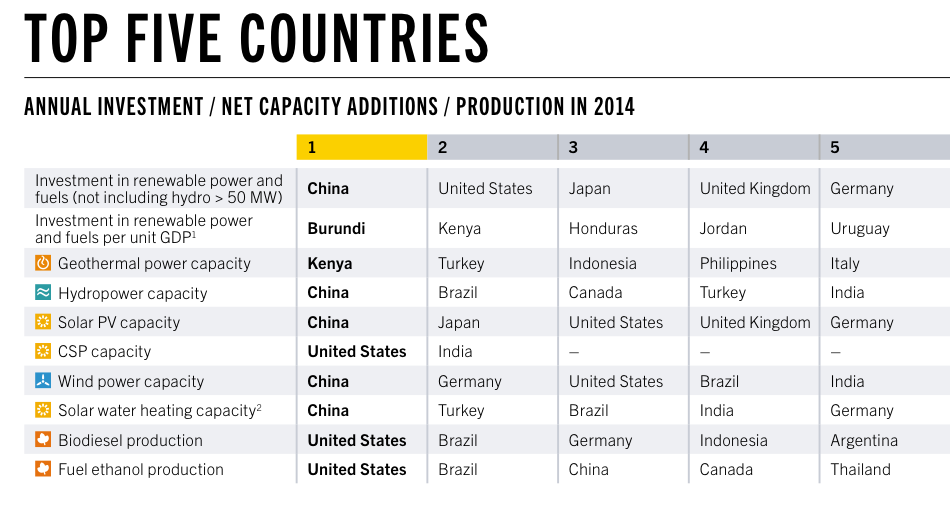

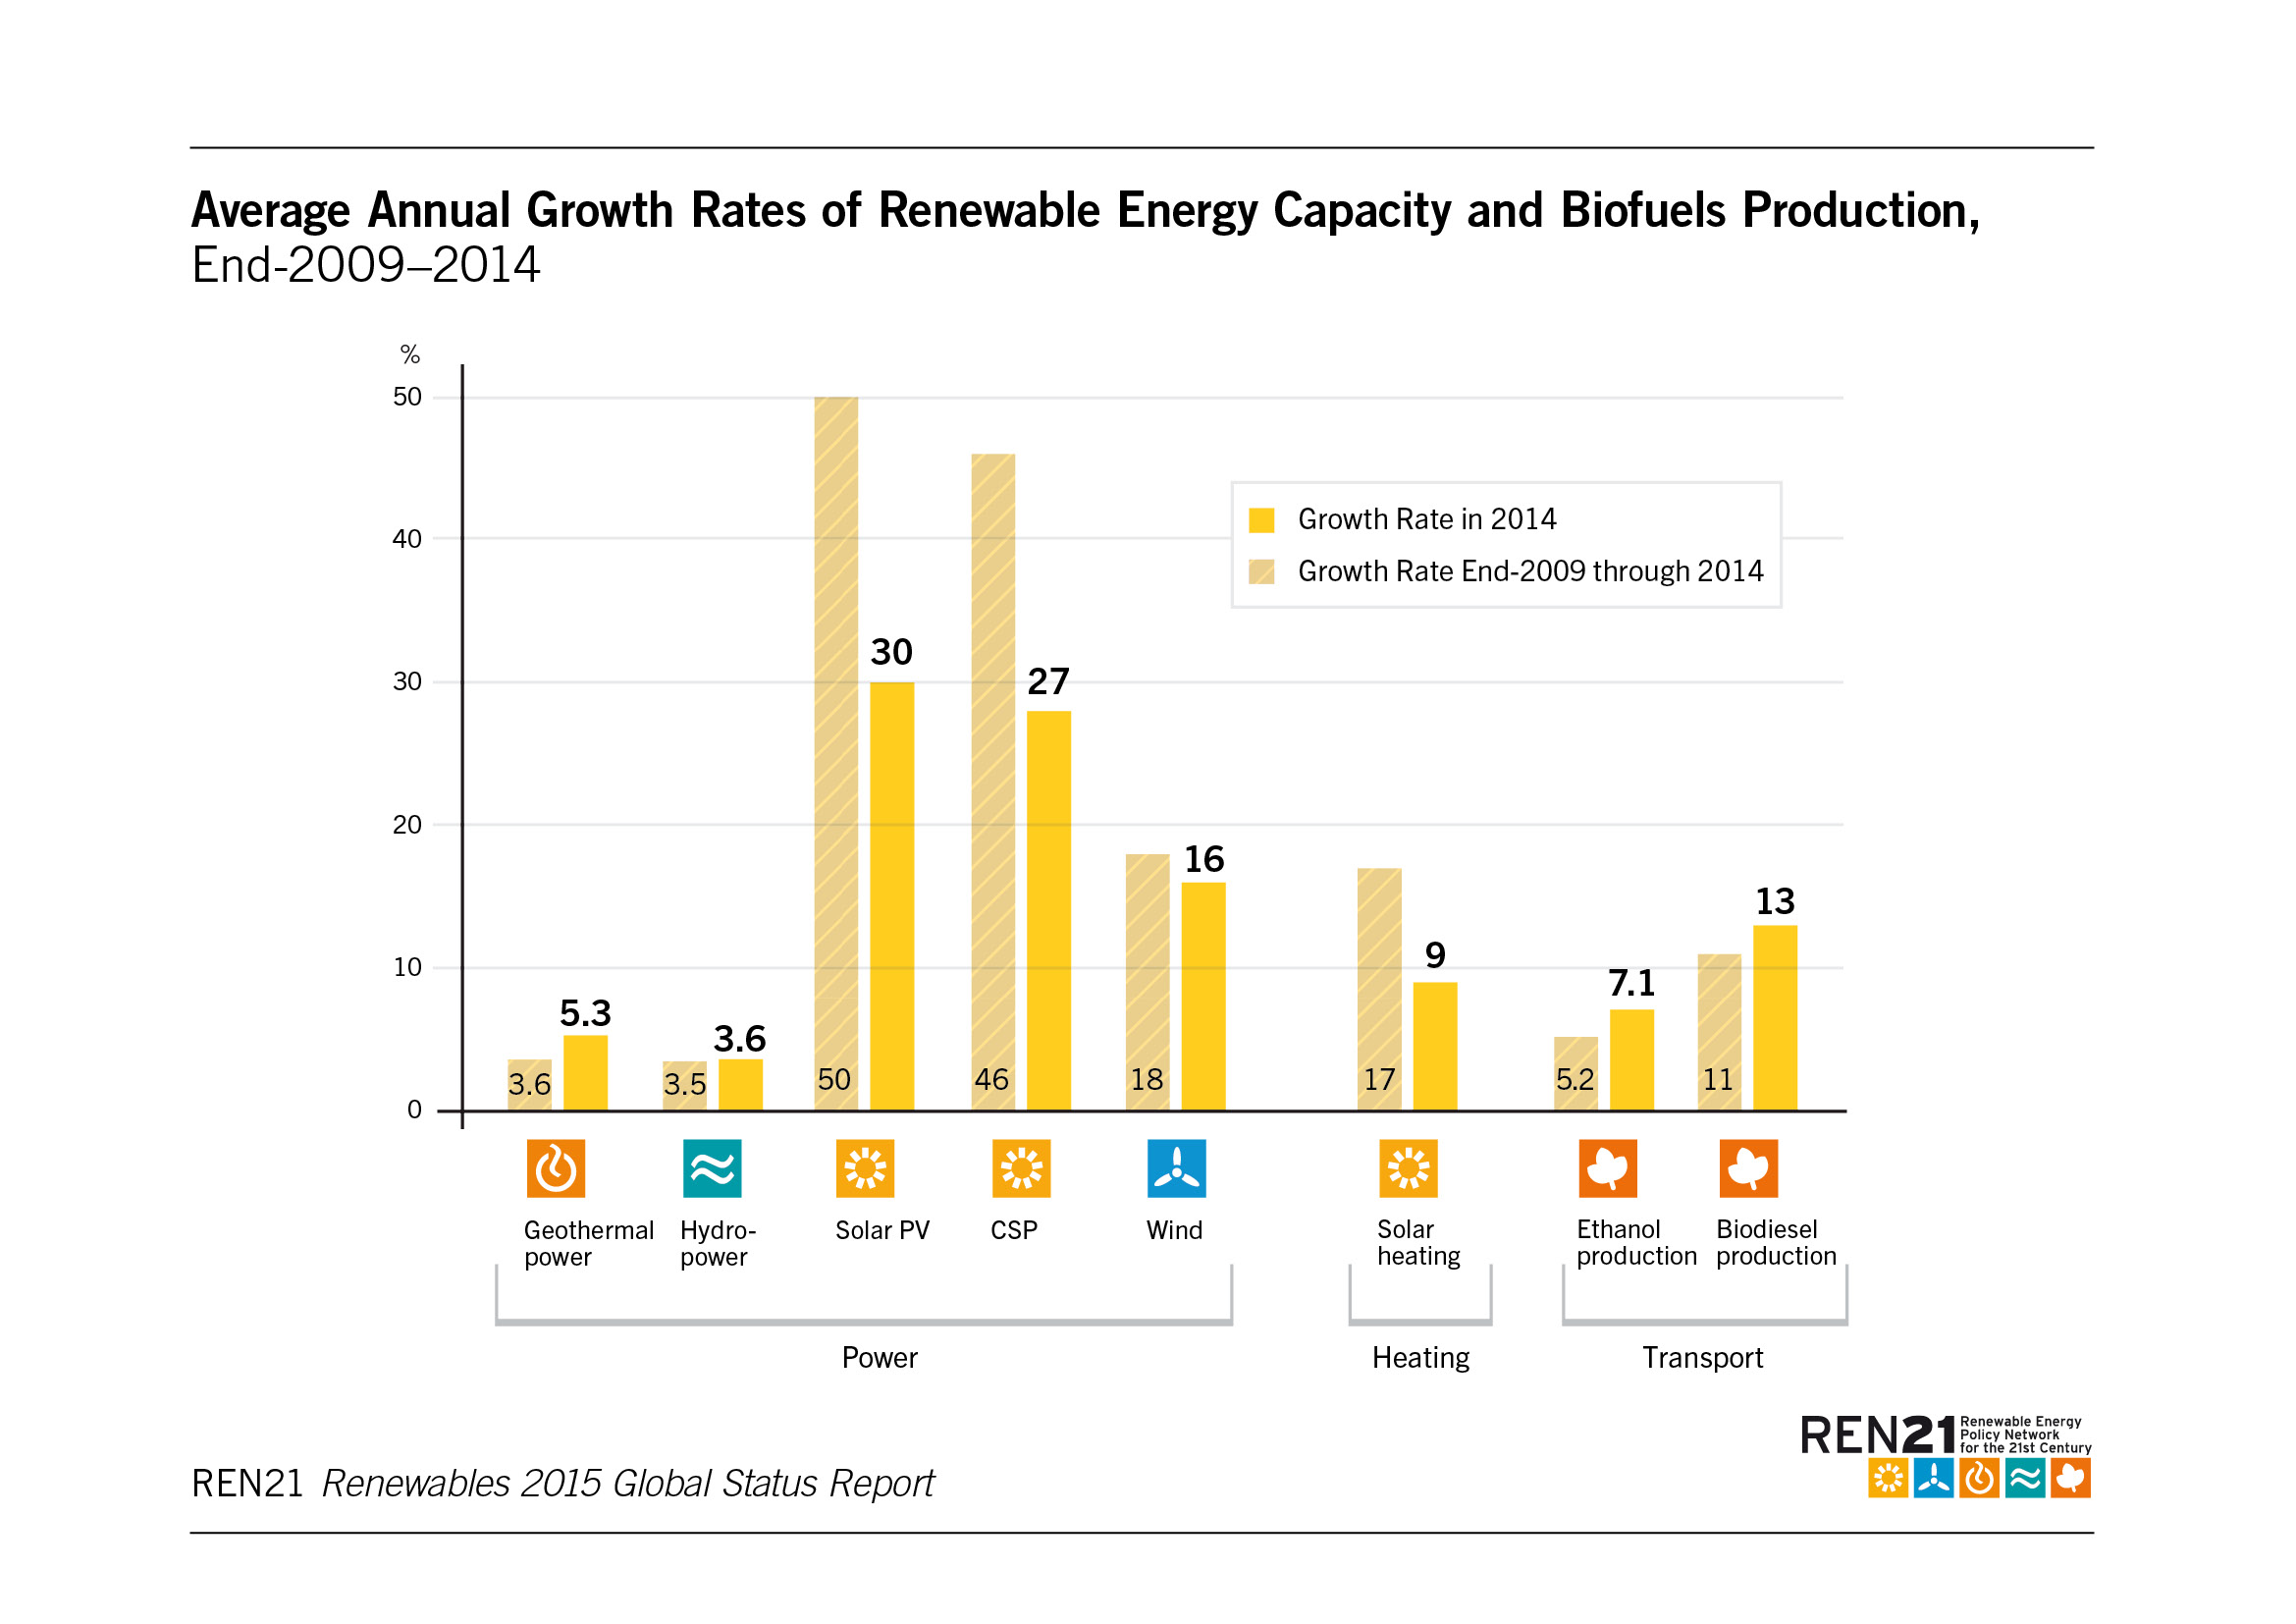


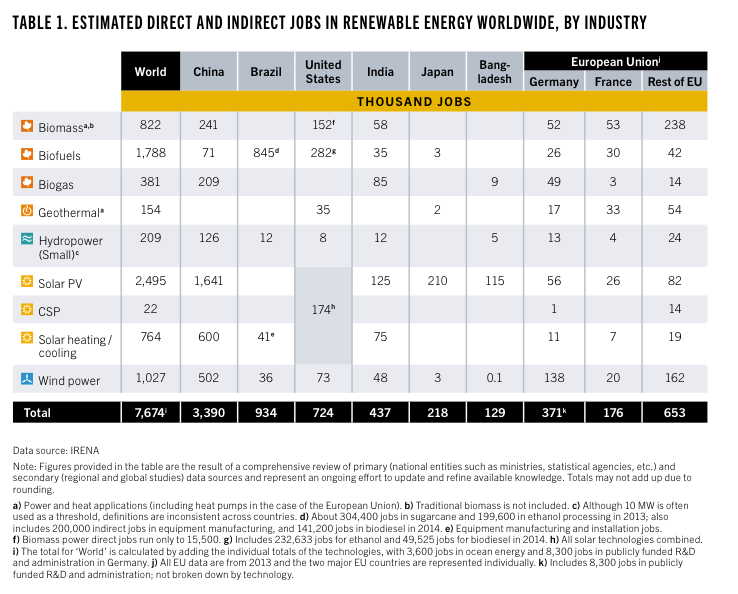
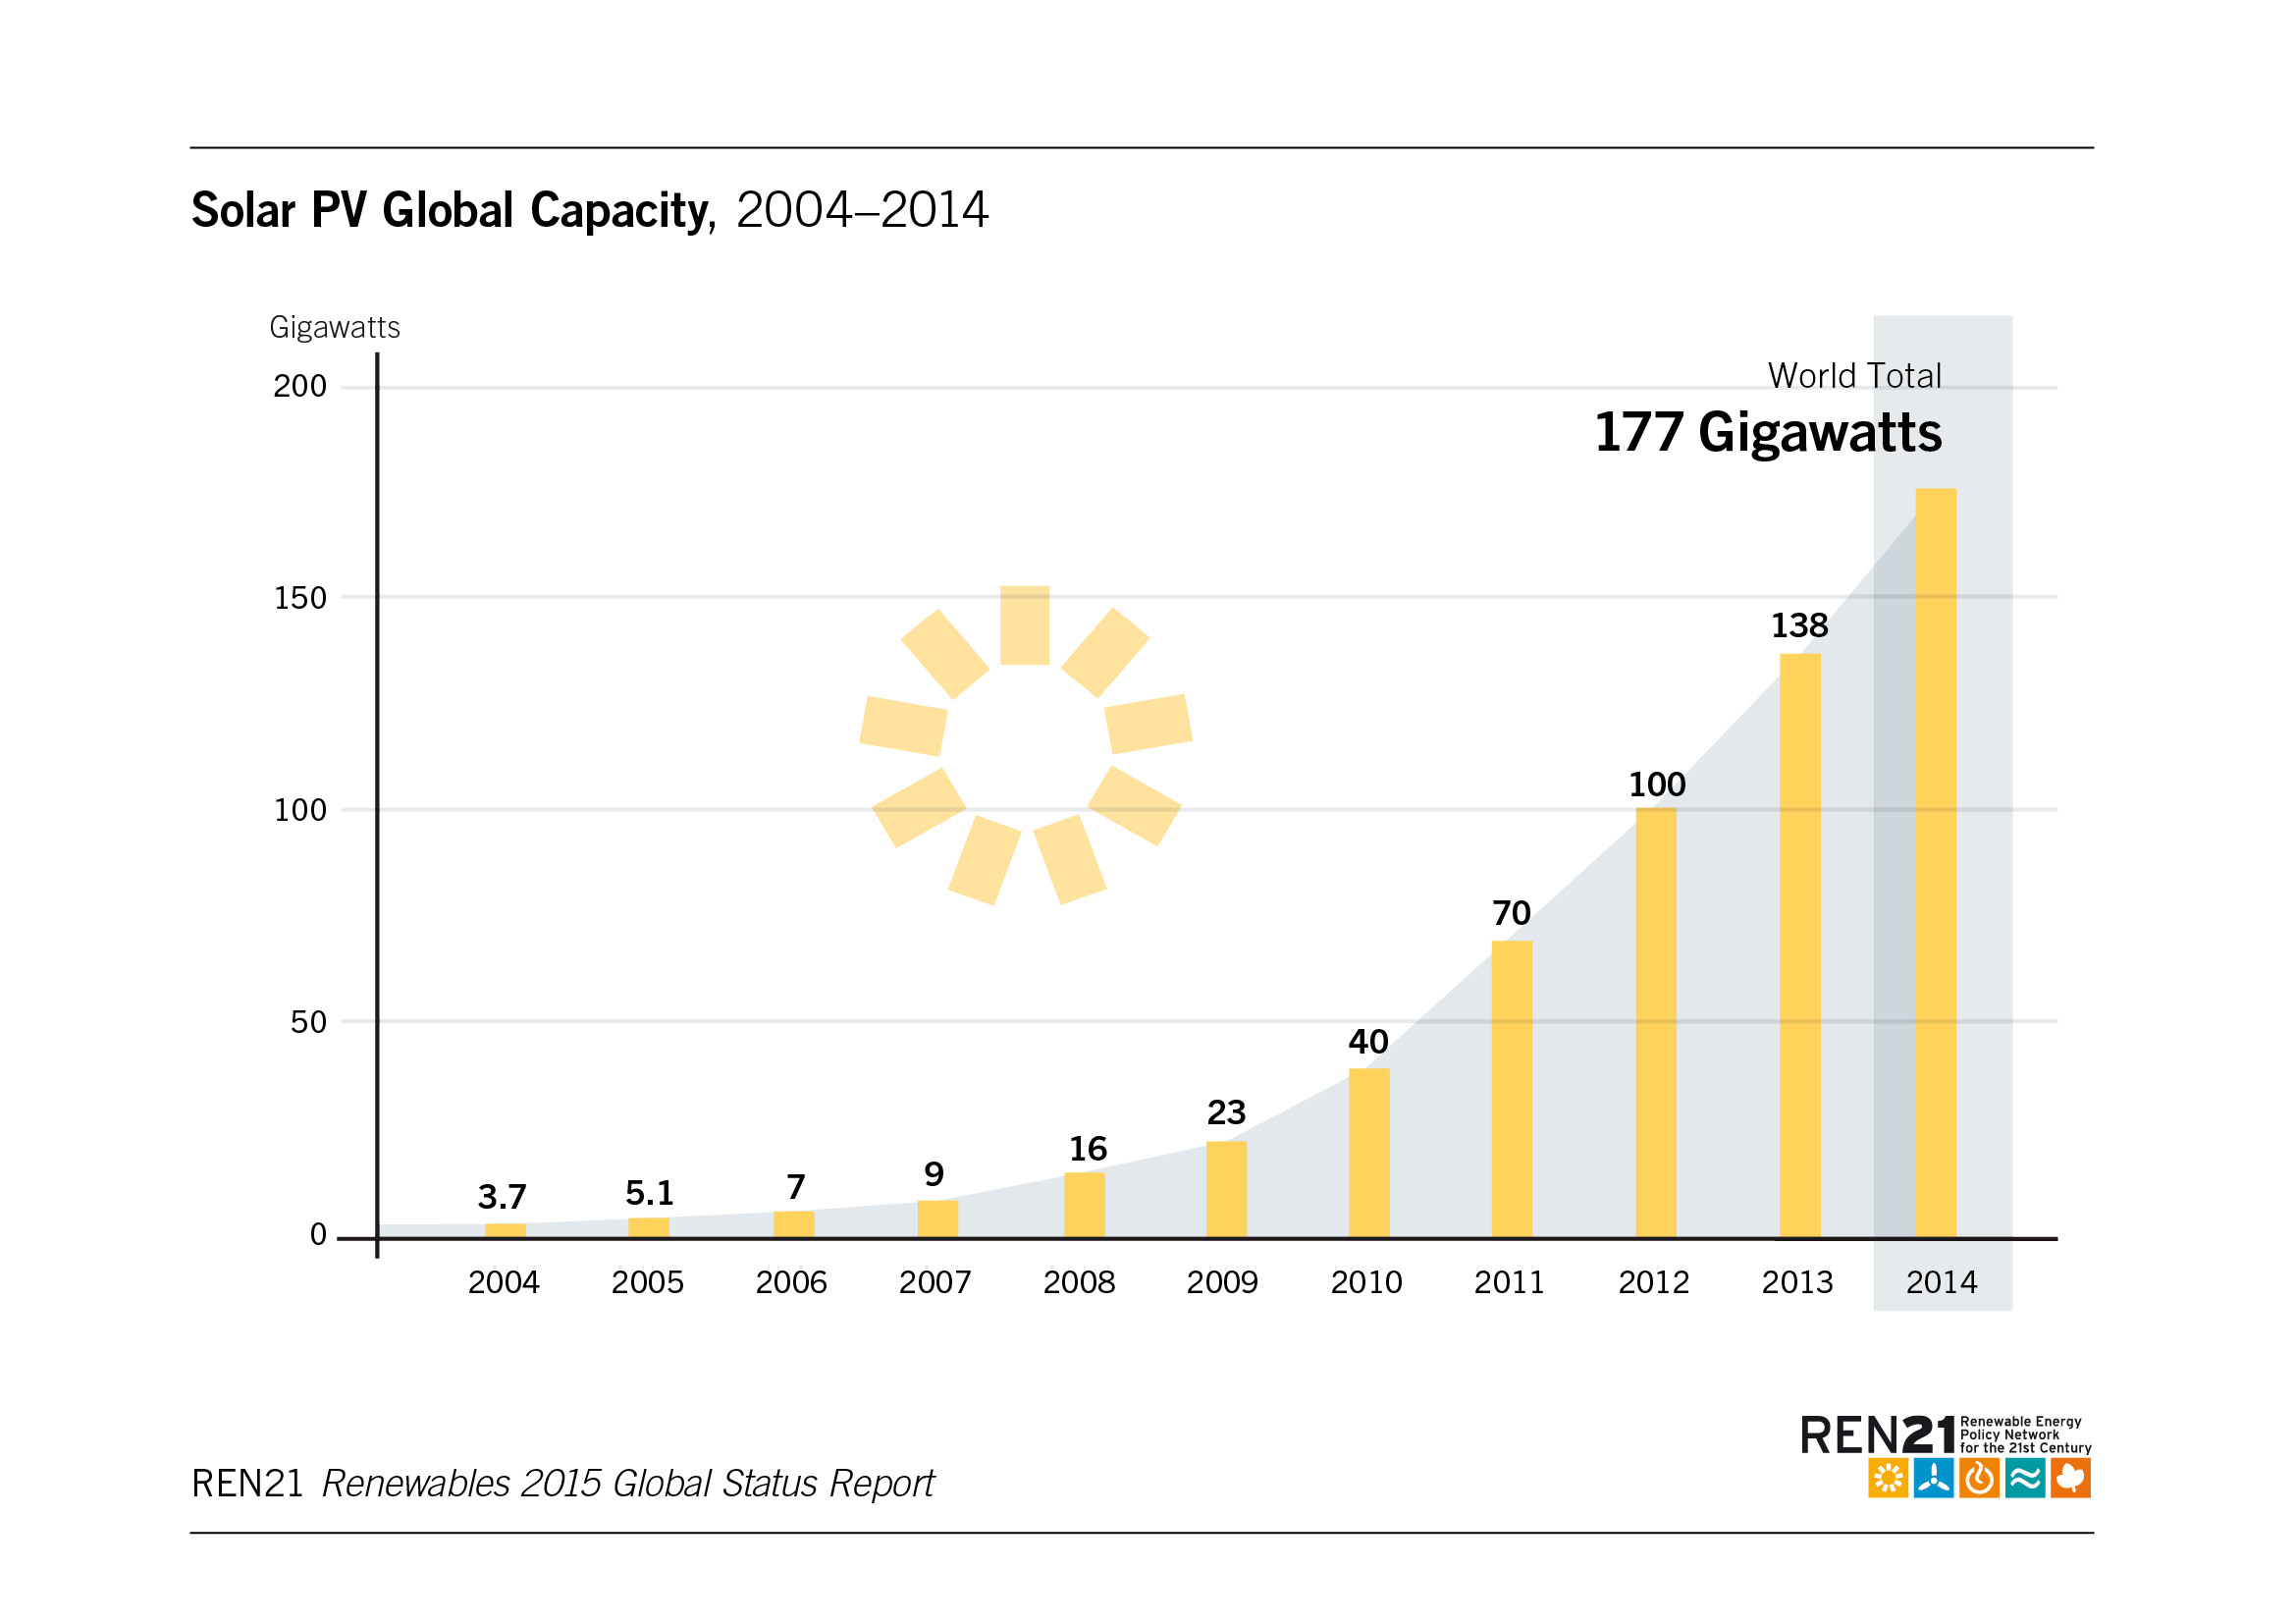
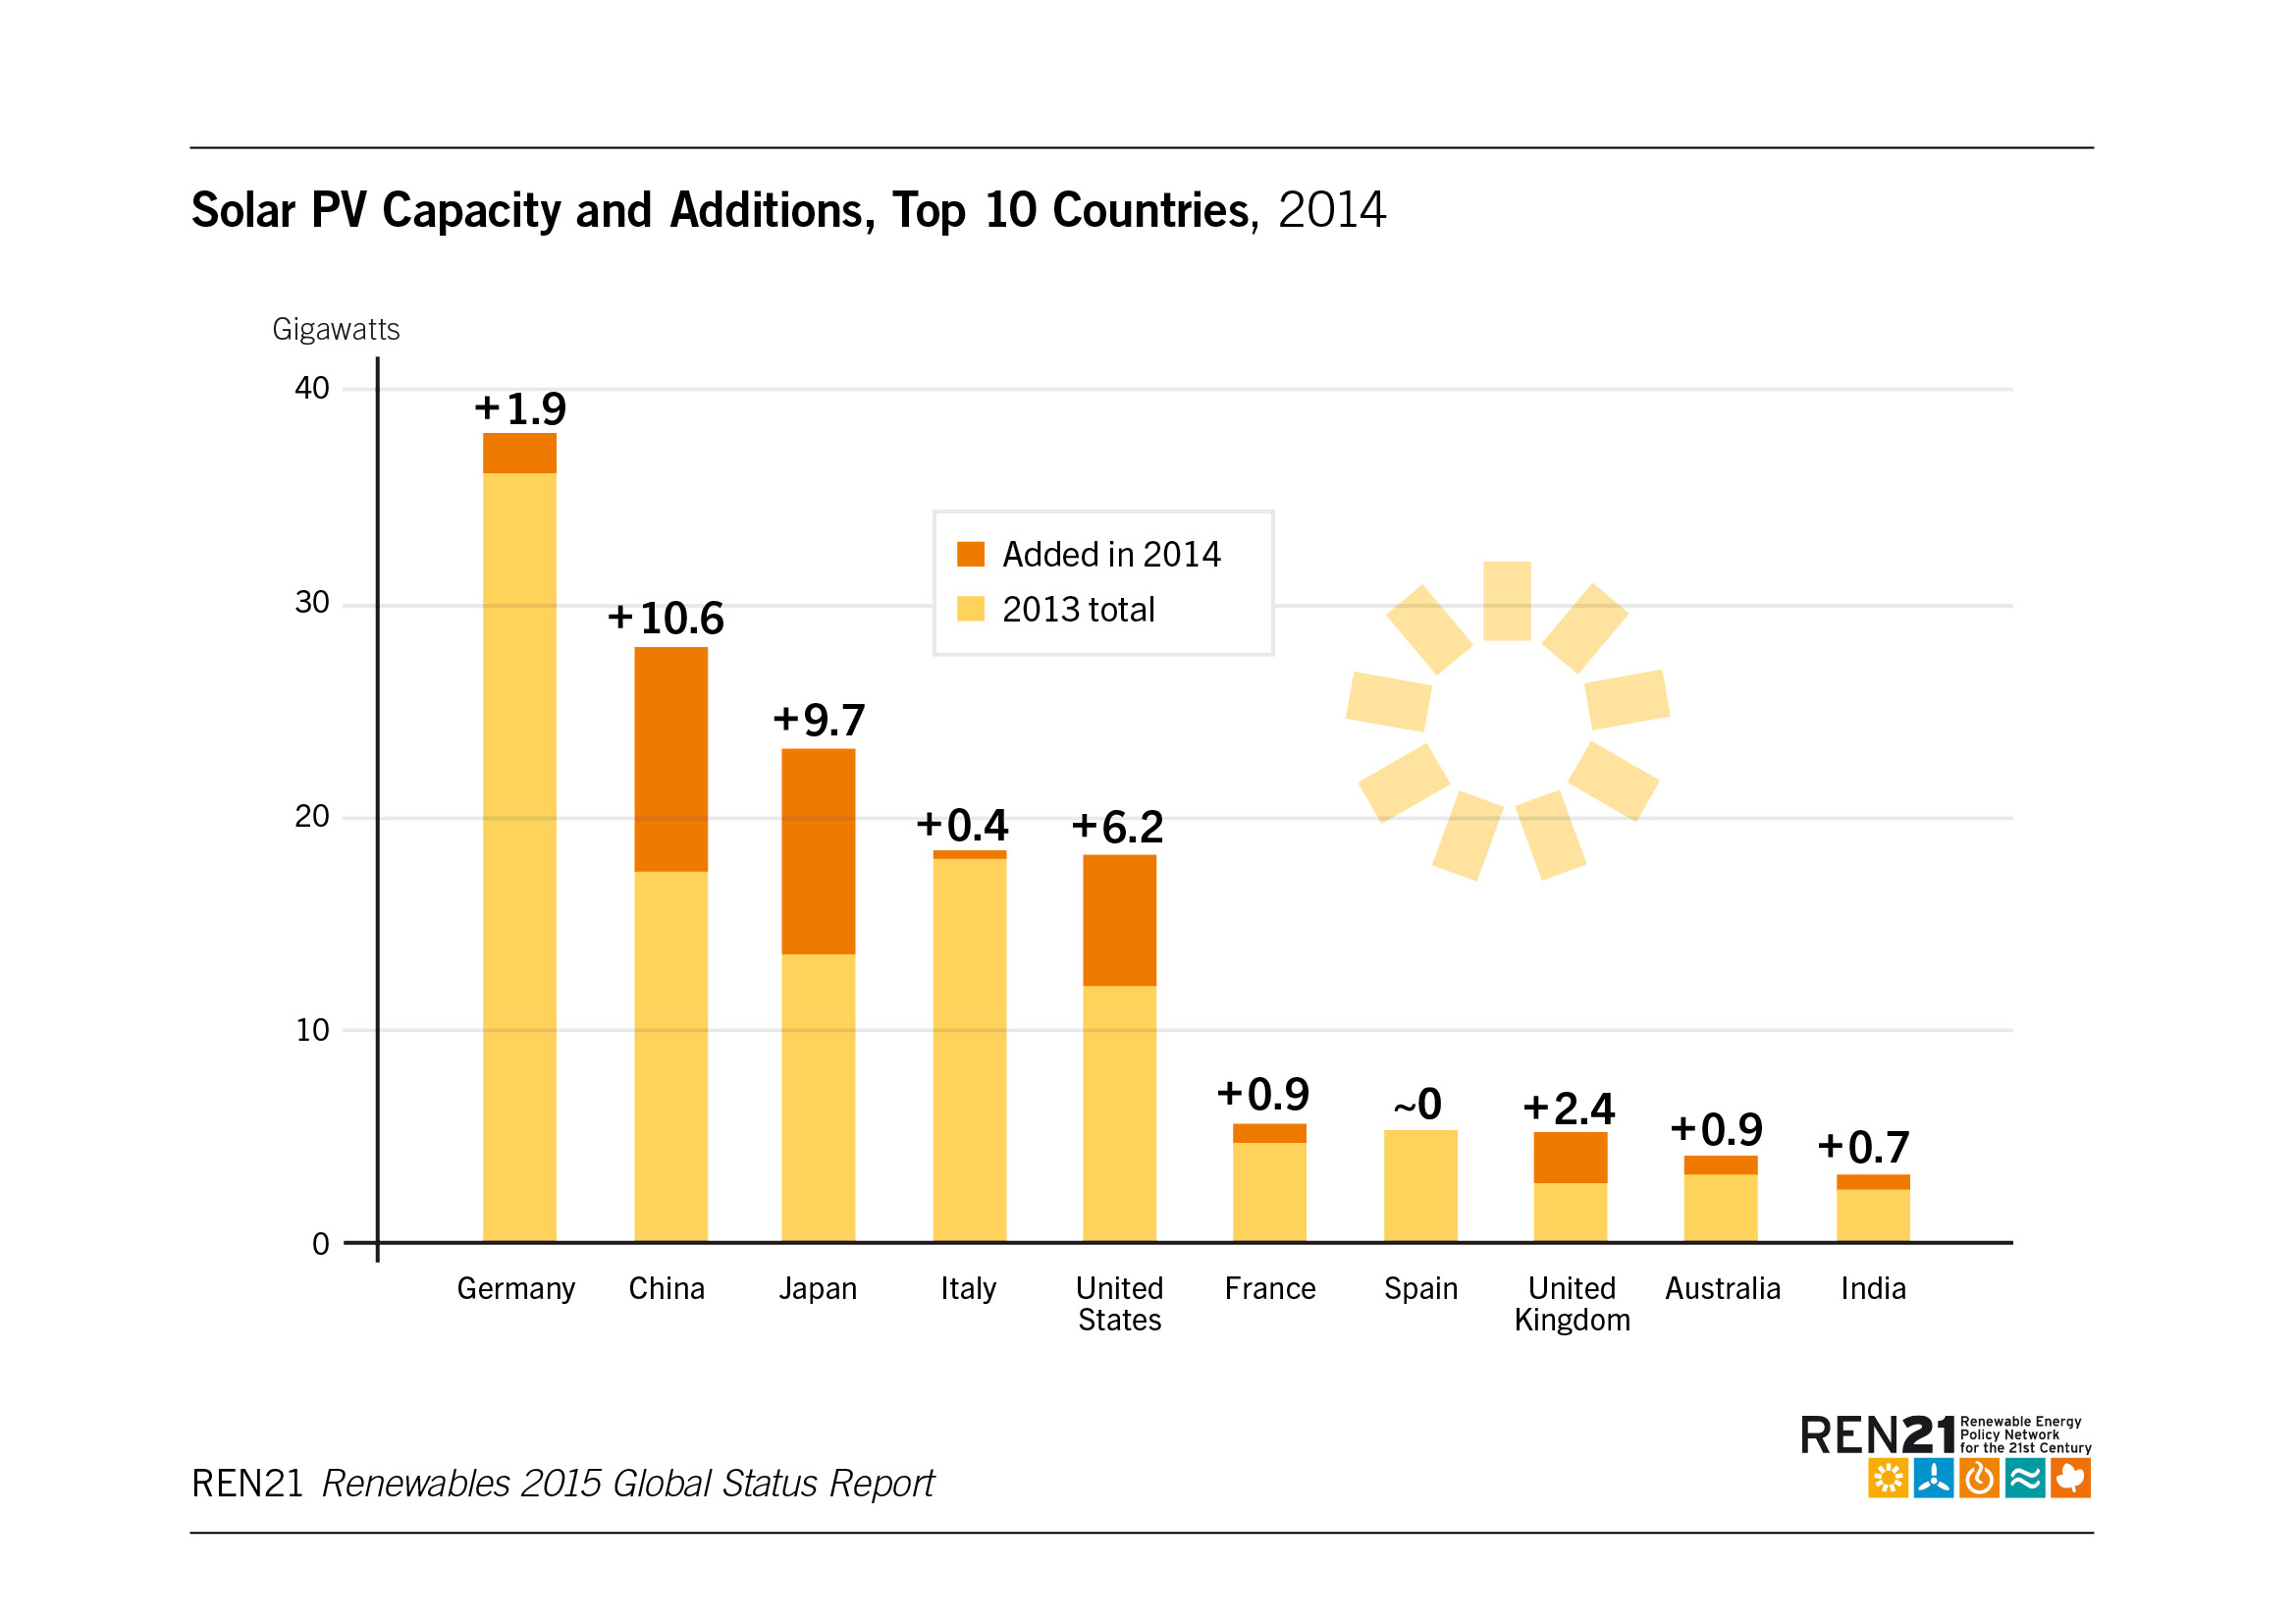


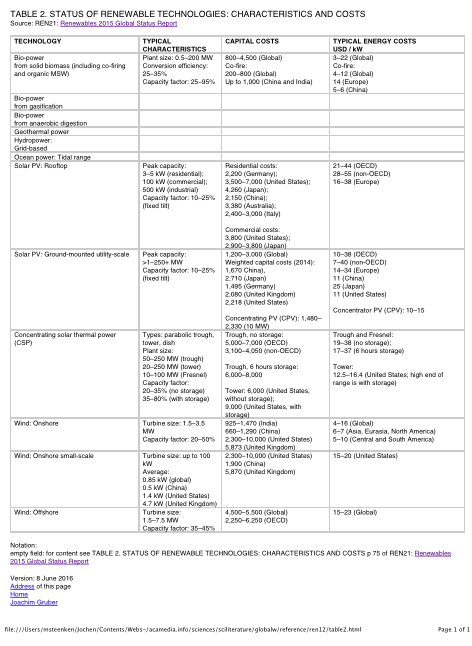
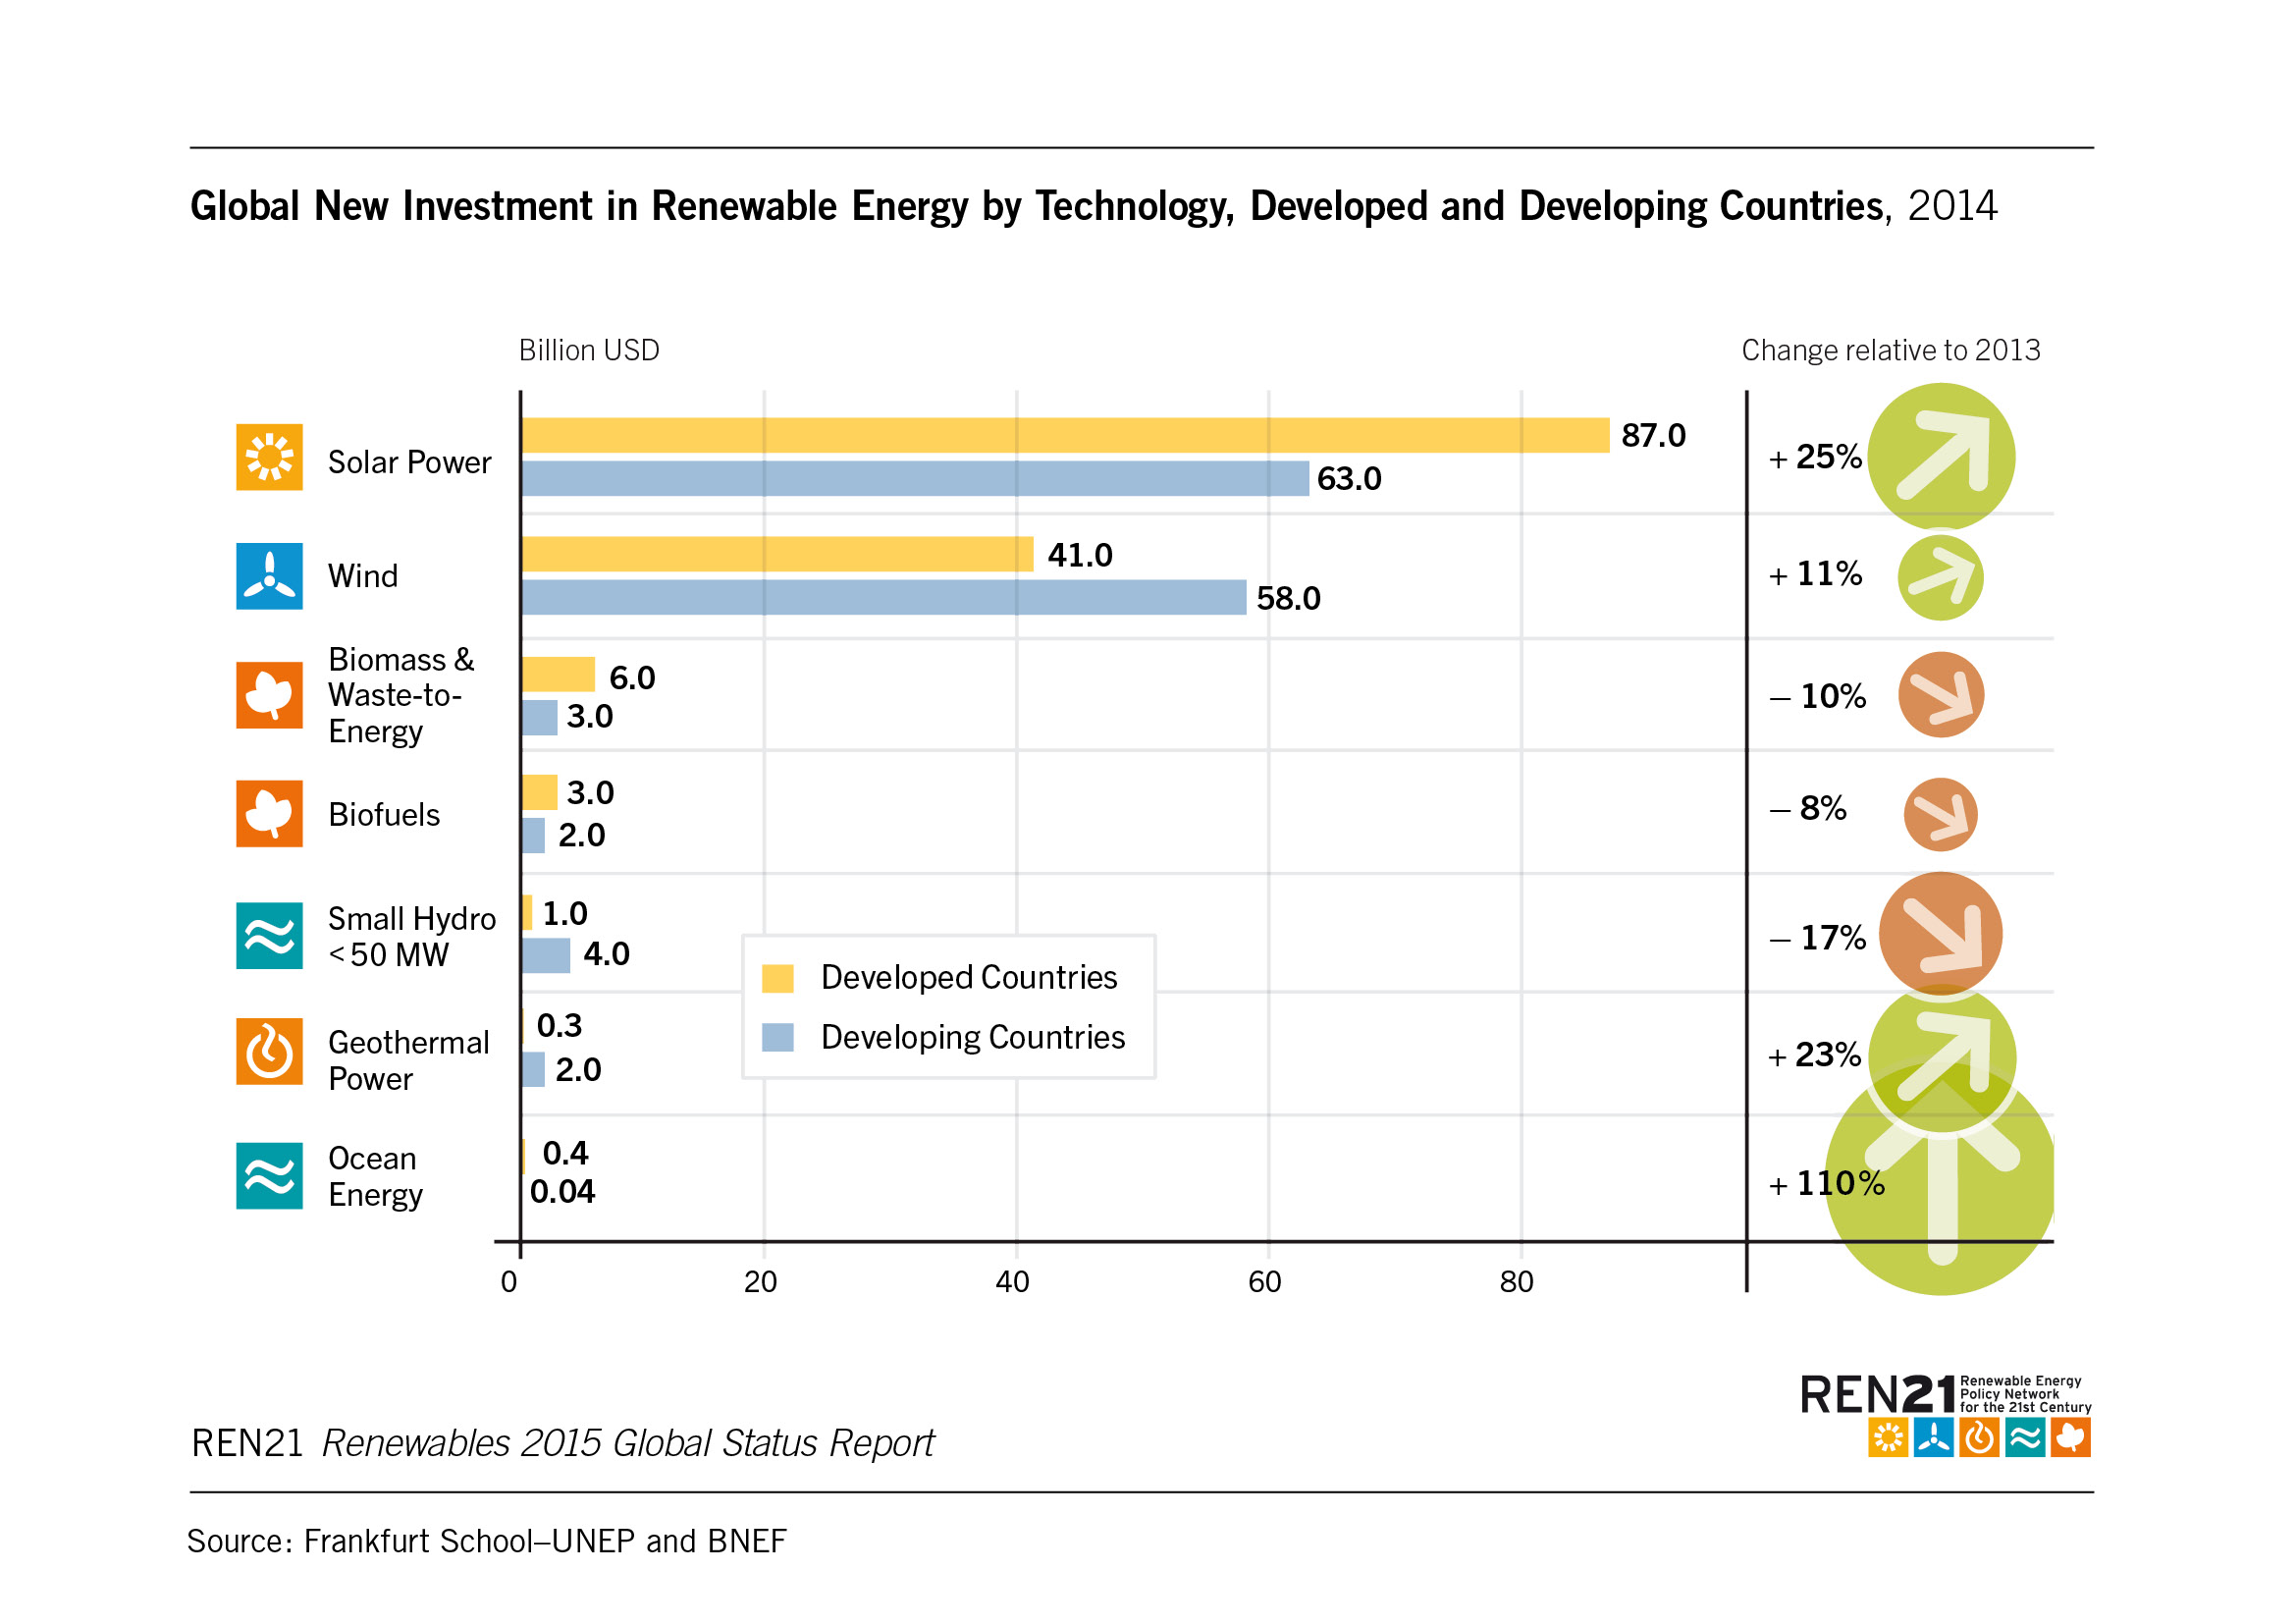

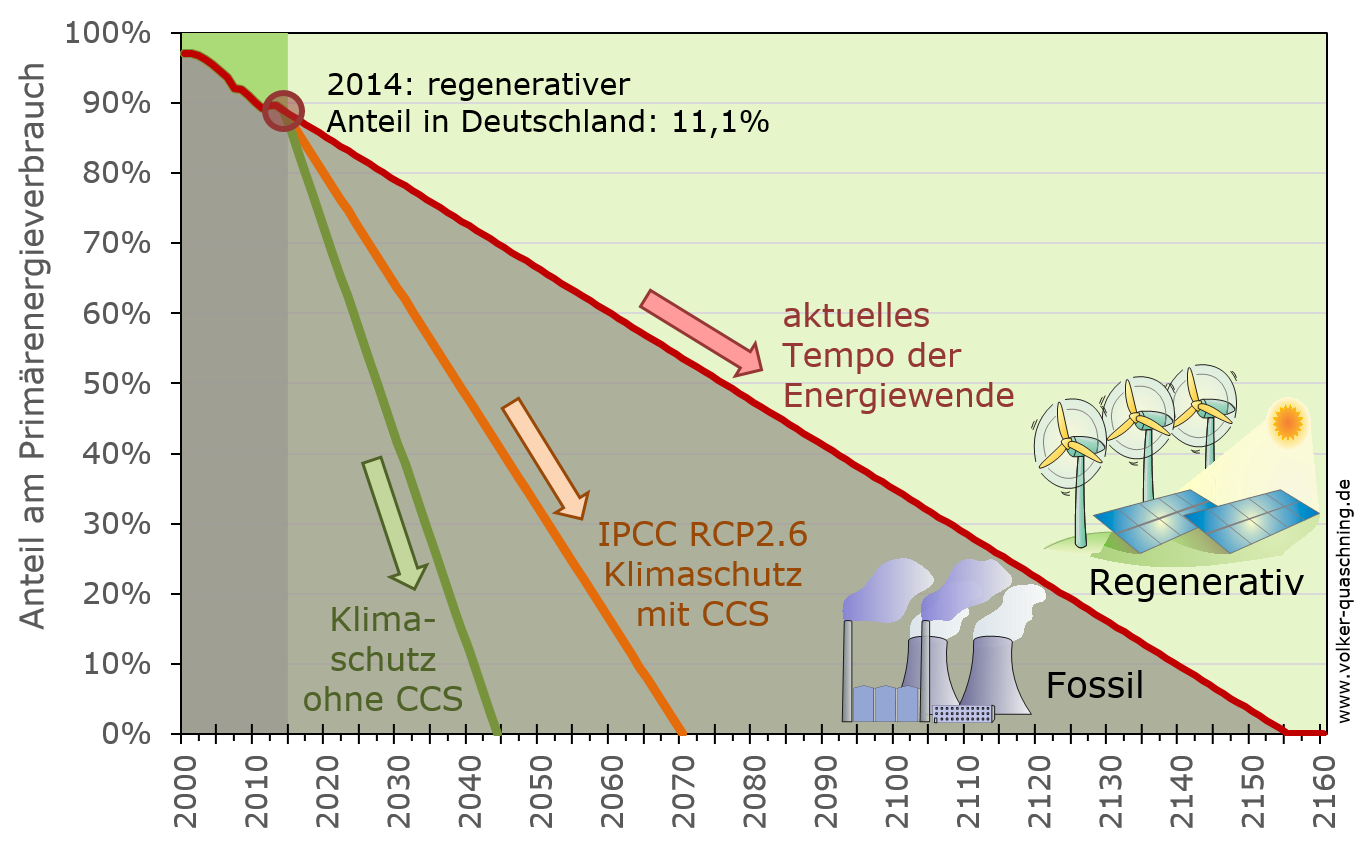
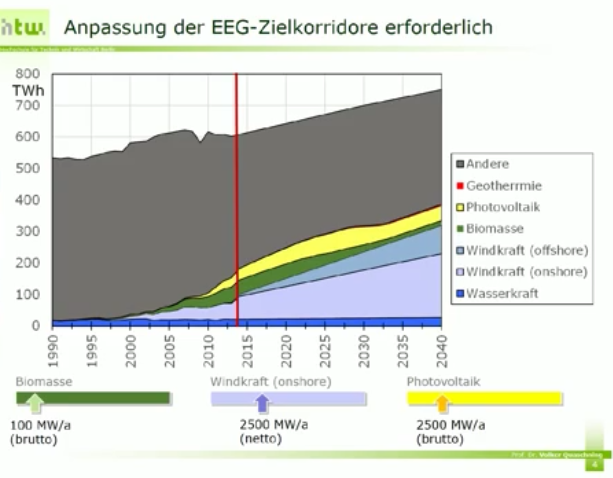
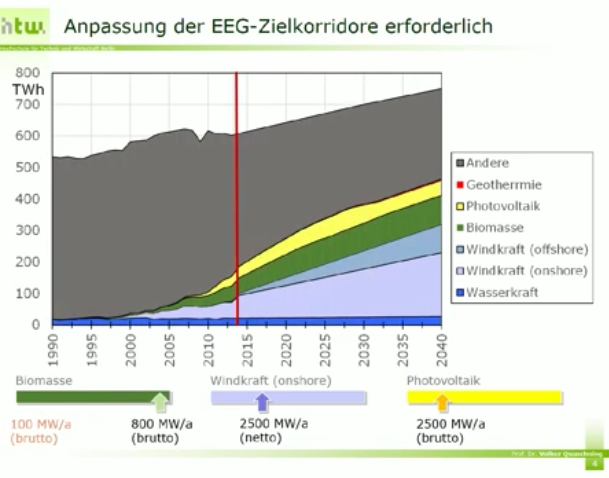
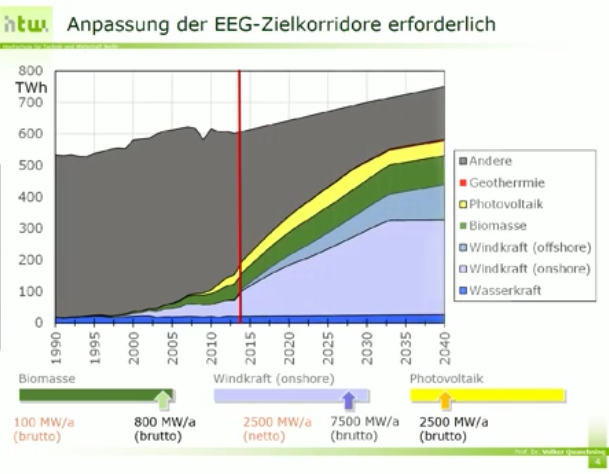
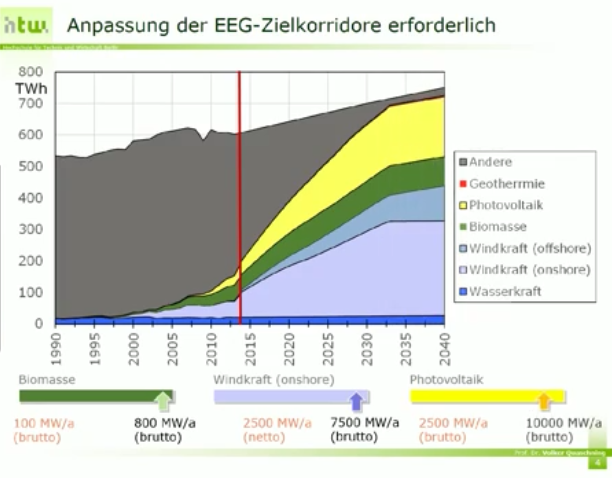
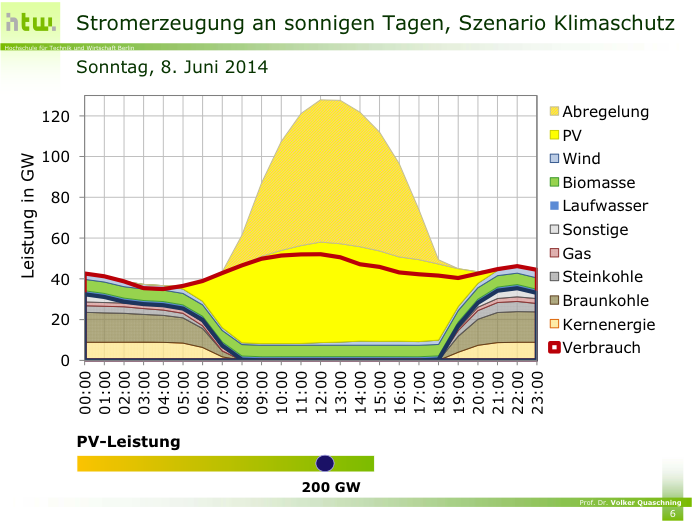
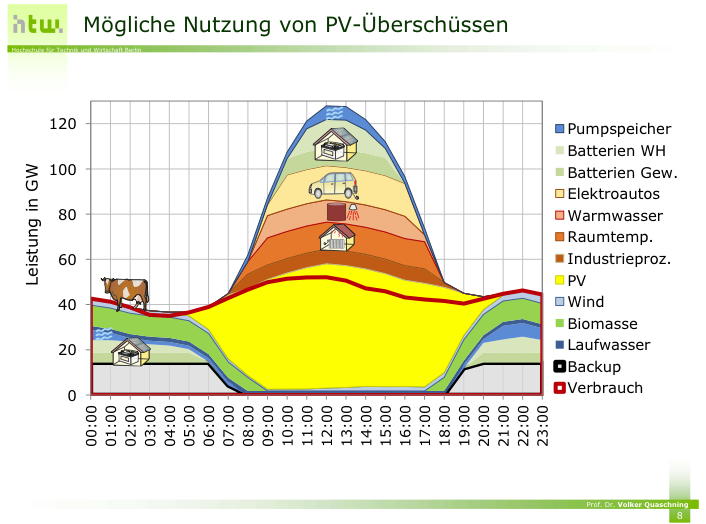
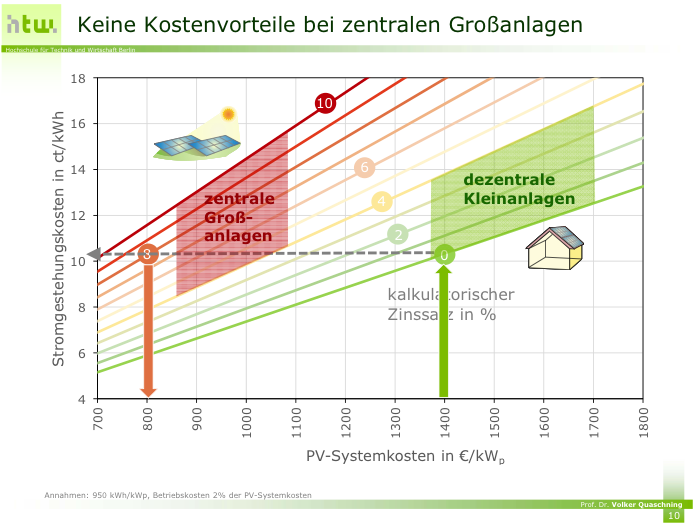
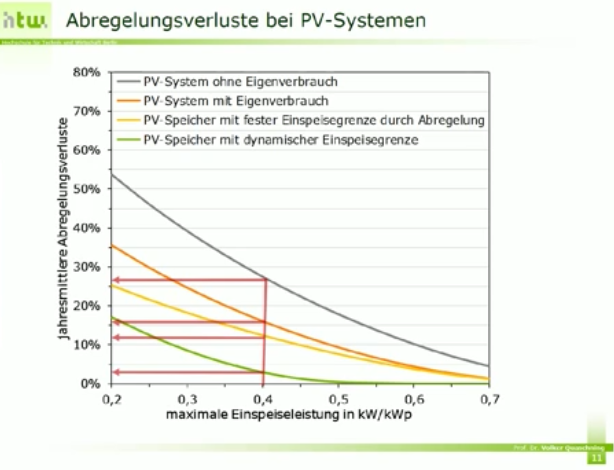

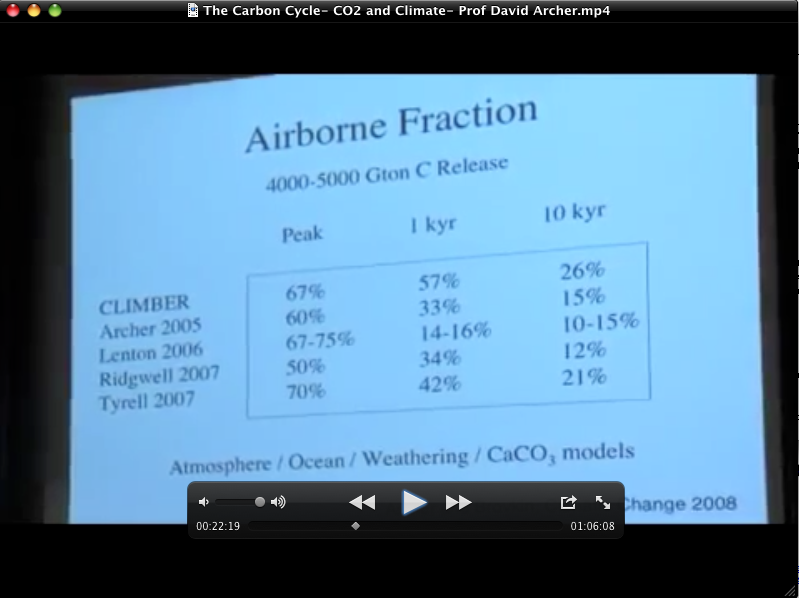

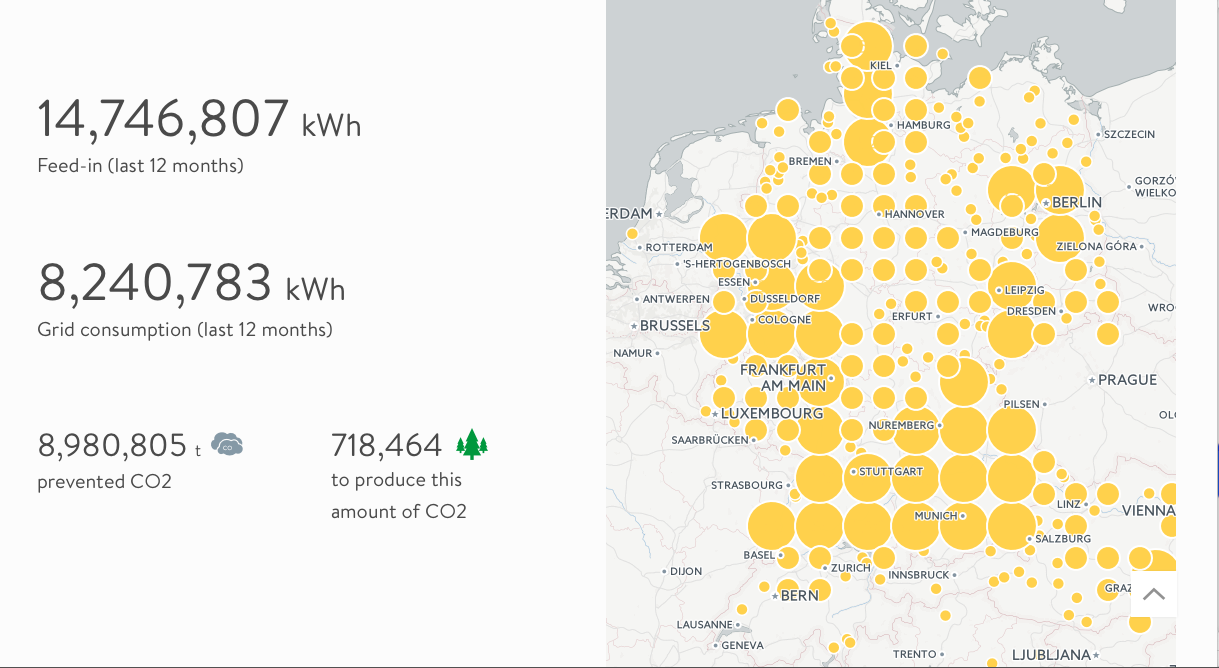

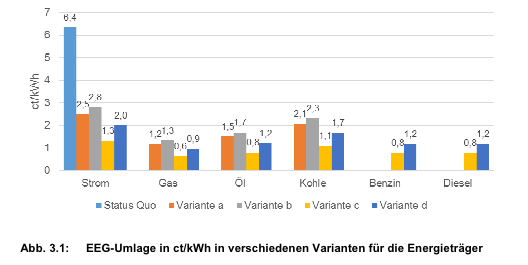
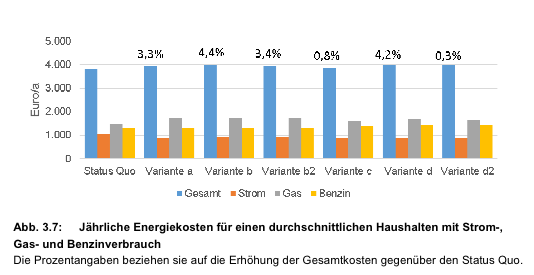
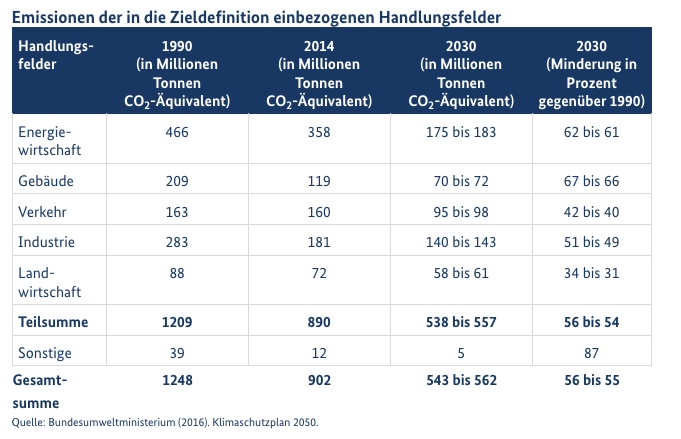
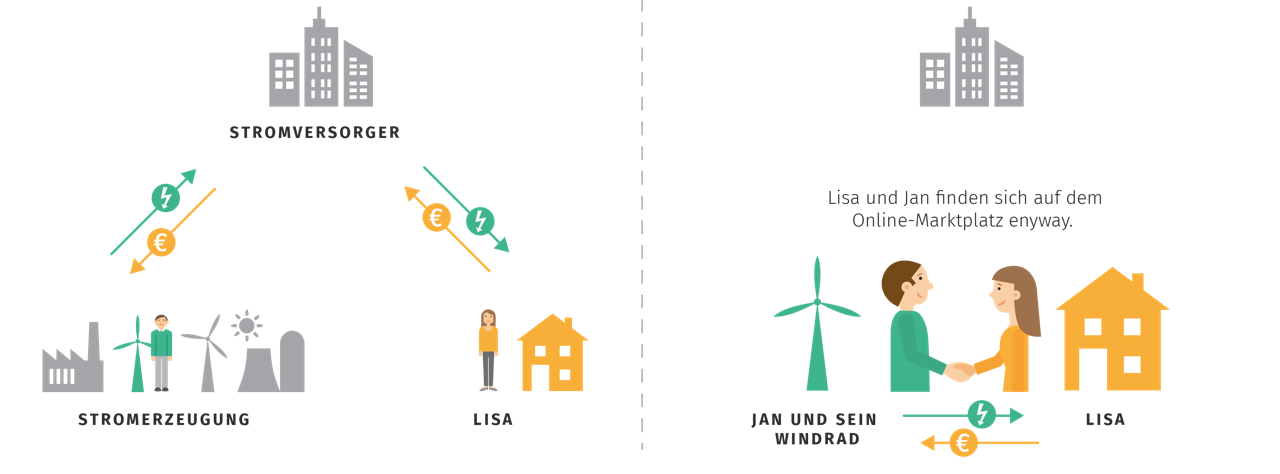
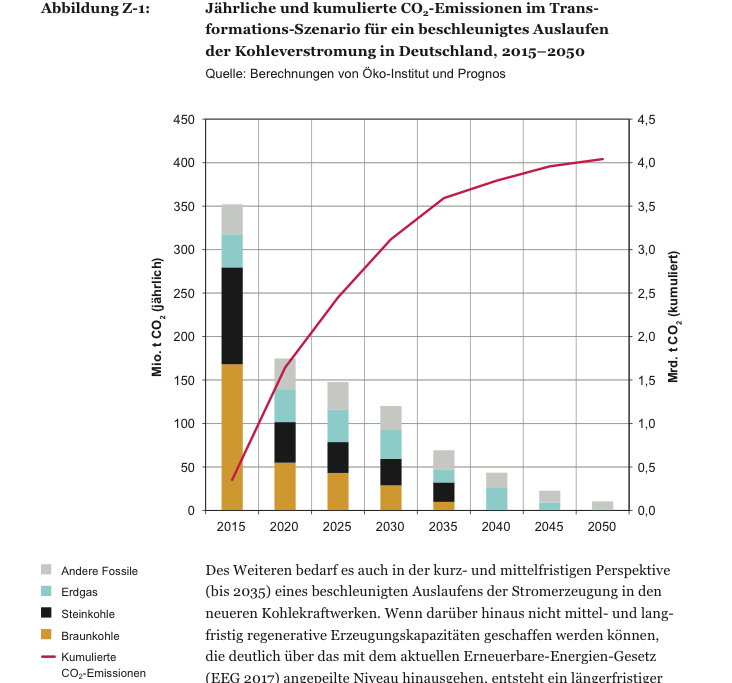
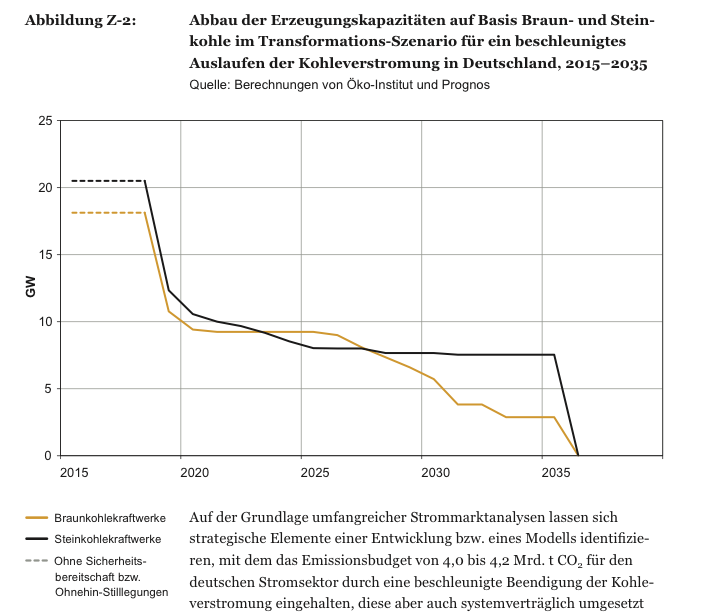
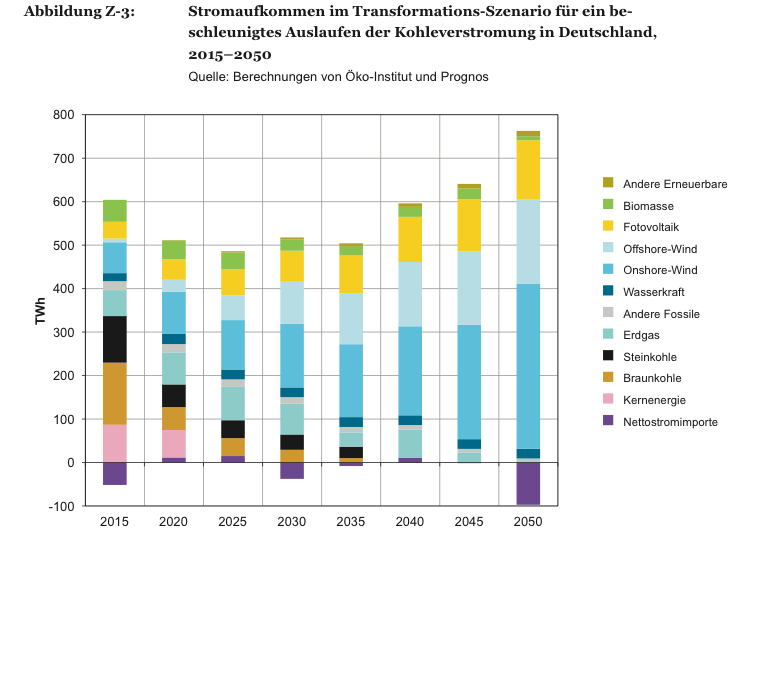
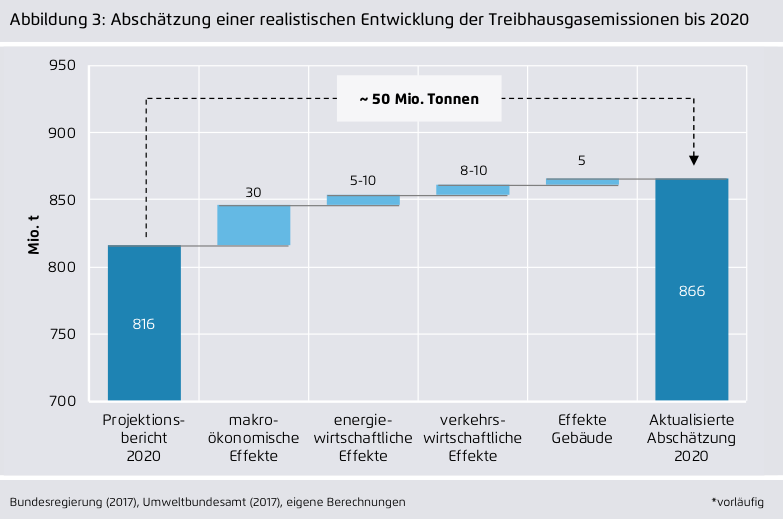

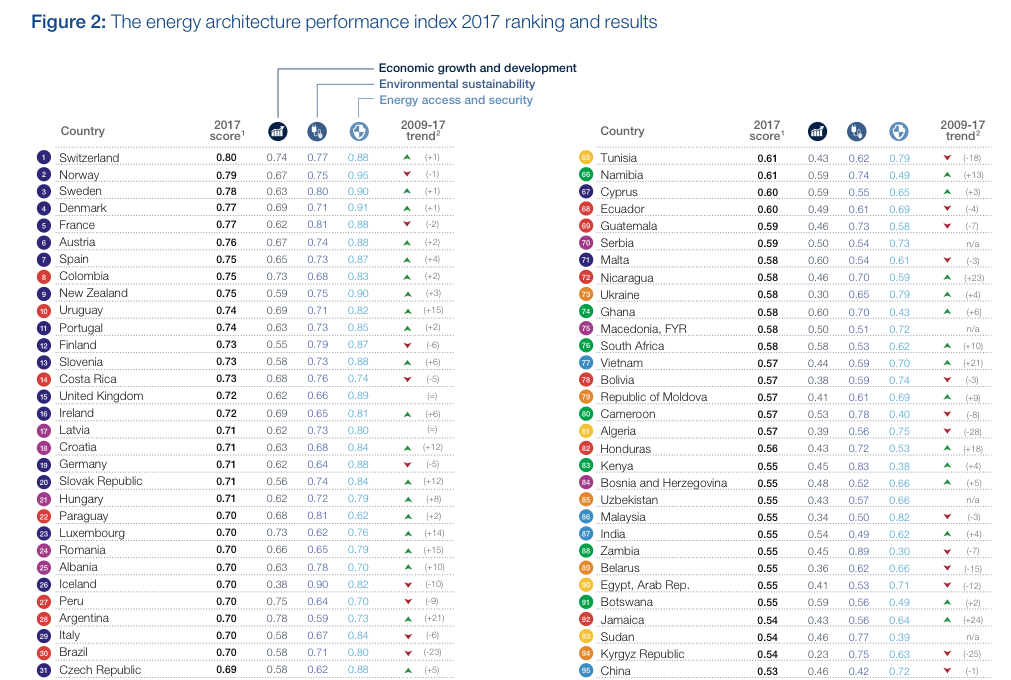
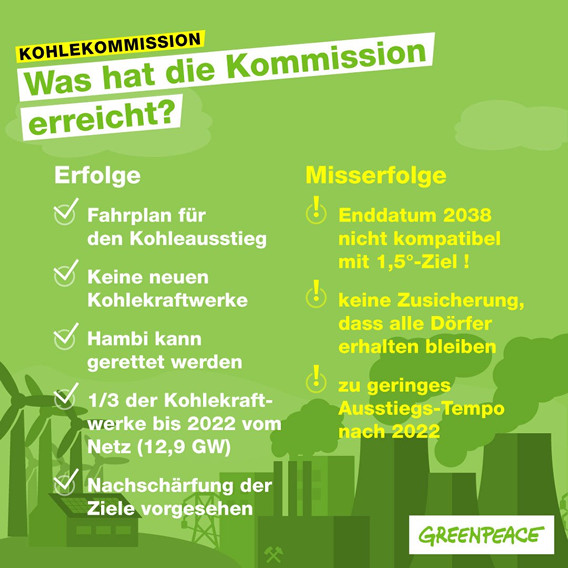
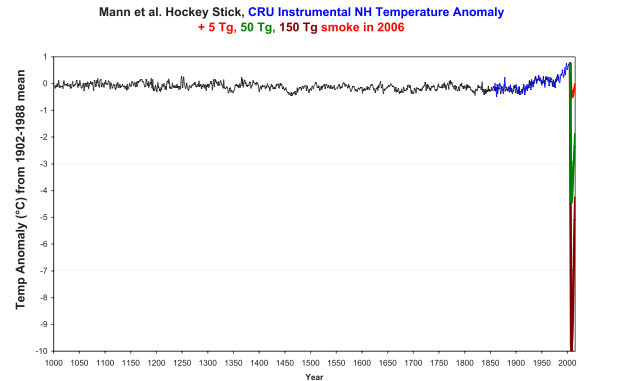

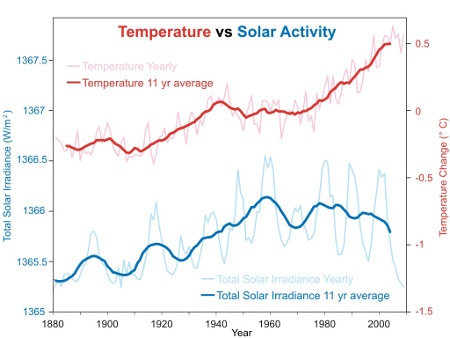

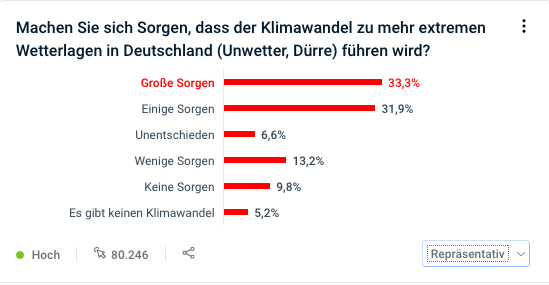
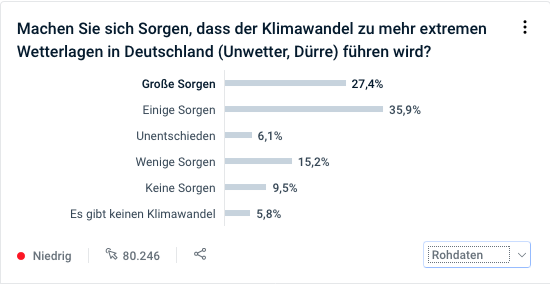
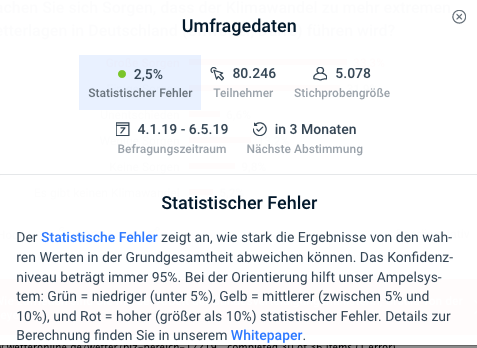
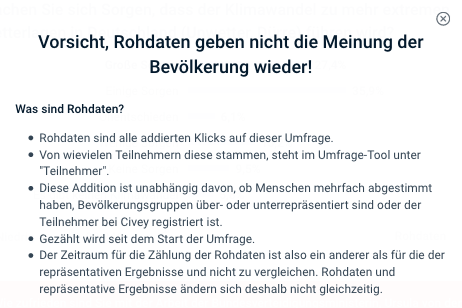
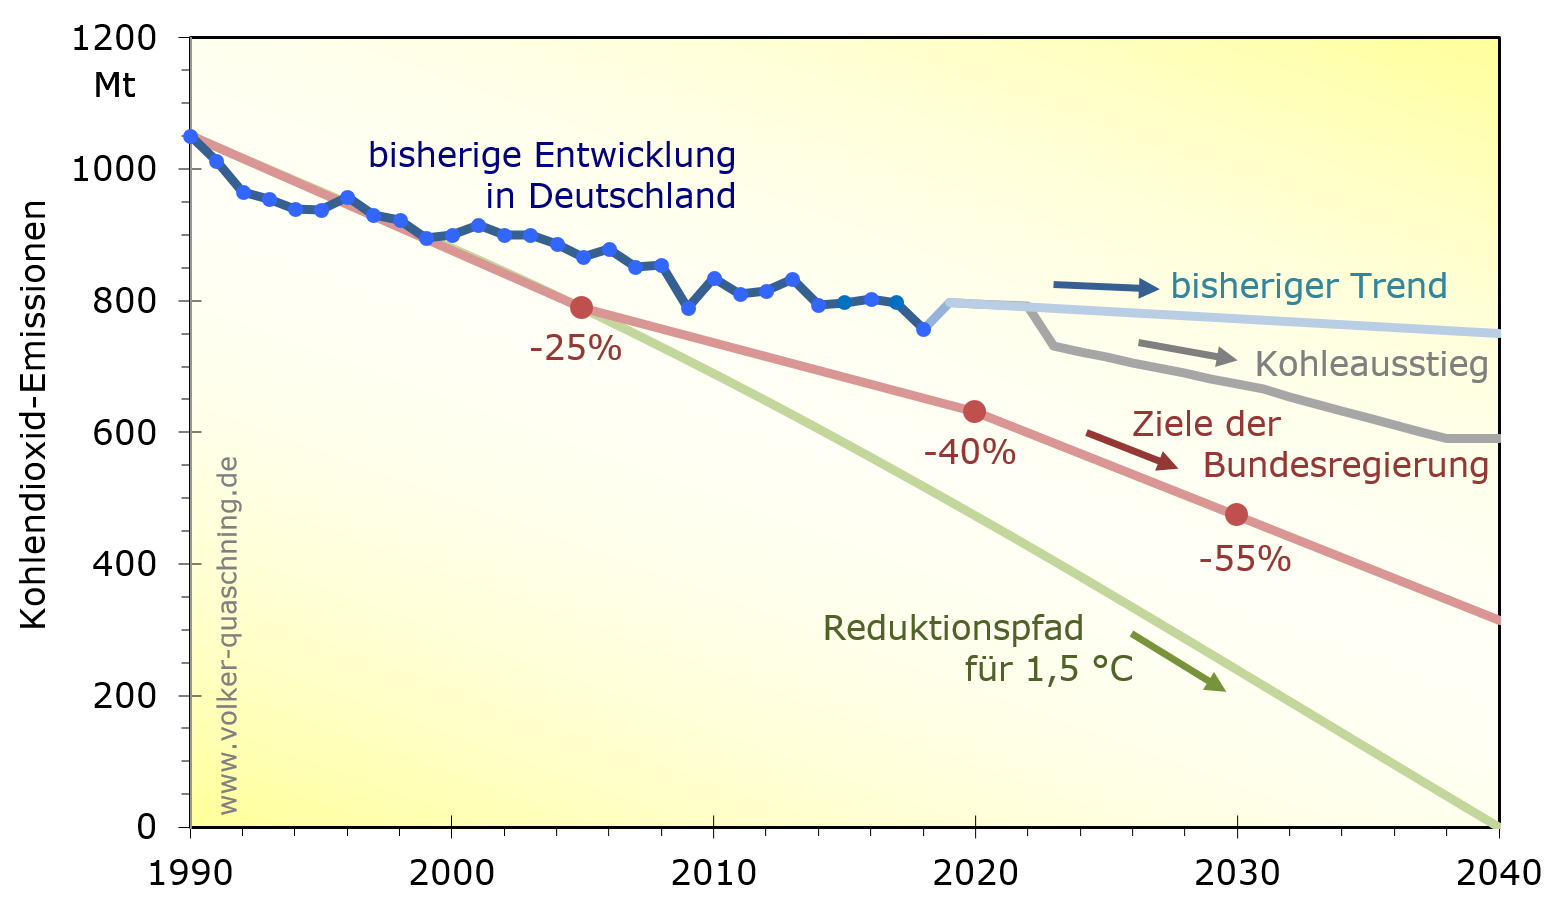
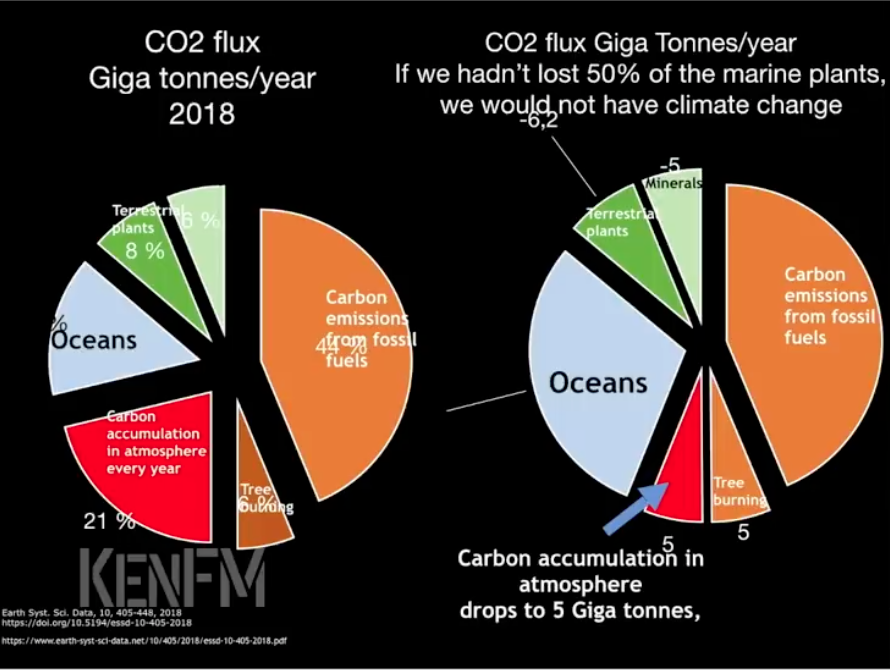
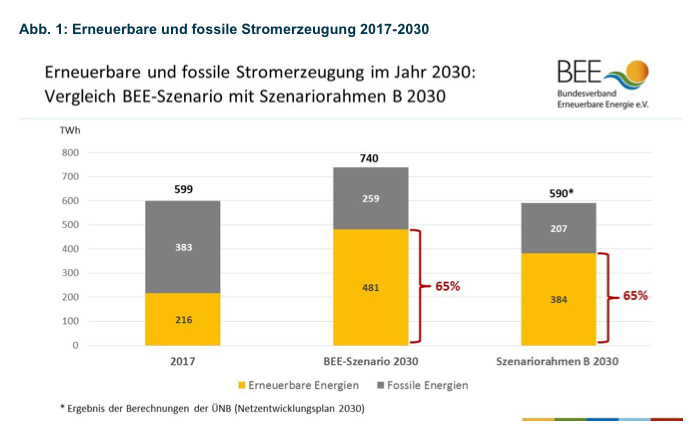

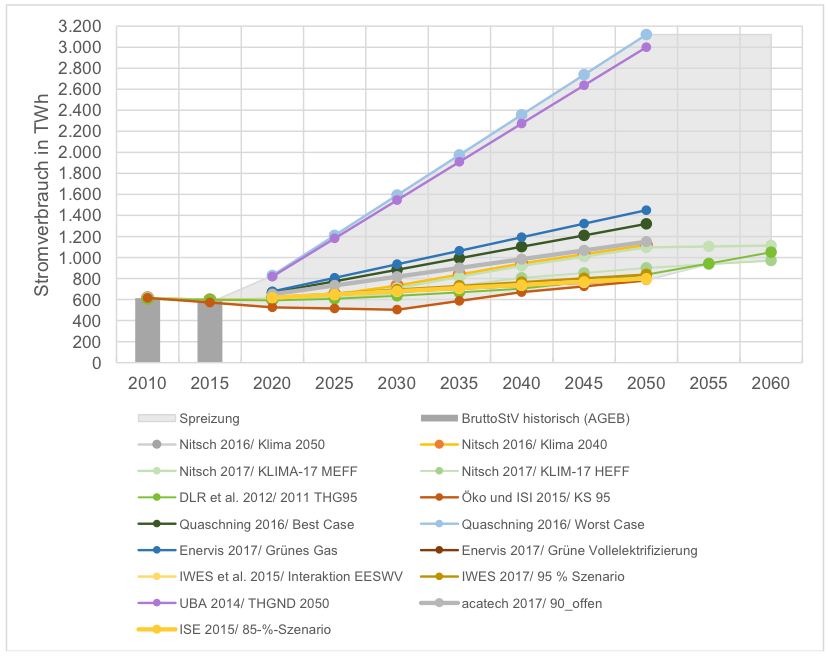
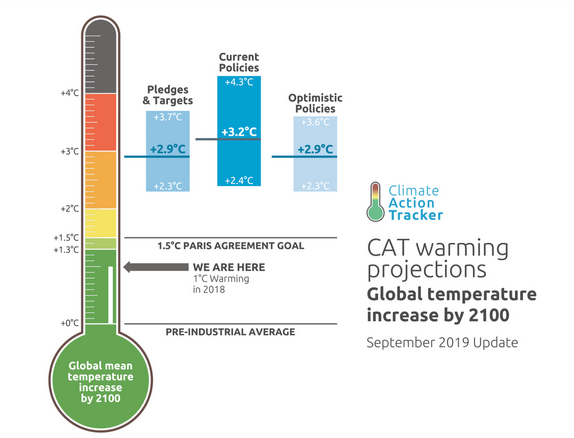
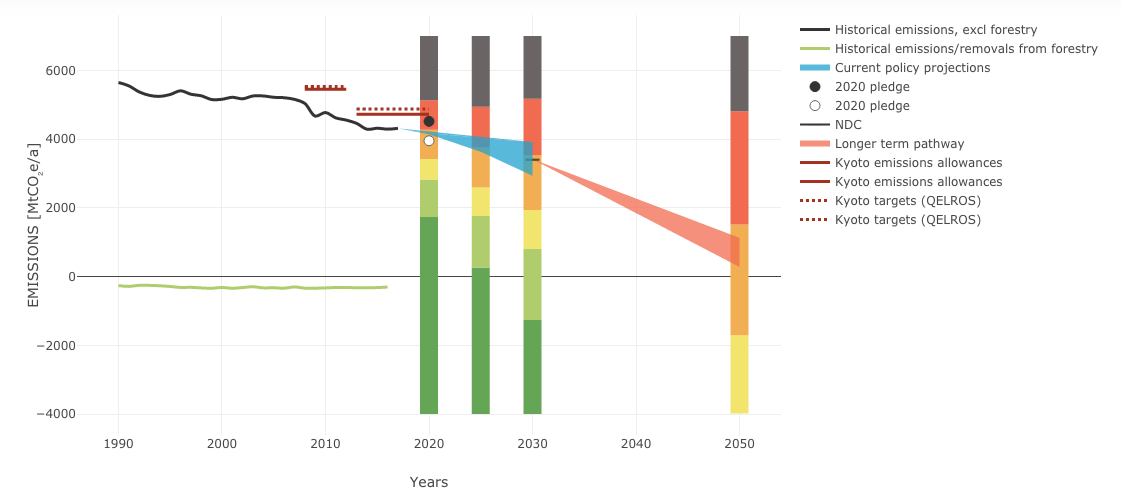


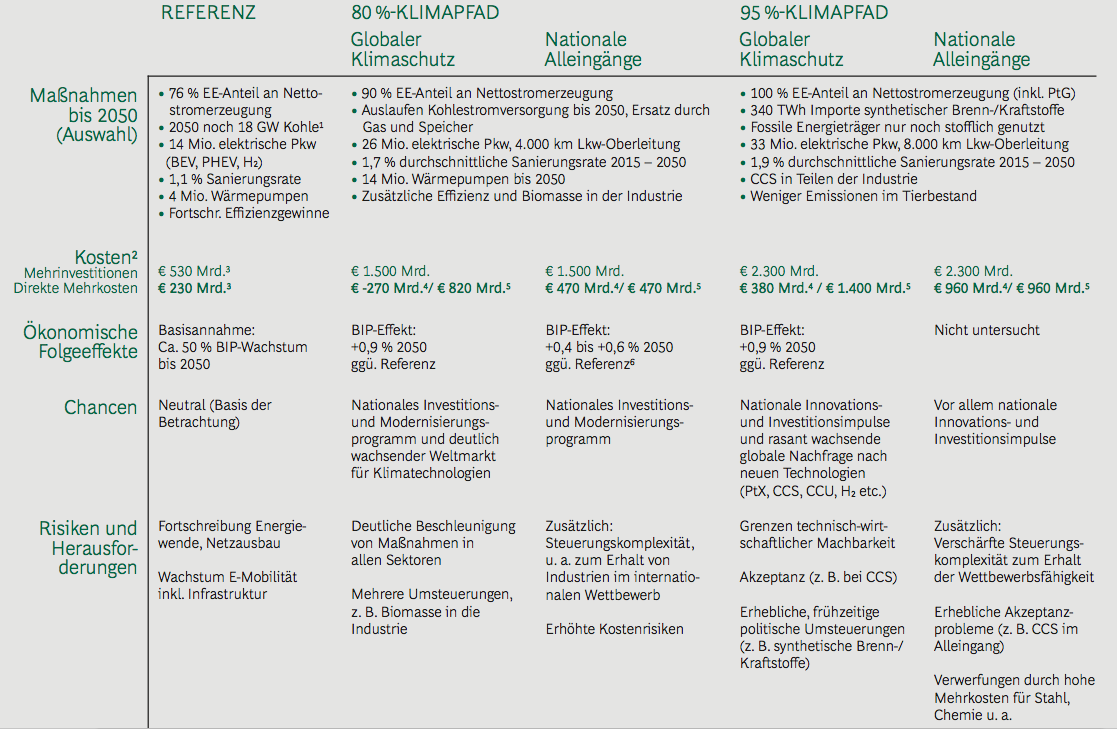

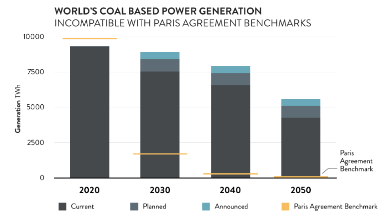
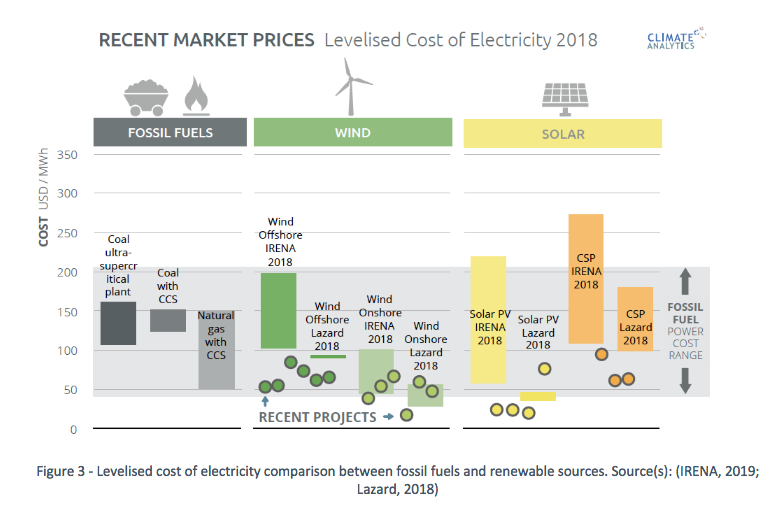
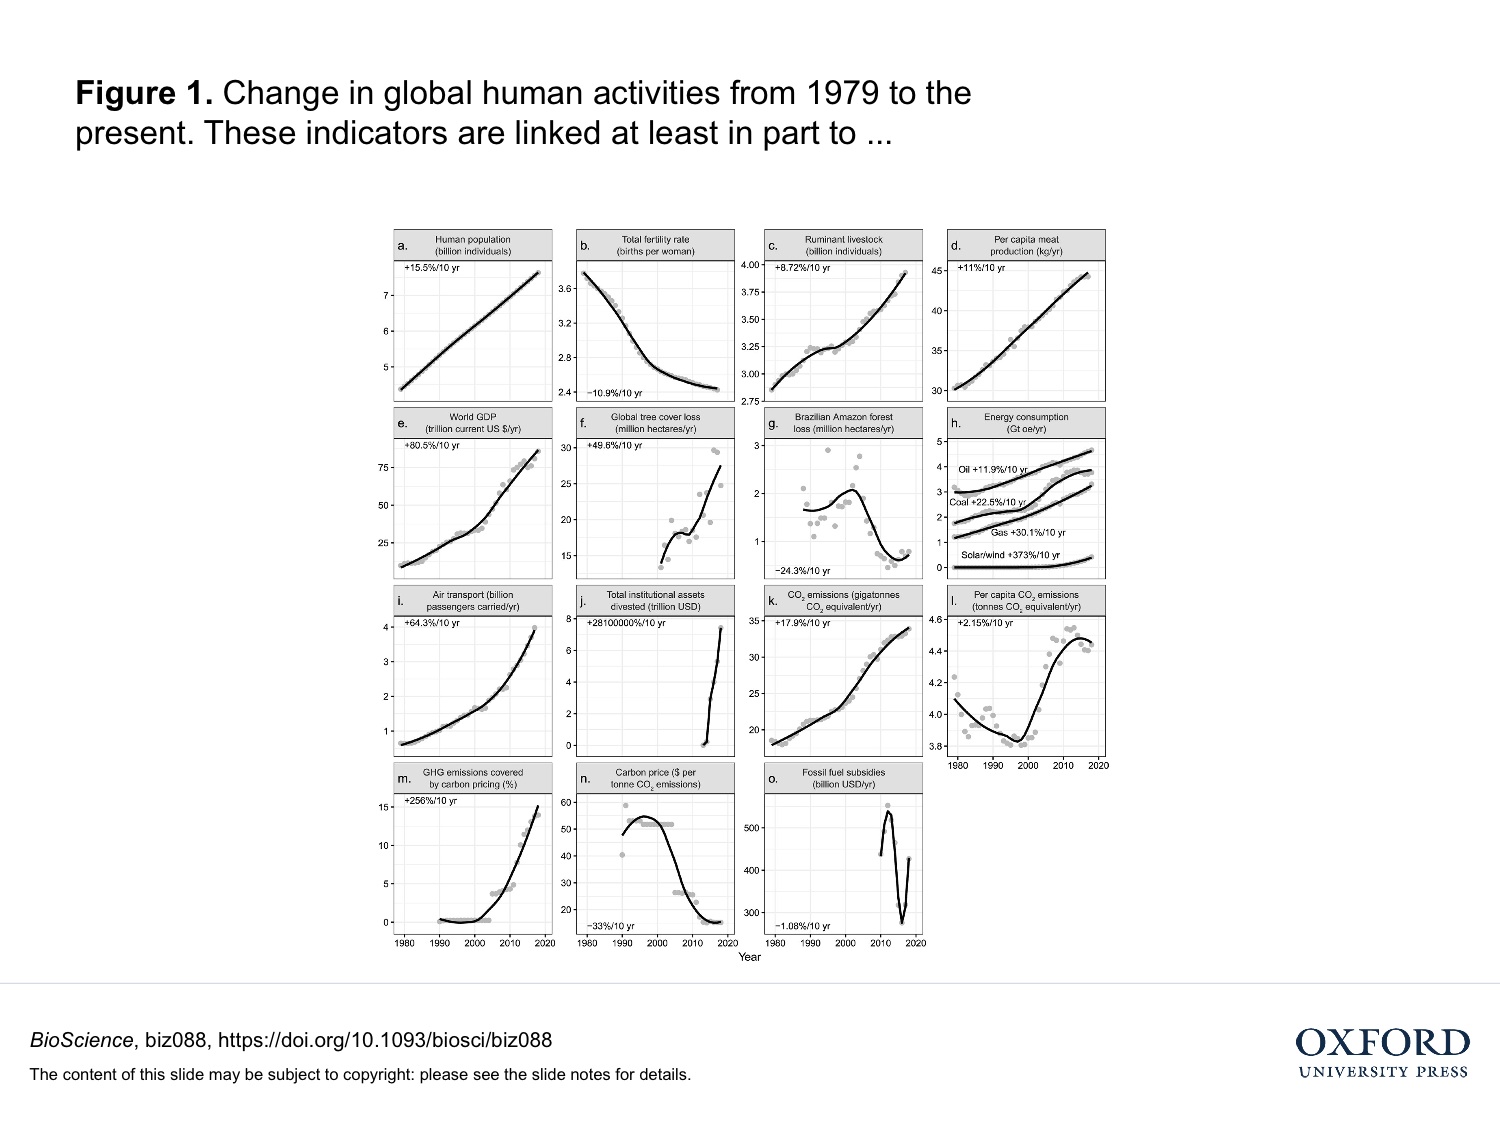
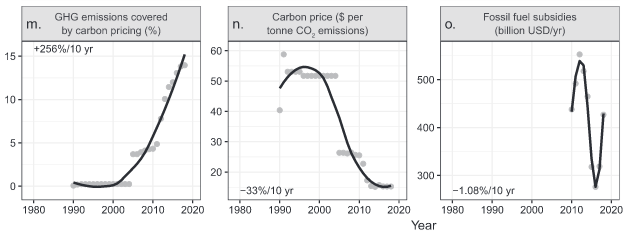
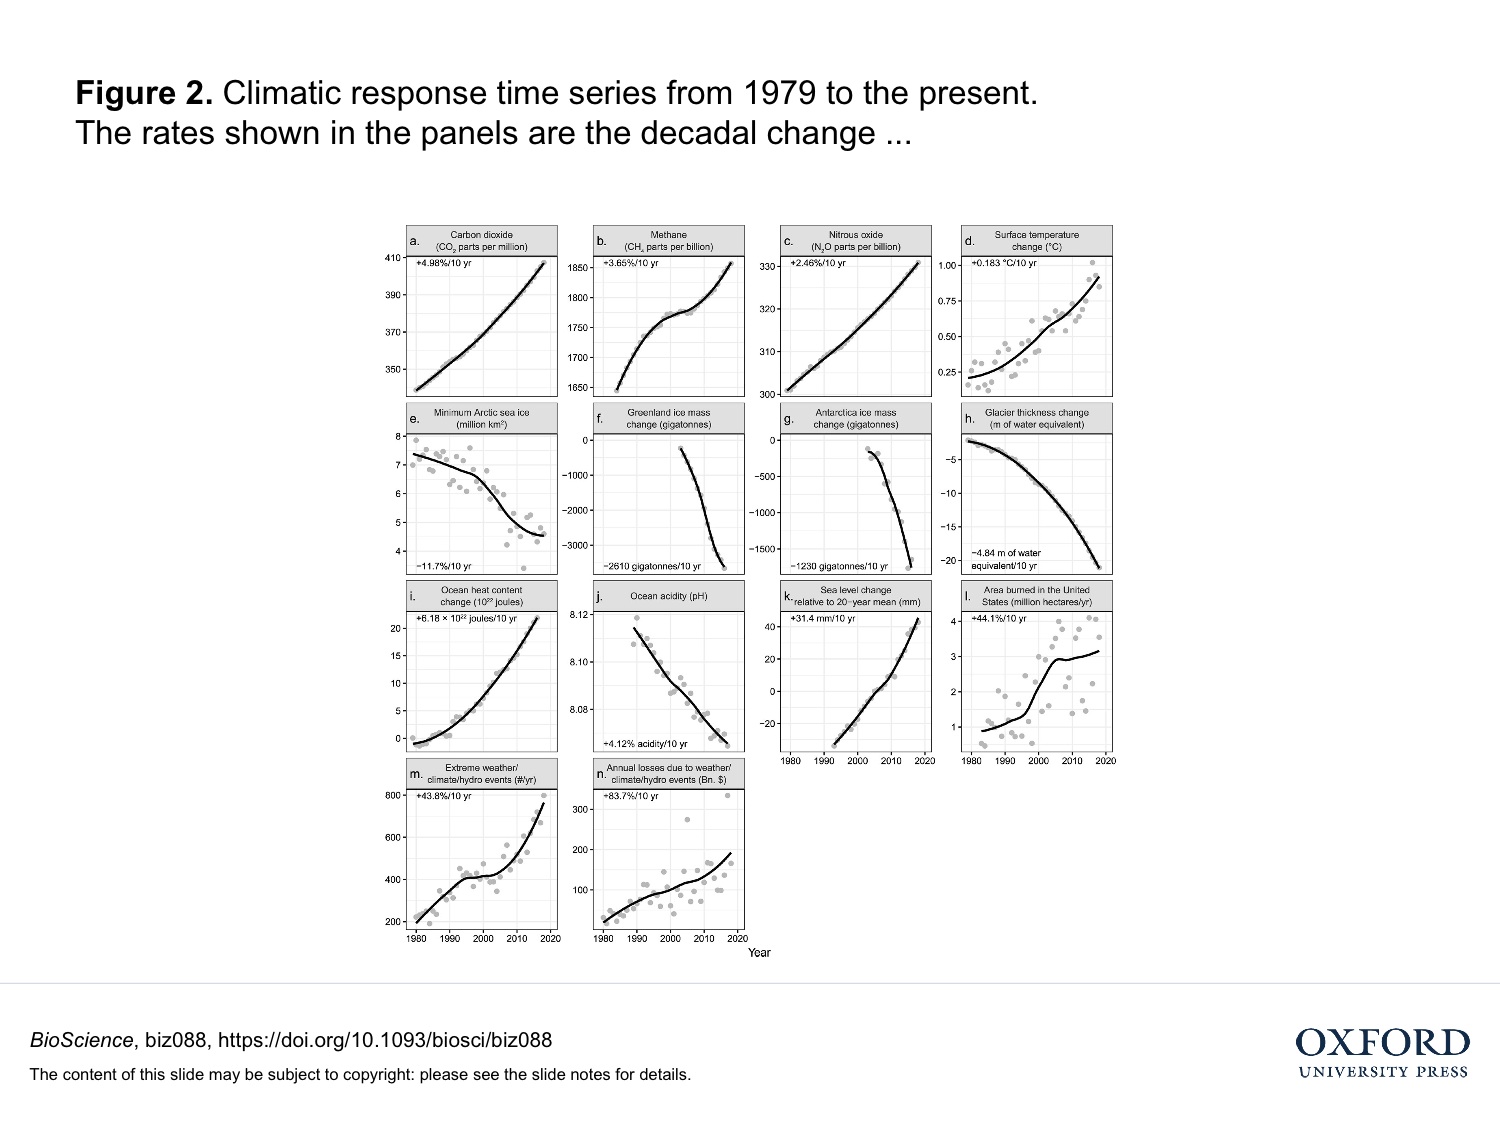
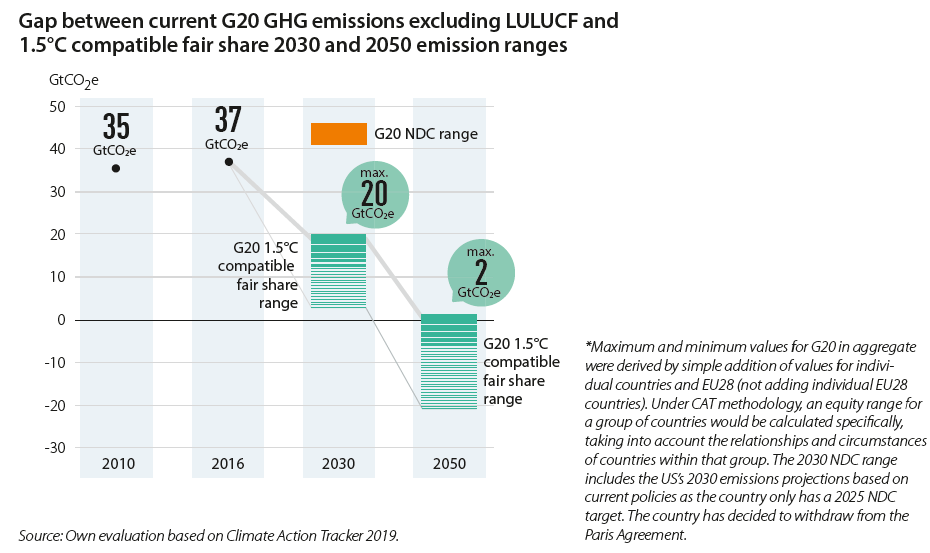
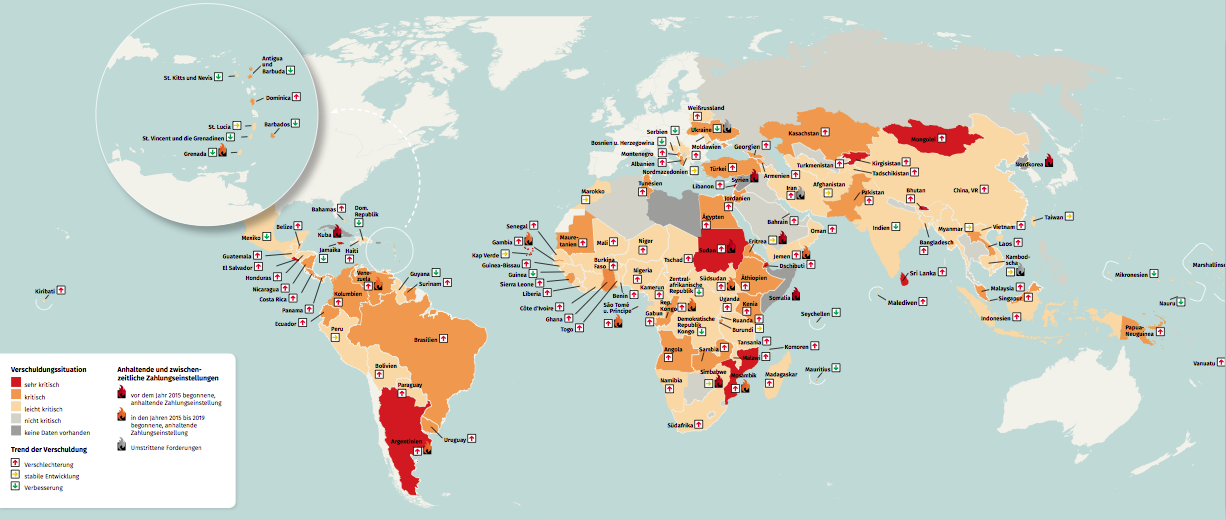
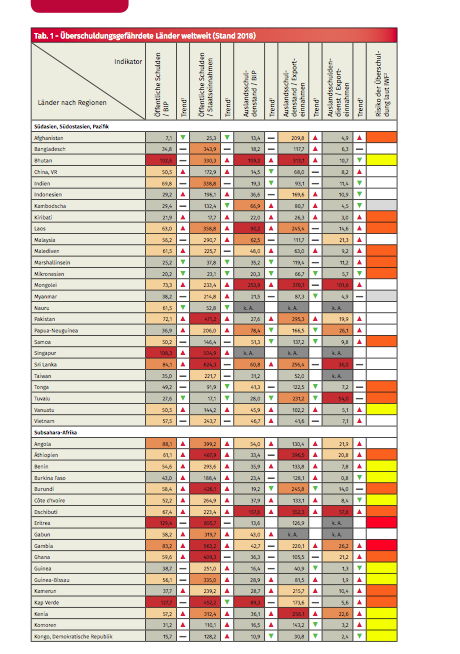
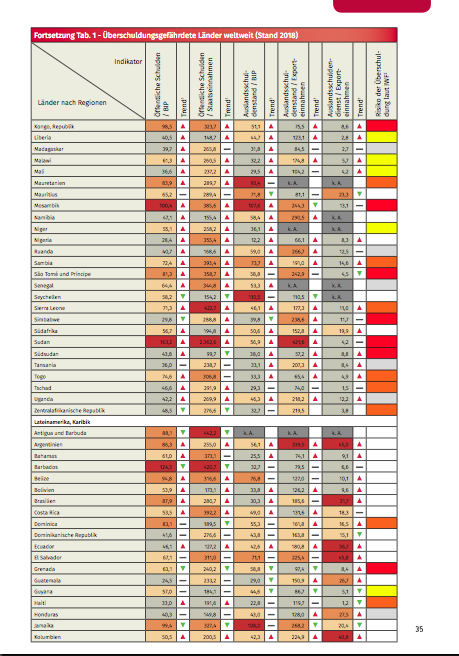
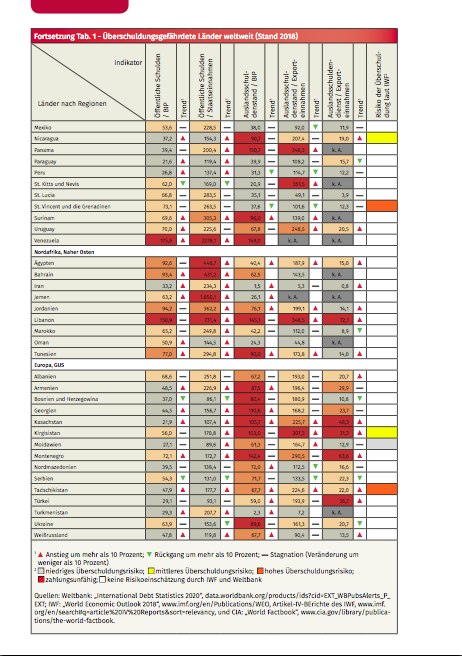
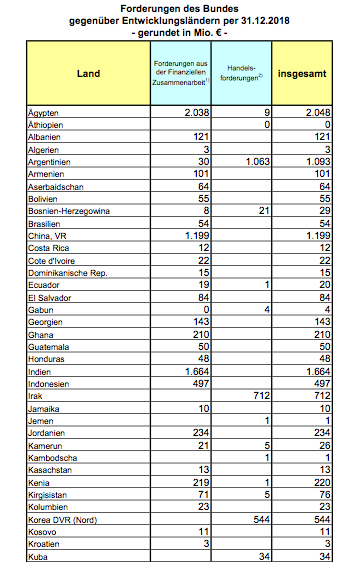
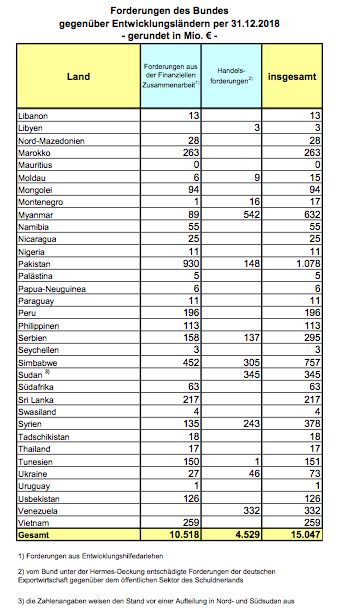
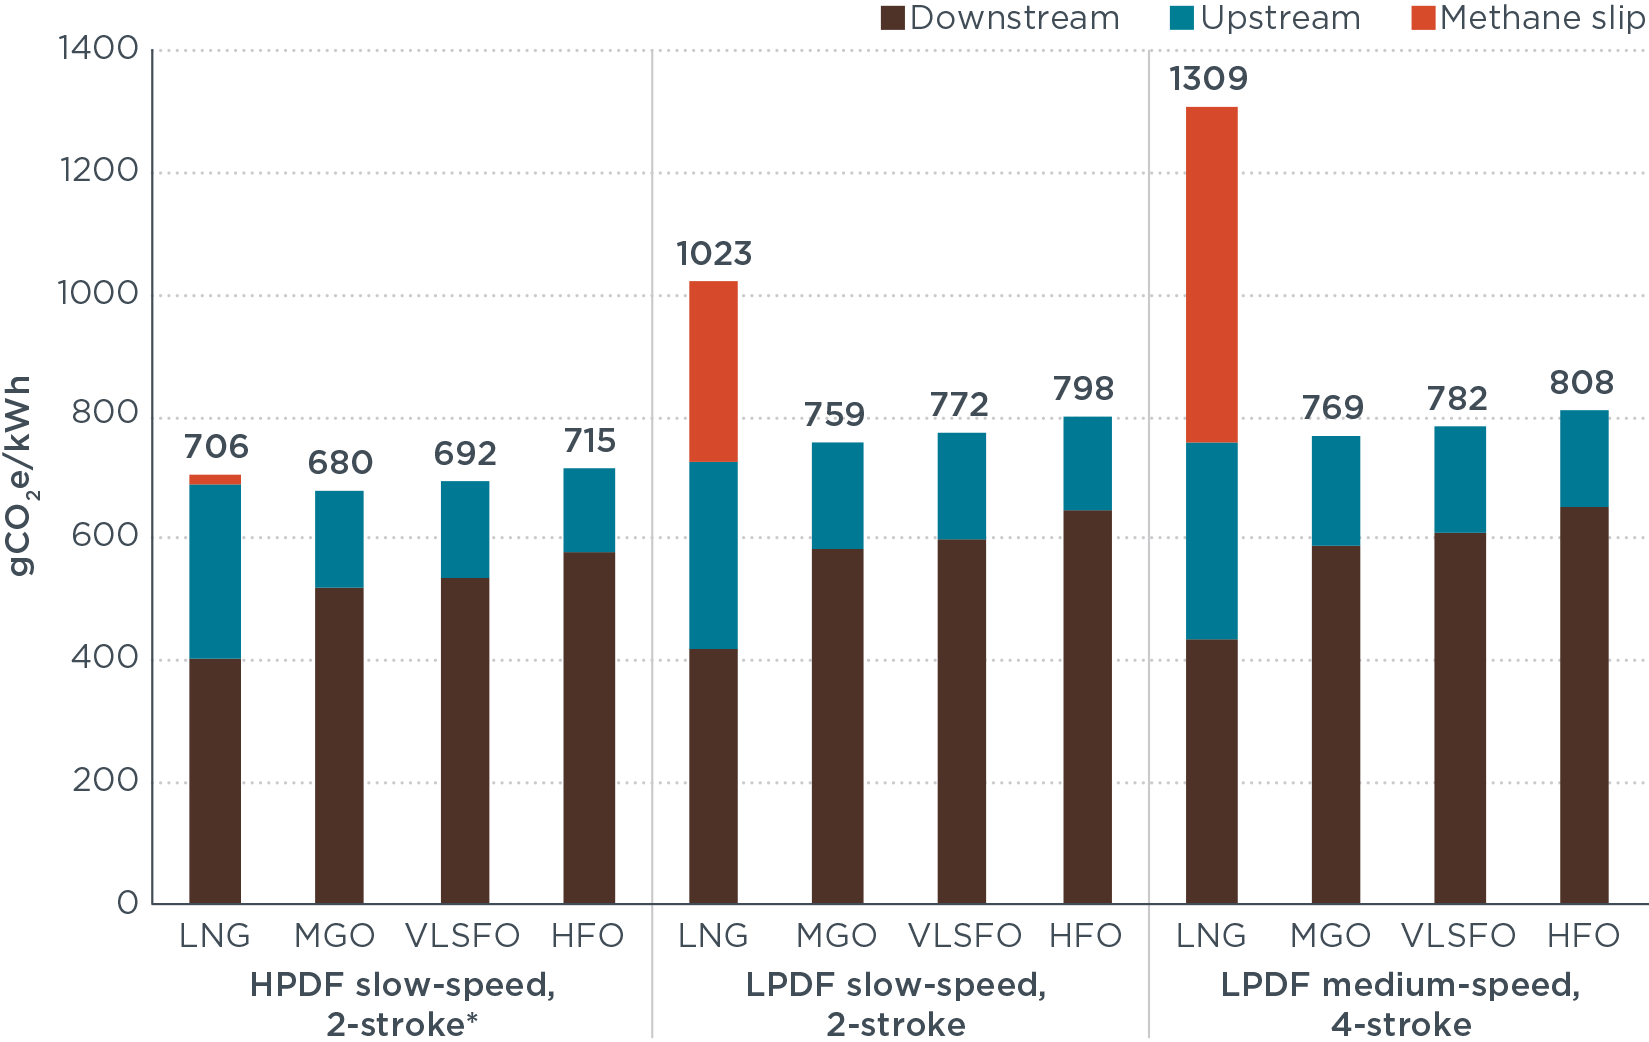
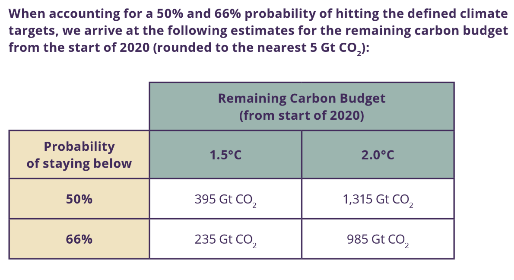
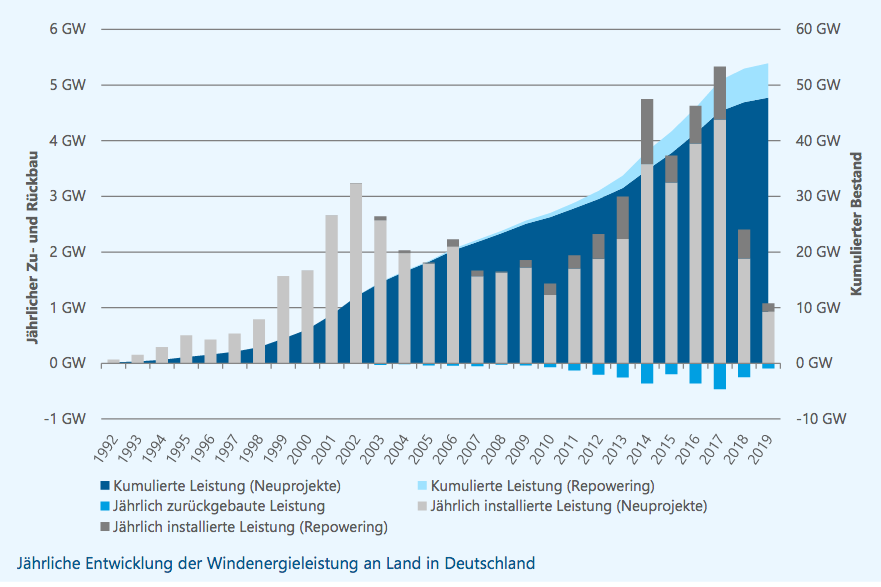
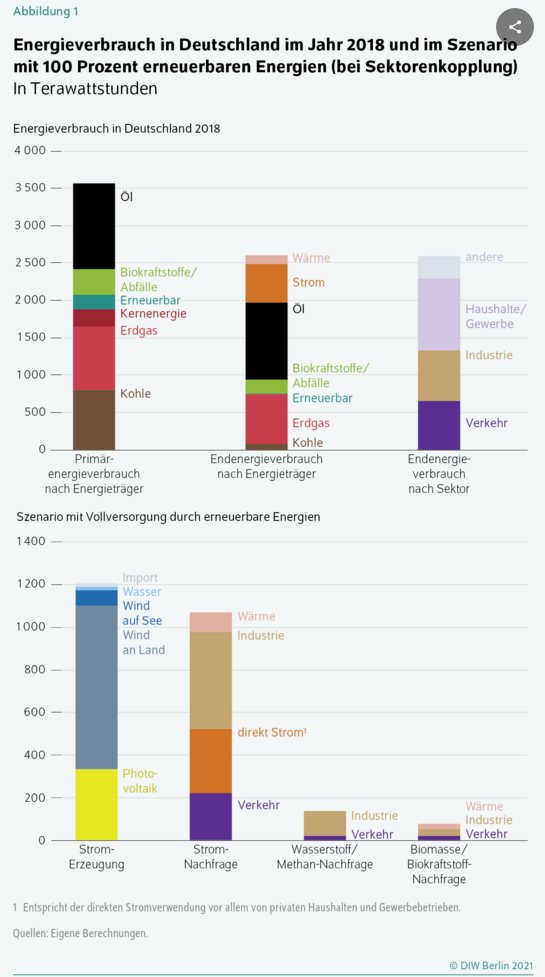
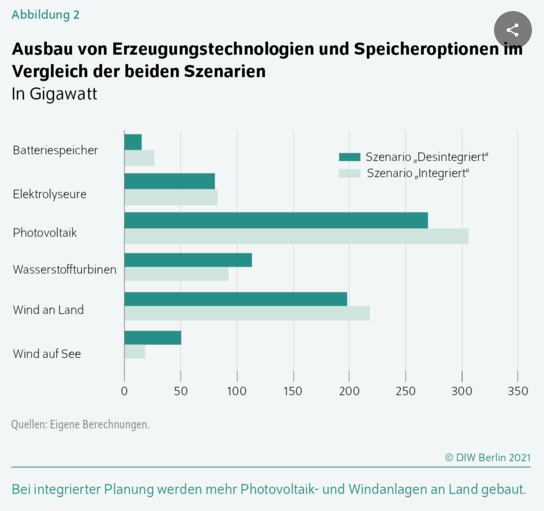
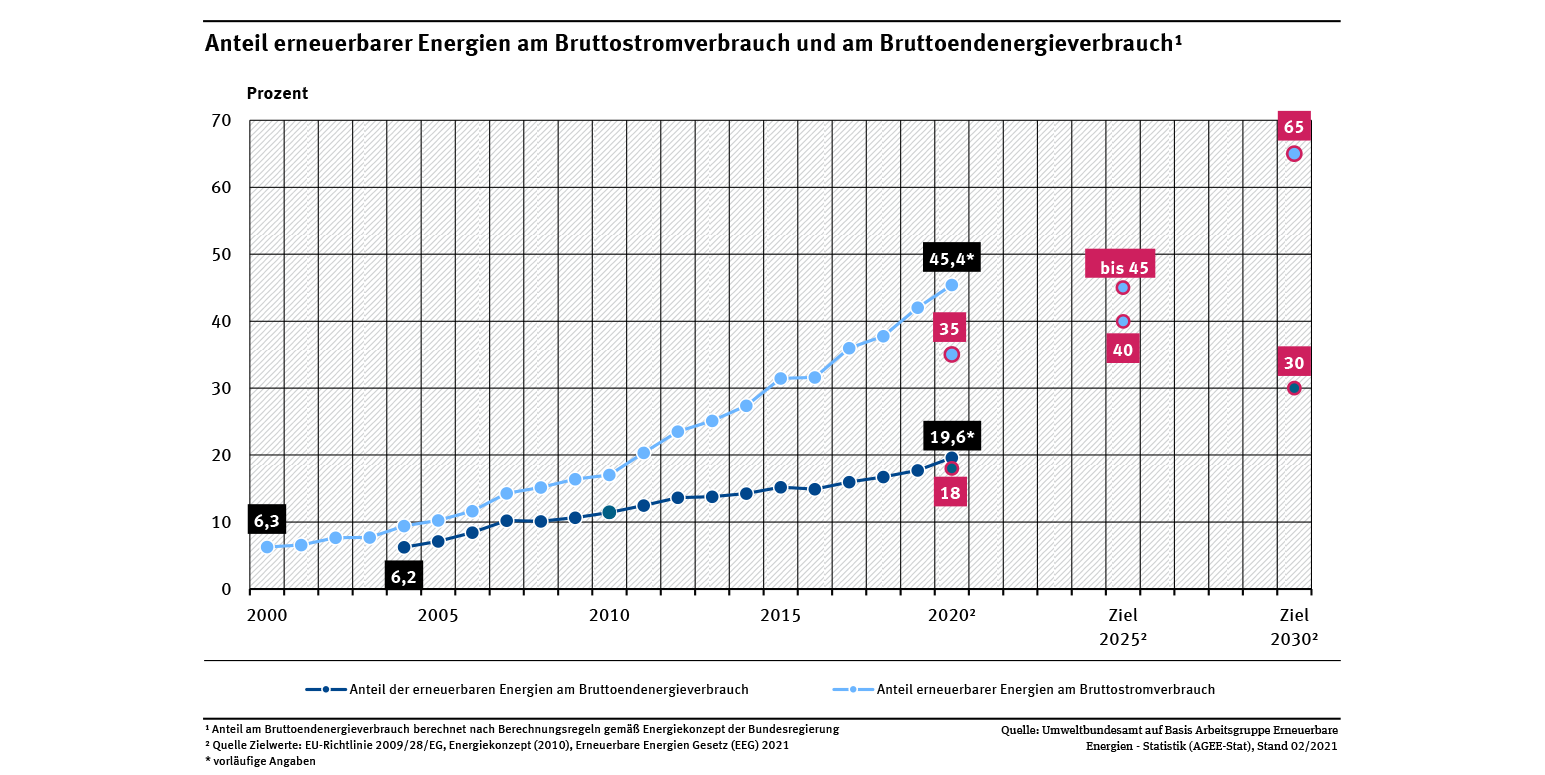
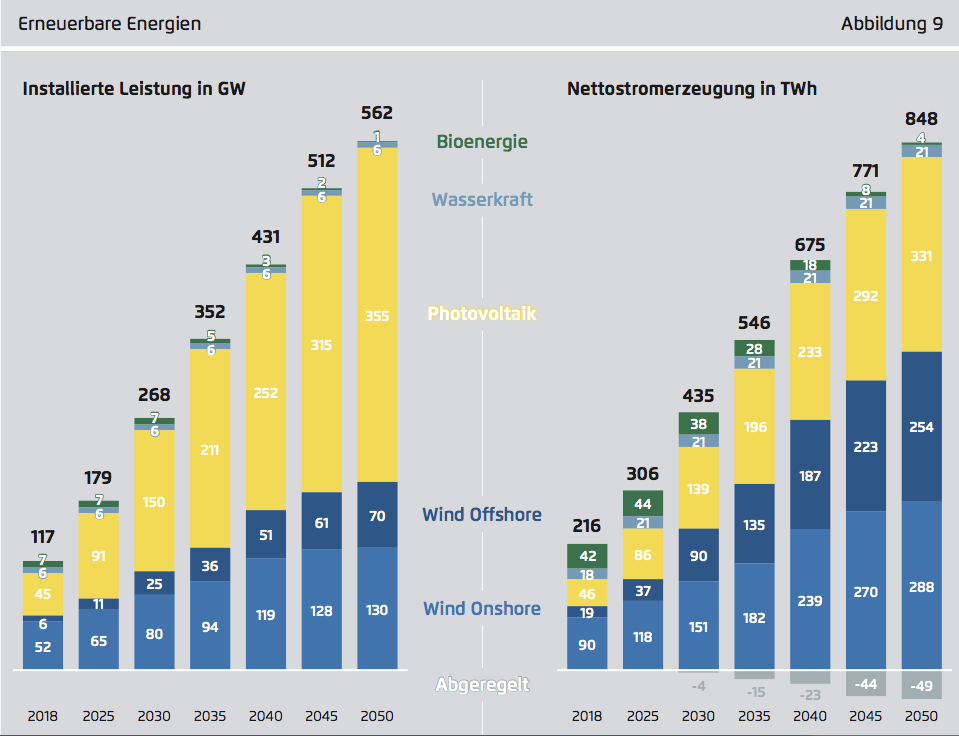
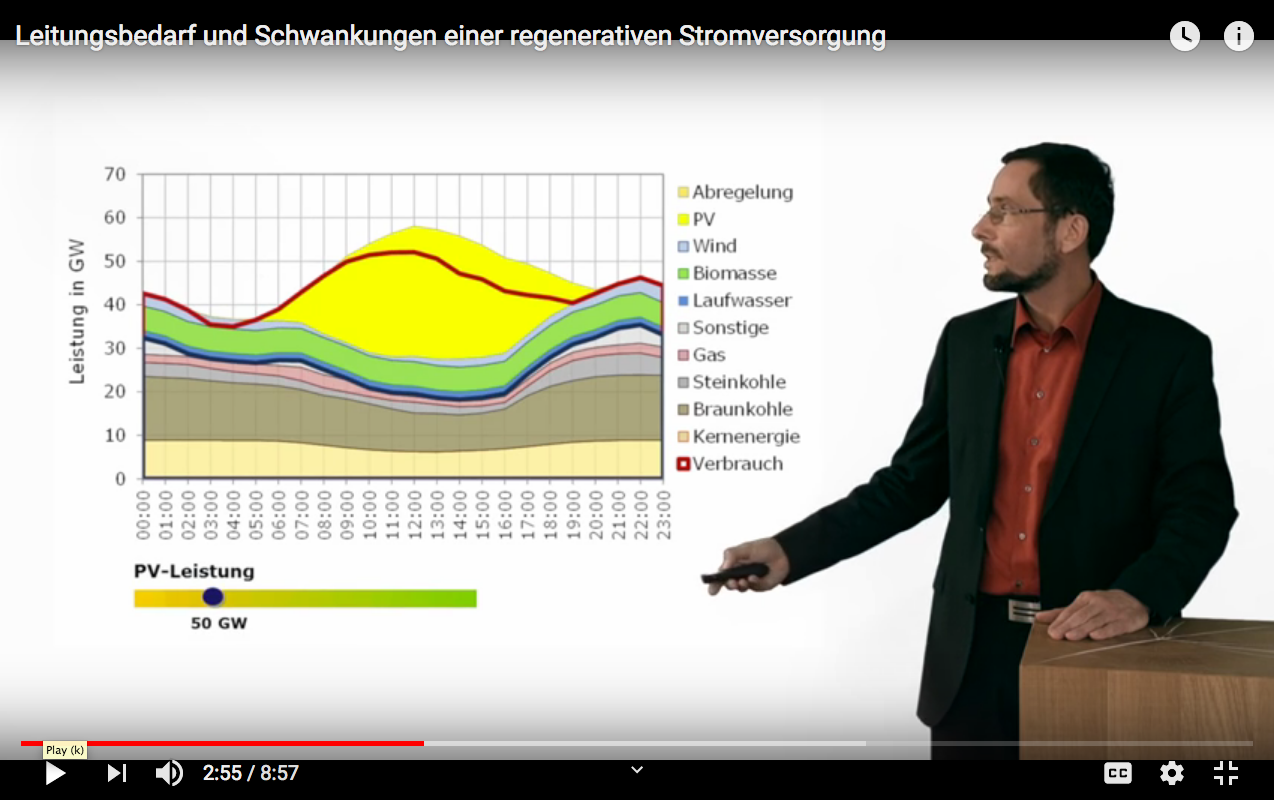
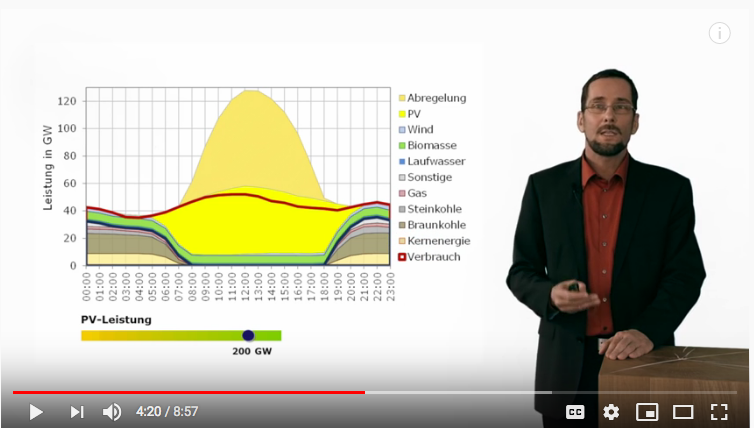
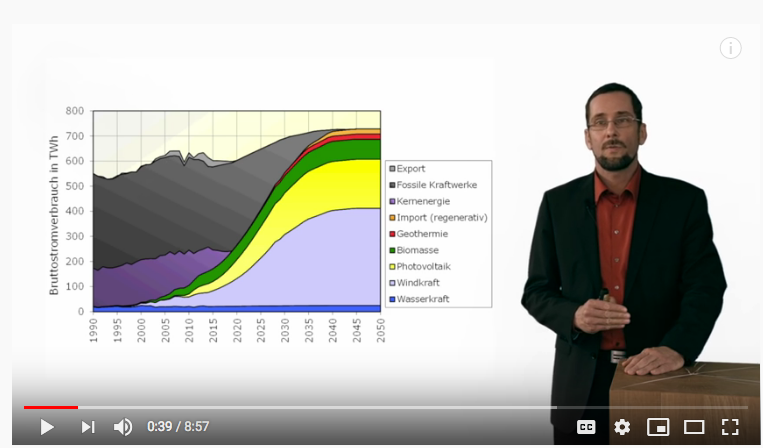
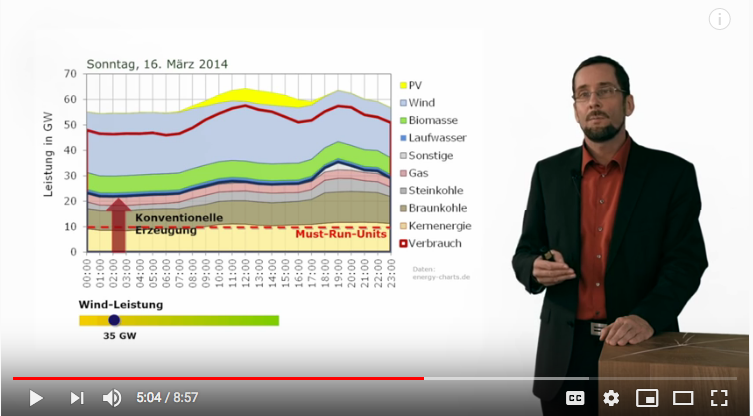
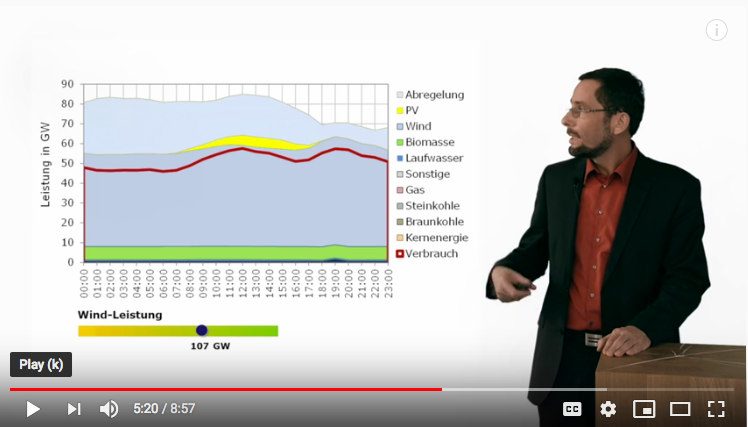
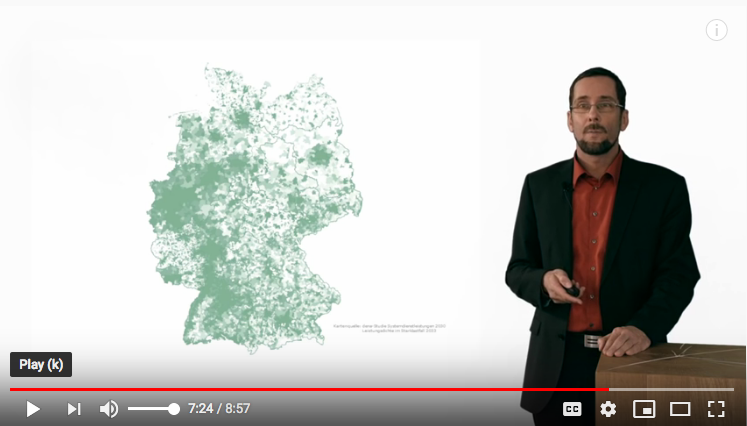
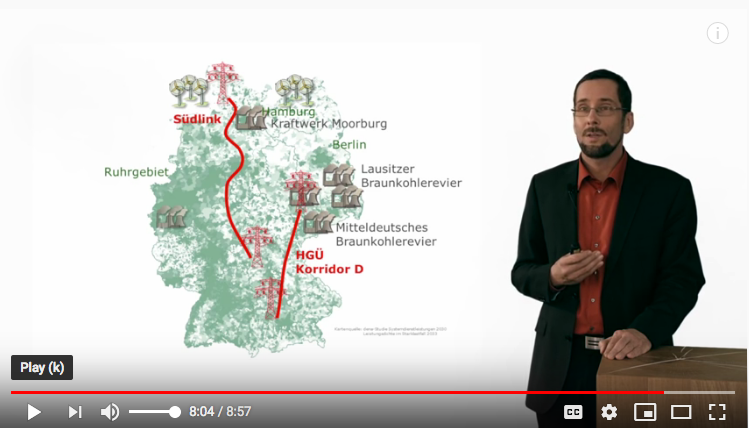
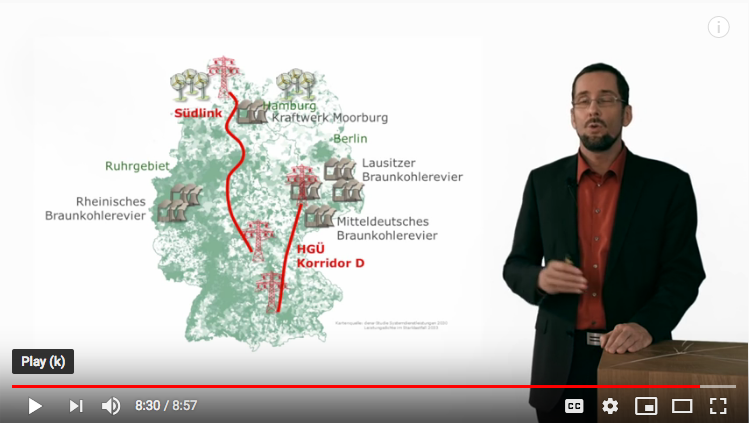
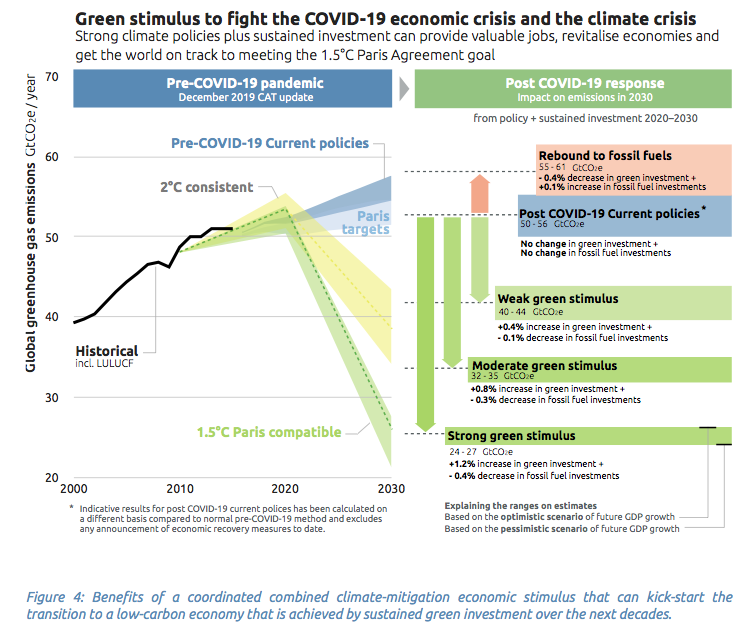


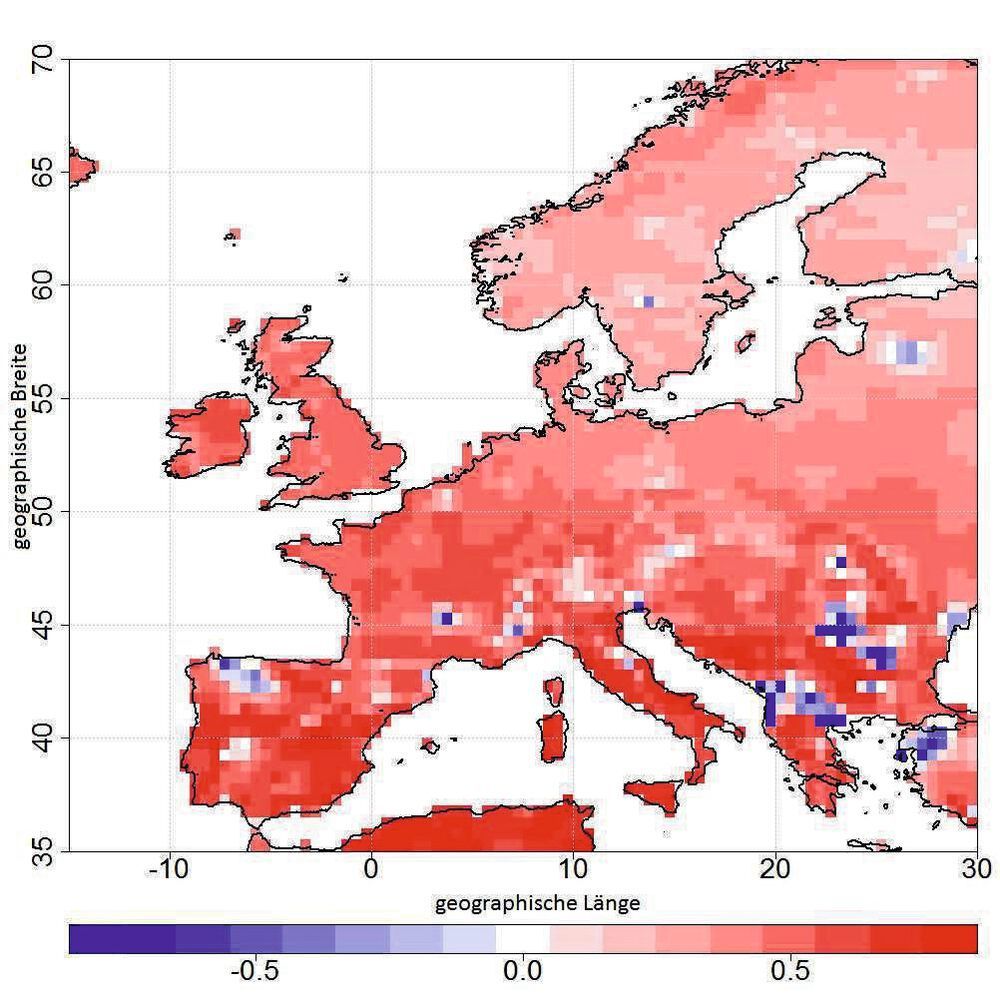
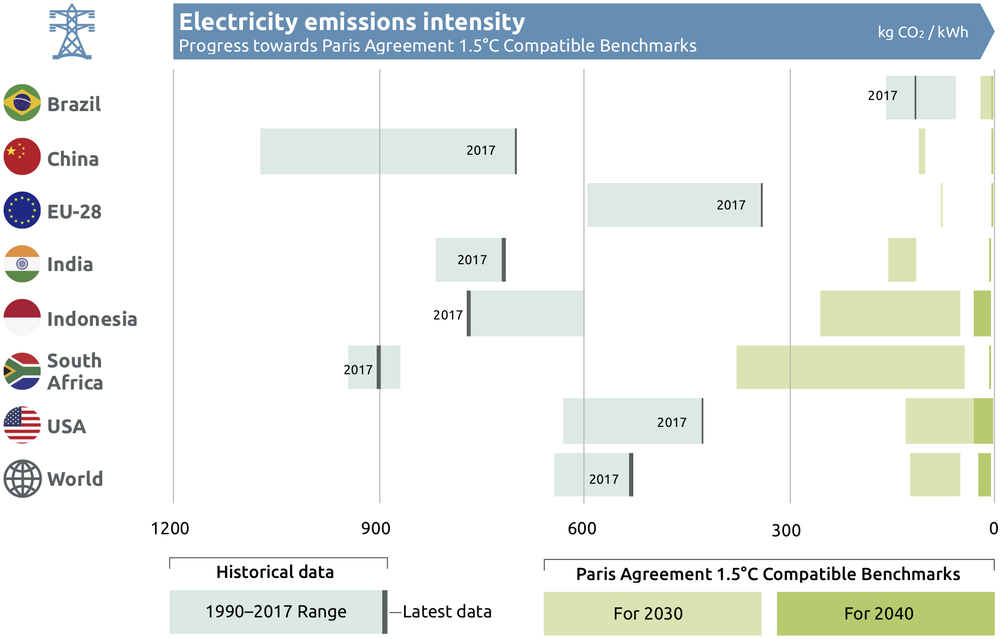
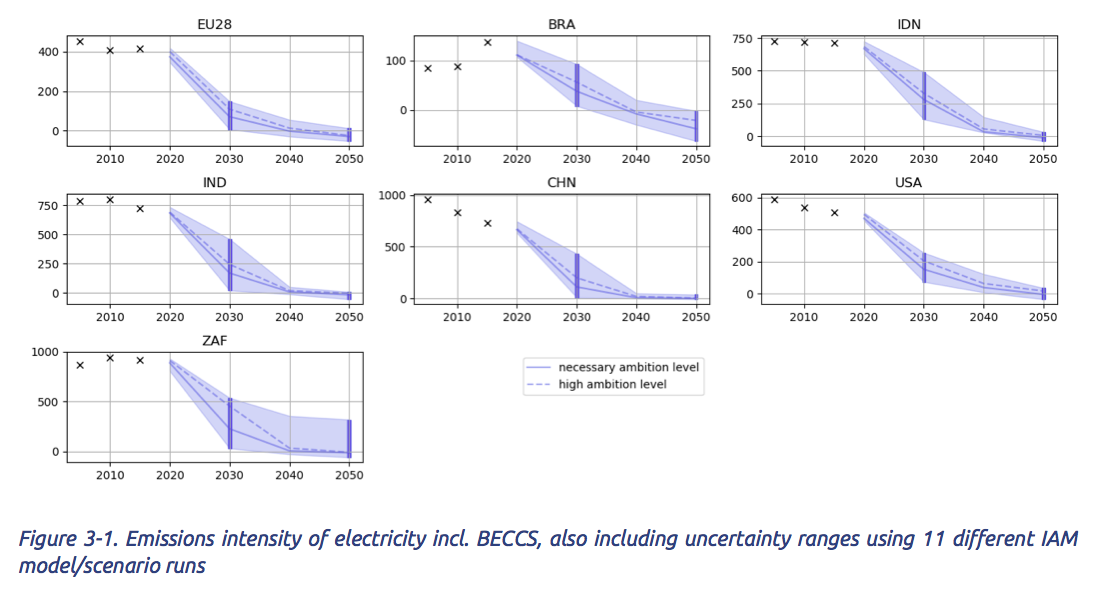
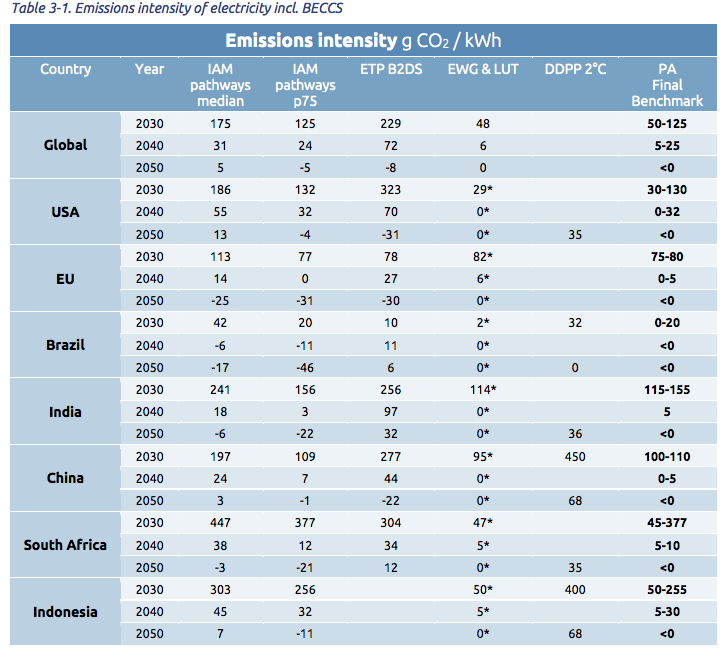
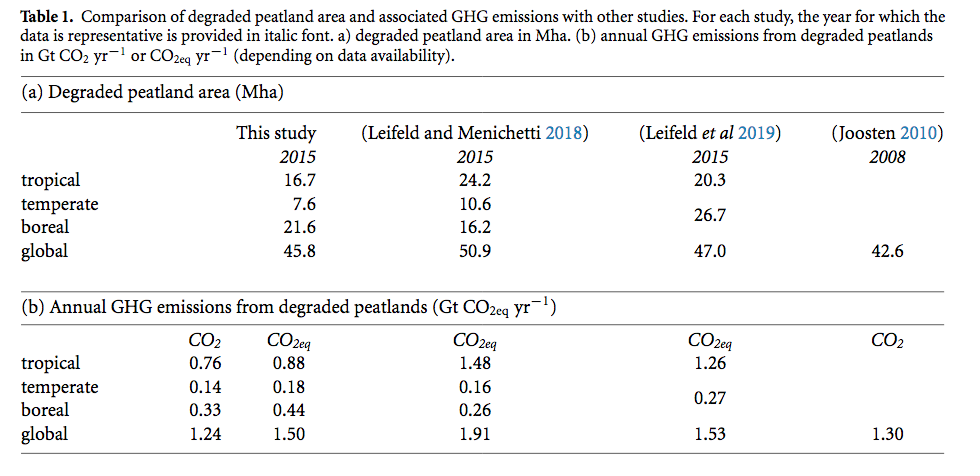
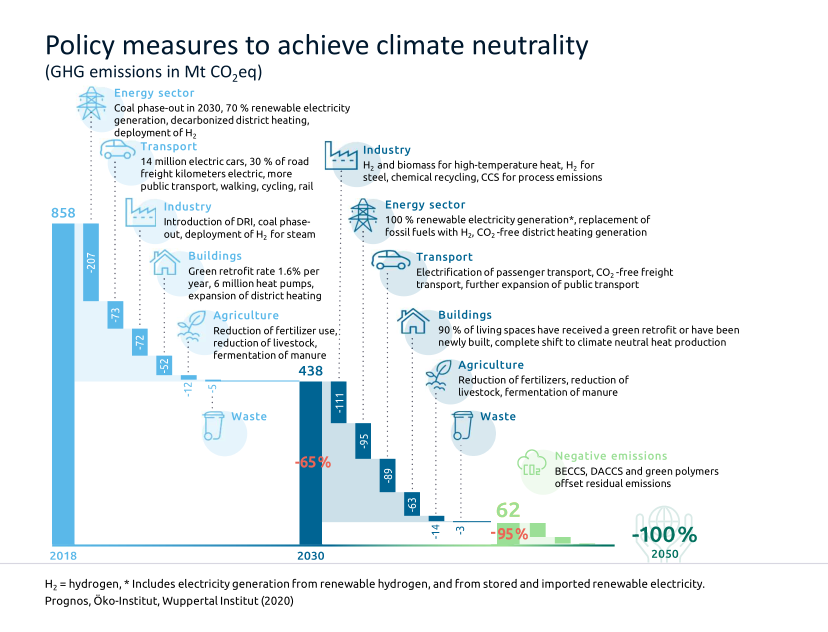
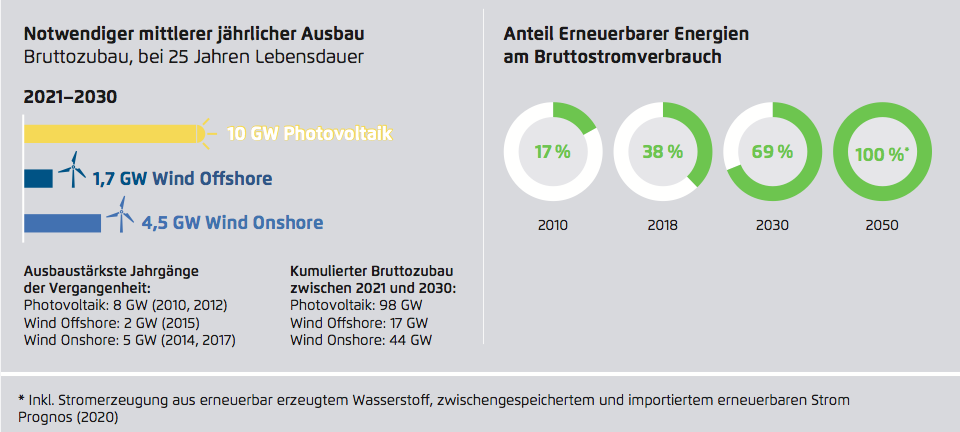
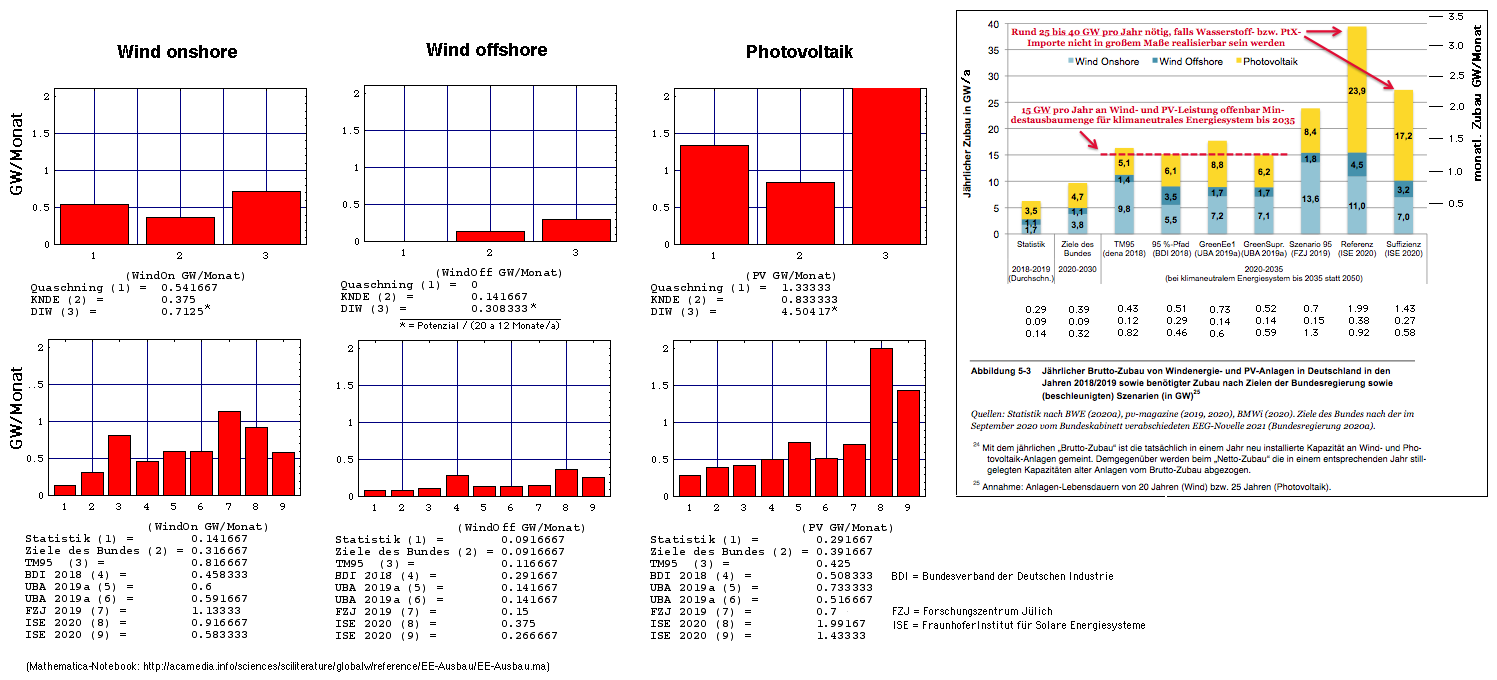
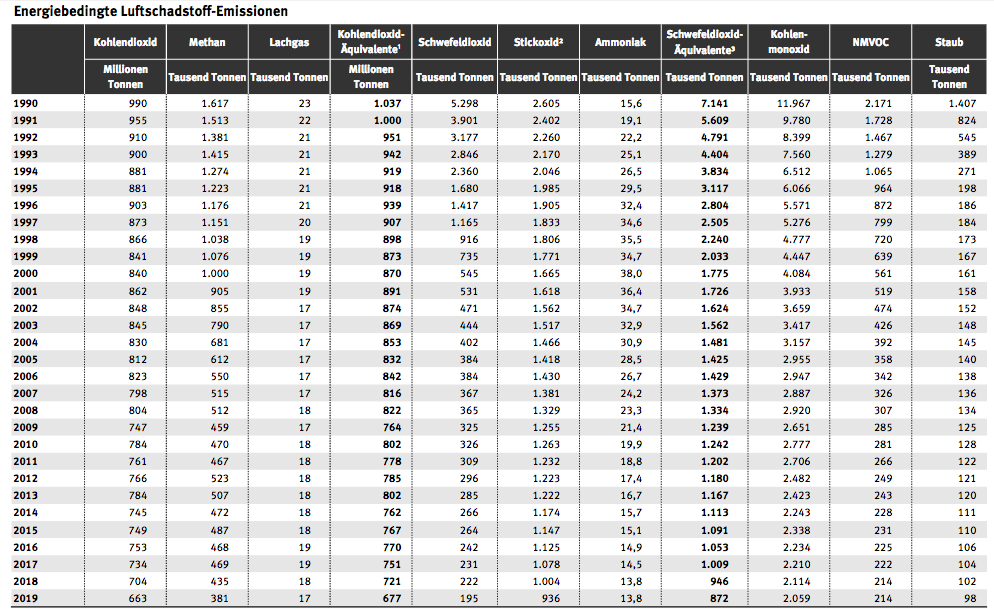
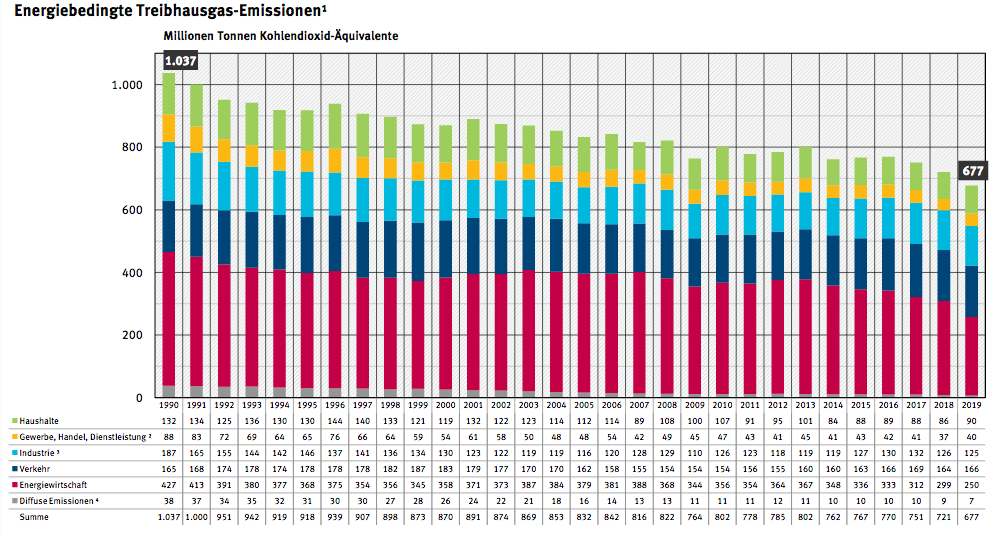


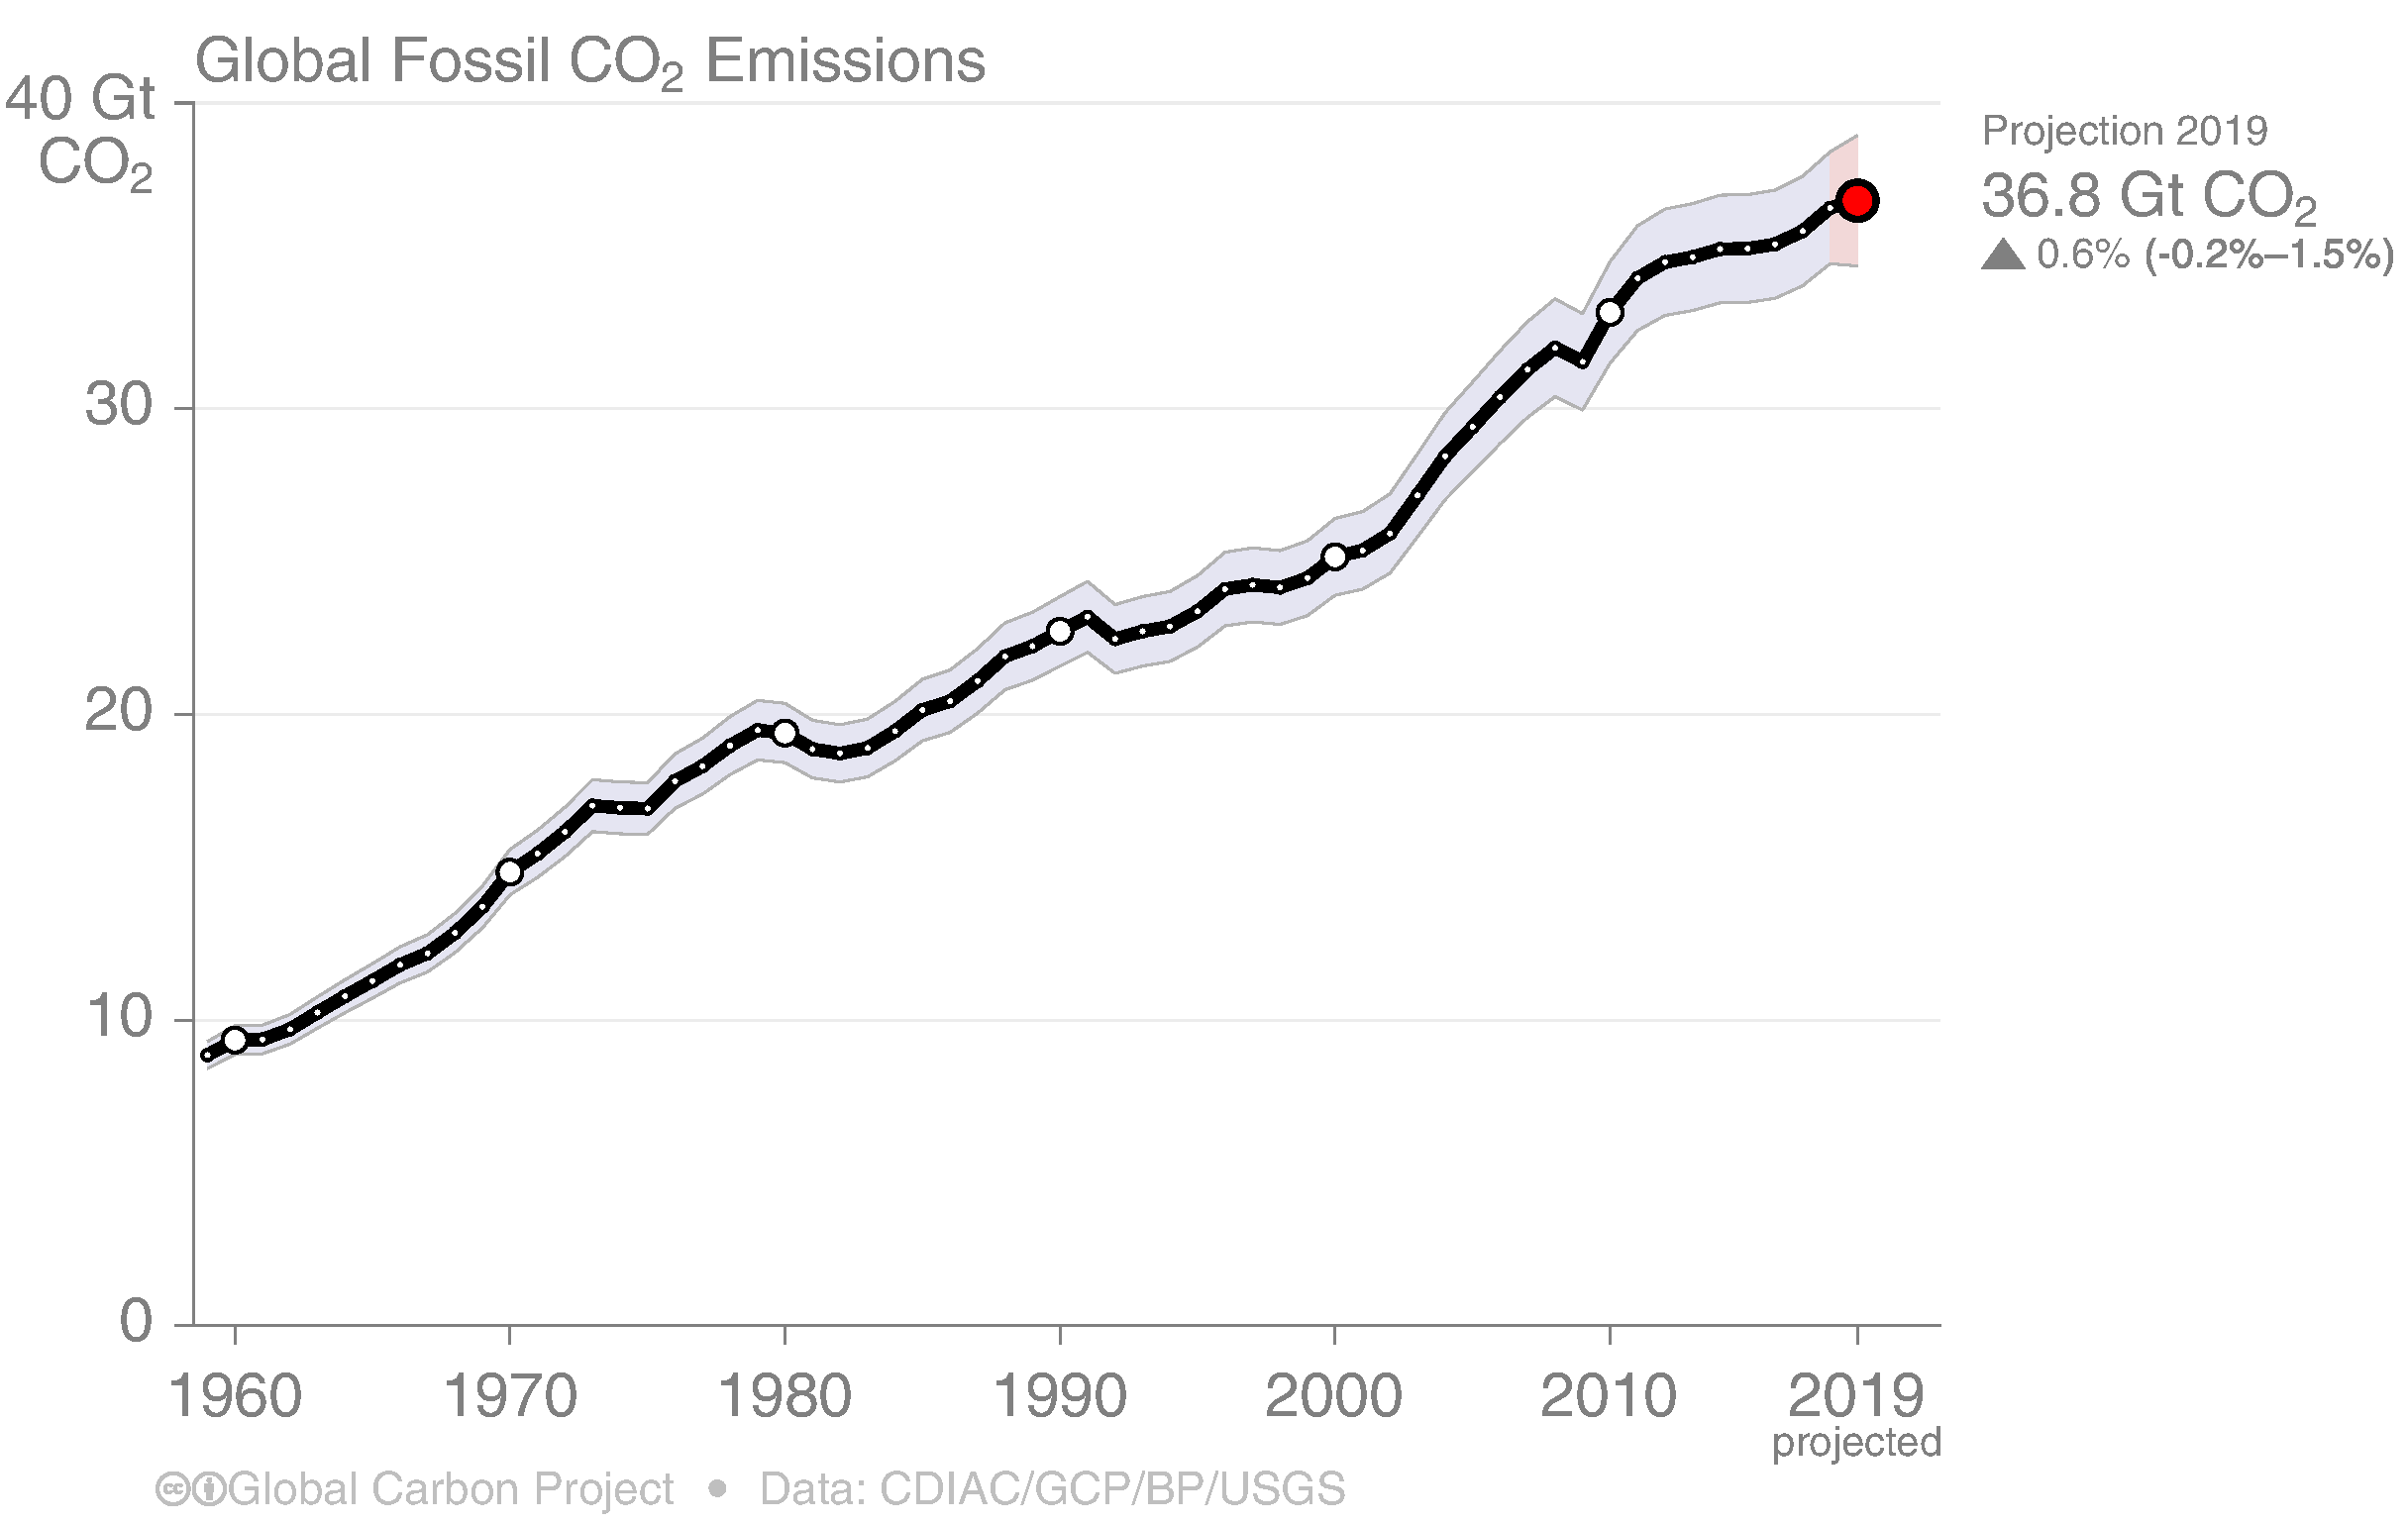


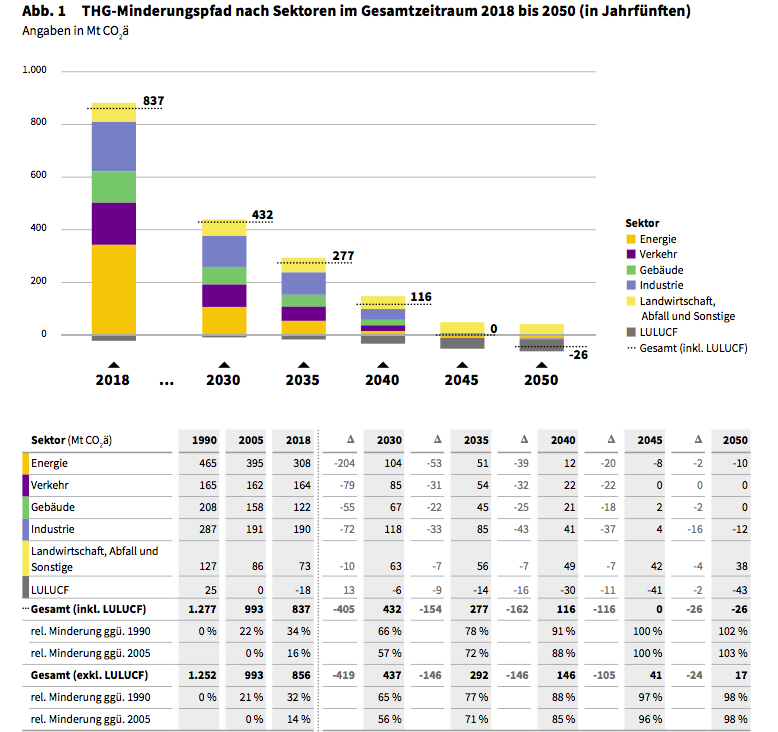
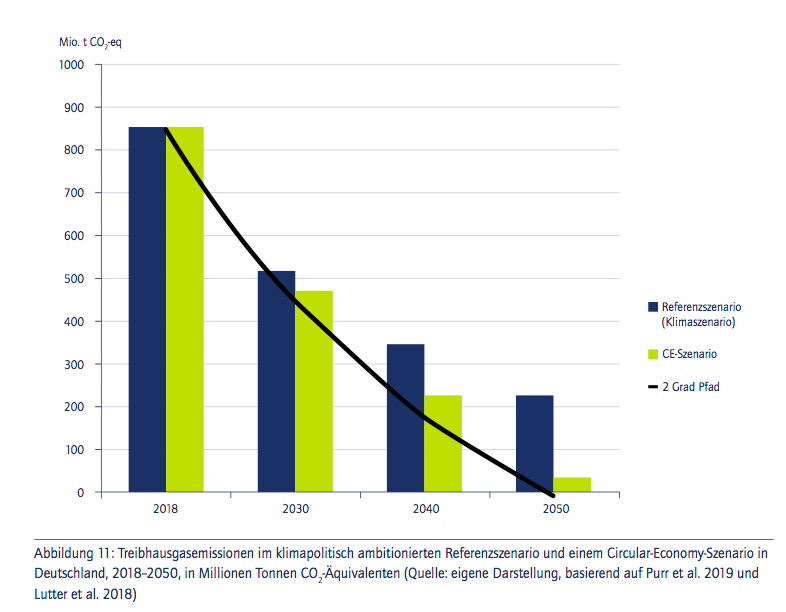
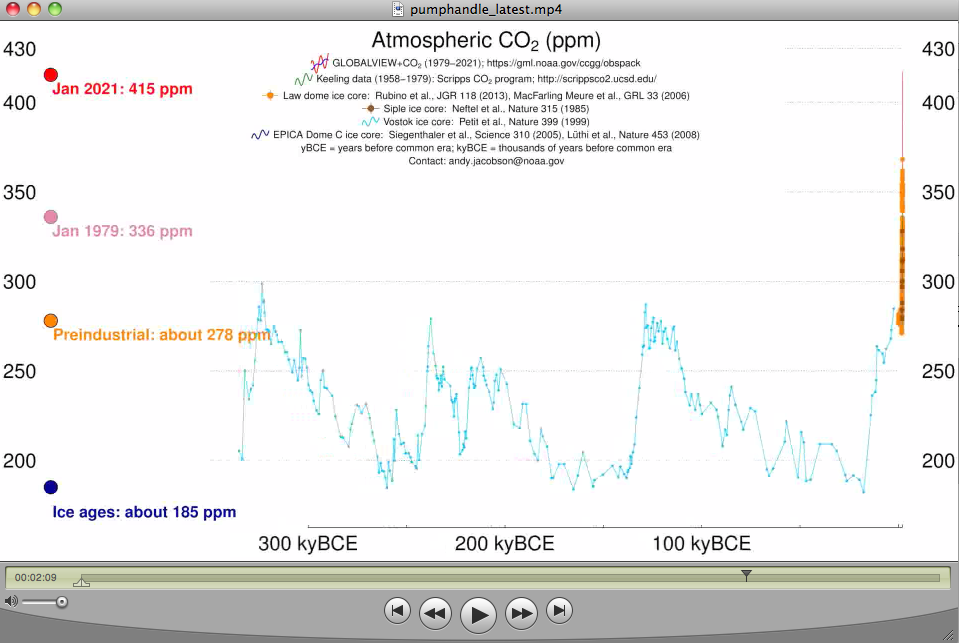
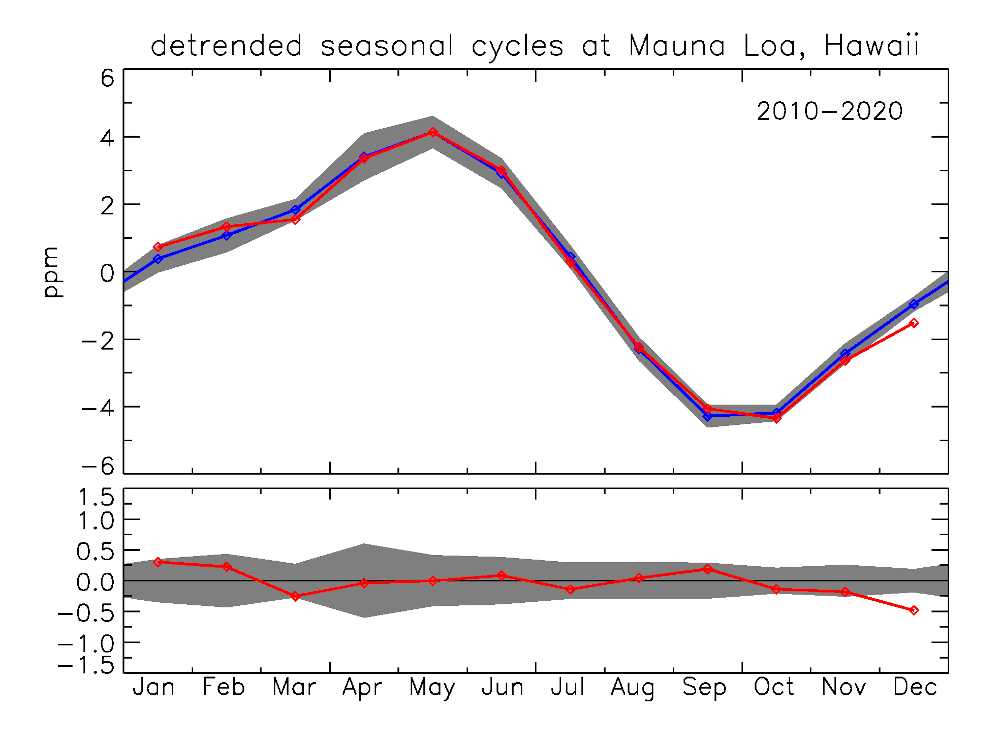
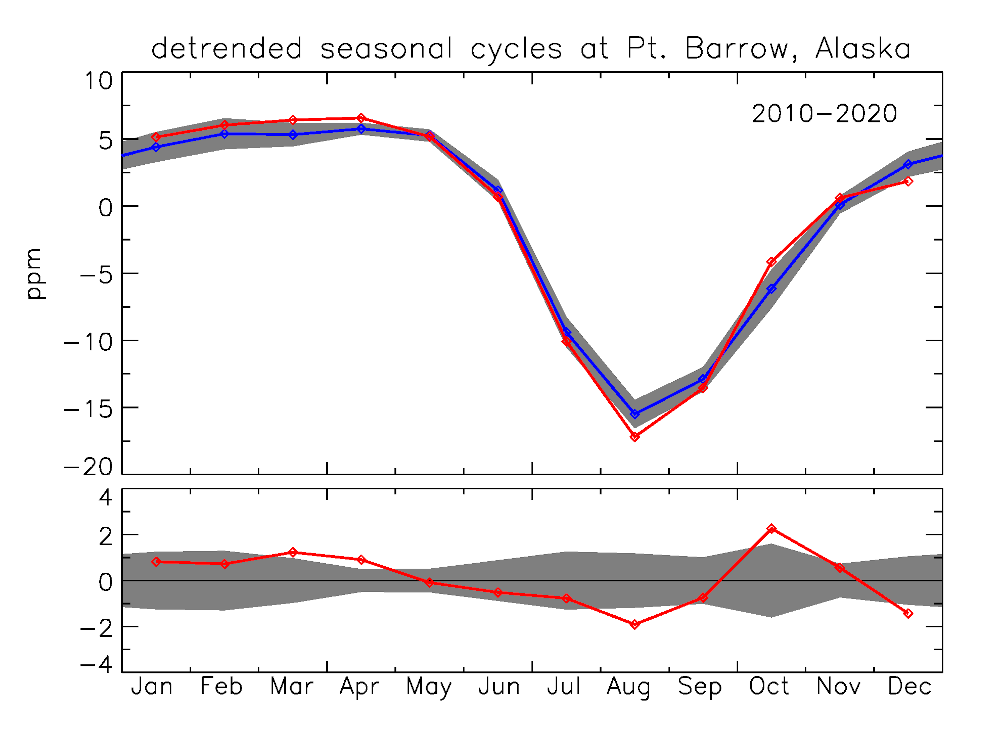
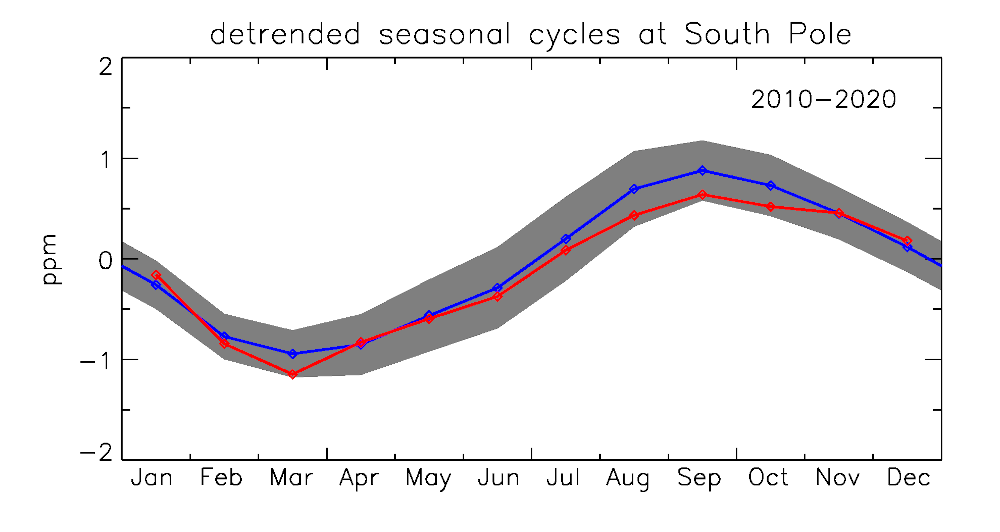
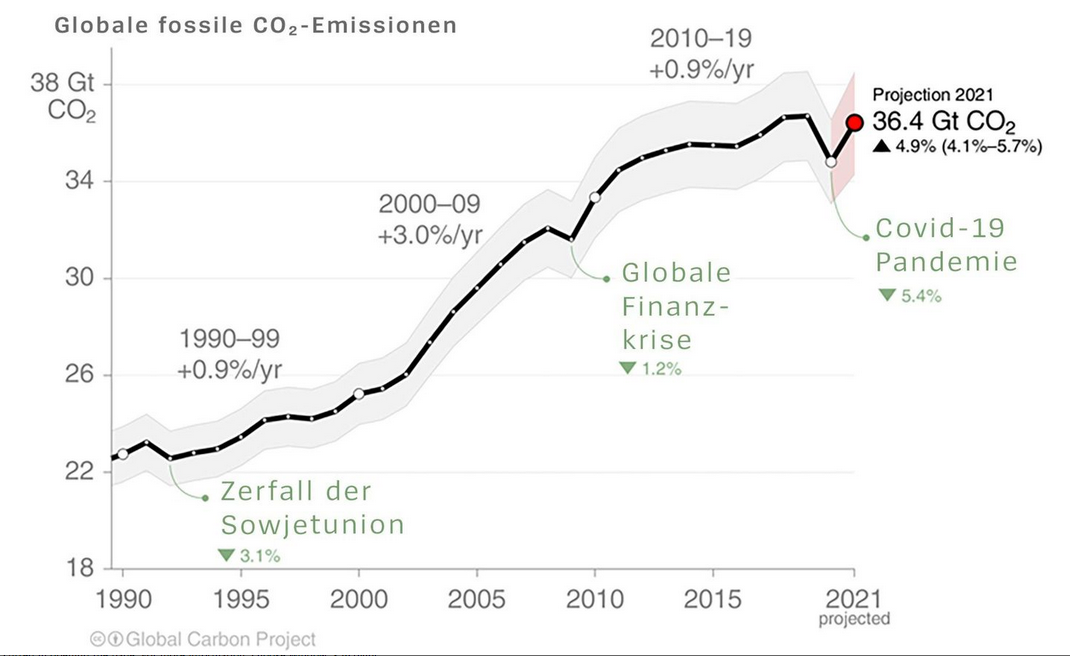

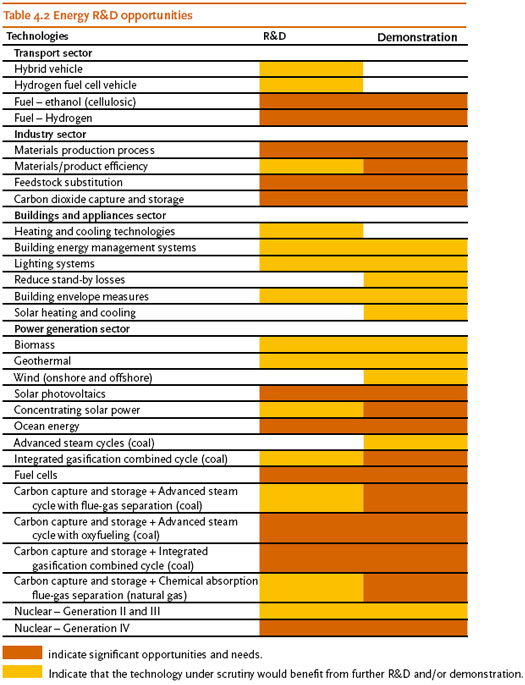
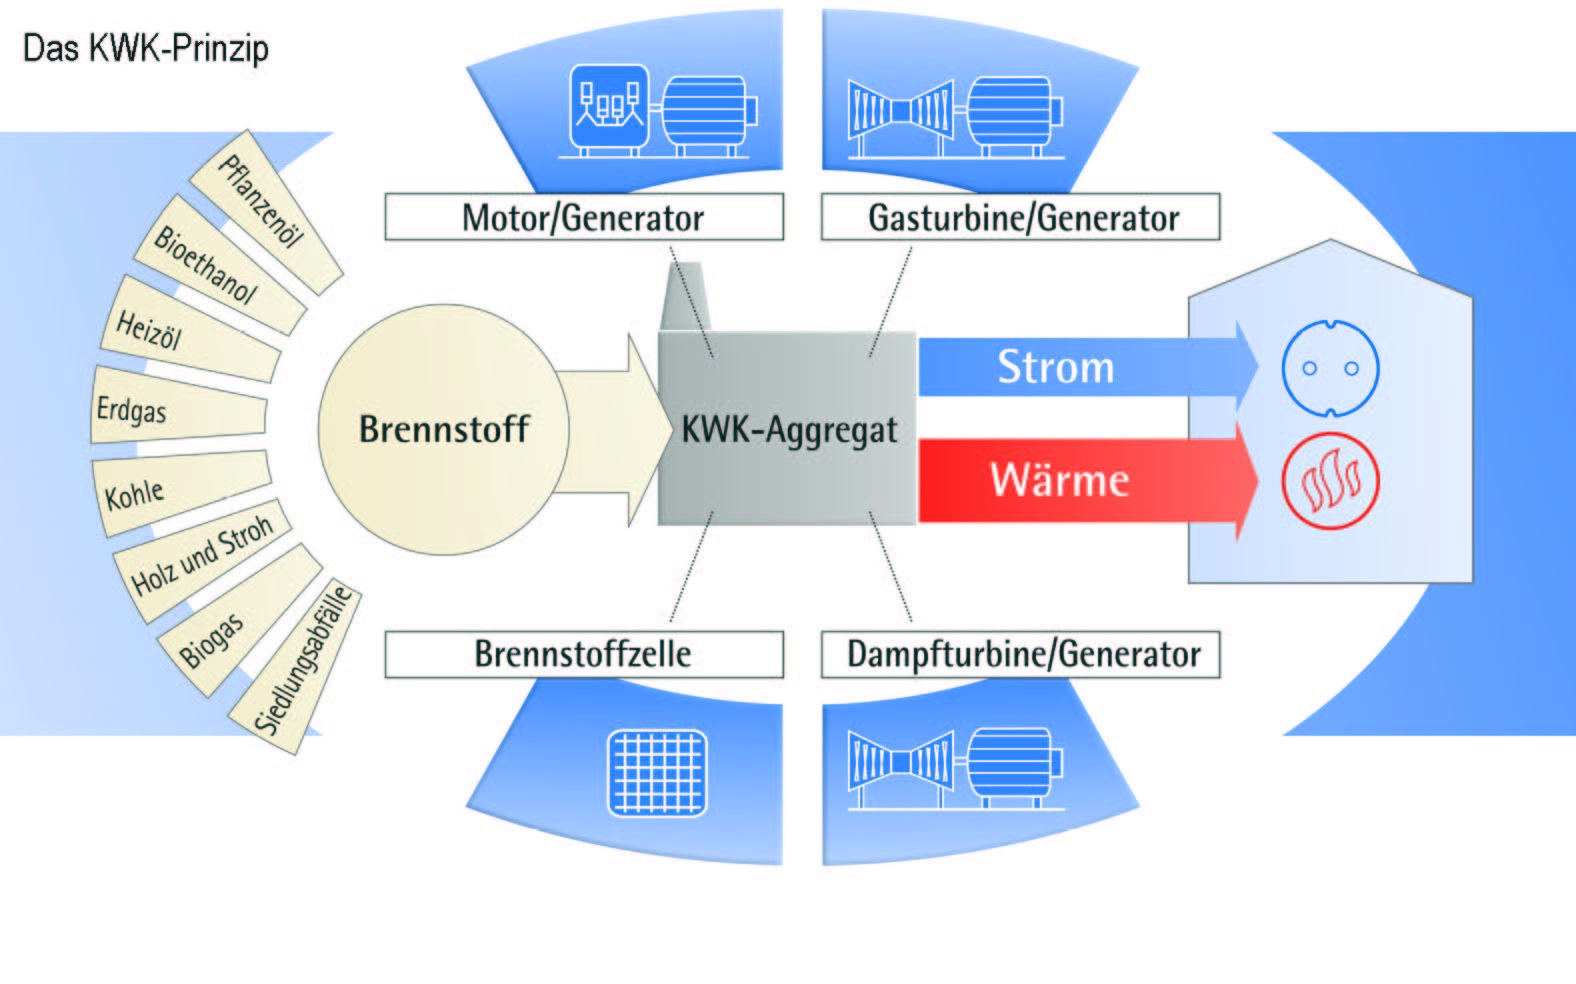
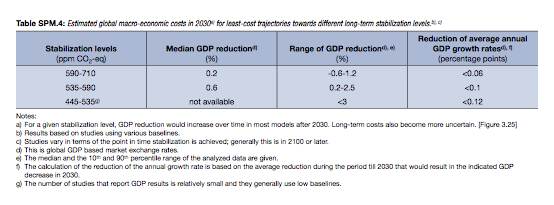
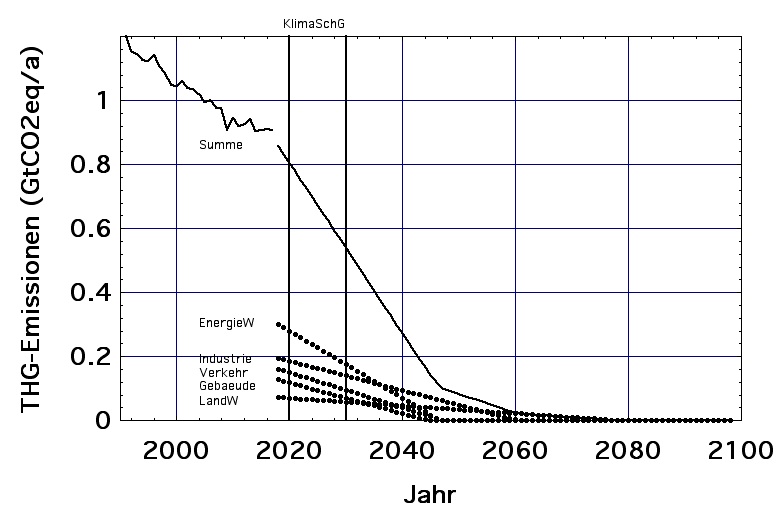