3.2.2 Simplifying Assumptions: Physics of Flow
- assumption 1: porosity Φ is spatially and temporally invariant (Φ = const).
- assumption 2: slow flow (q < 1 m/year).
3.2.3 Simplifying Assumptions: Chemistry of Flow
- assumption 3: thermodynamic equilibrium: thermodynamic equilibrium among all chemical species, particularly in adsorption reactions, establishes itself within less than a week after a perturbation. Thus, in this time frame every Cj(c) = C*j(x, t) is a unique (hysteresis free) function of the soluble concentrations c = (c1, c2, ...., cNo).
- assumption 4: non-linear adsorption isotherm C*j(x, t) = Cj(c1, c2, ...., cNo).
3.3 Multicomponent Chromatography and Predictability
Non-linear systems are characterized by thresholds, across which the system behavior cannot be predicted based on information of the behavior on one side of the threshold. Example: behavior of a car with a payload: As soon as the load exceeds the design limits, it is unsafe.Because the adsorbed concentration C is a non-linear function of the soluble concentrations c, the migration behavior is non-linear. Usually, a coupled, numerical geochemical-geohydraulic model is used to compute migration phenomena. Because of the nonlinearities, interpretation (i.e. inter- and extrapolation) of the results of numerical solutions of the transport equation is problematic, as long as it is unknown at what concentrations or parameter values the system switches from one type of behavior to another.
More conceptual insight provide the solution methods employed in the well established fields of
- multicomponent chromatography or the
- mathematics of non-linear hyperbolic differential equations.
3.4 Chemical Model: Adsorption Isotherms
Such solution methods start from specific simplified laws that describe the chemical interactions immobilizing the chemical components ("adsorption isotherm", the name implying thermodynamic equilibrium):- 1-component system,
- system with non-interacting components,
- system with several components competing for adsorption sites.
3.5 The Riemann Problem, Centered Waves
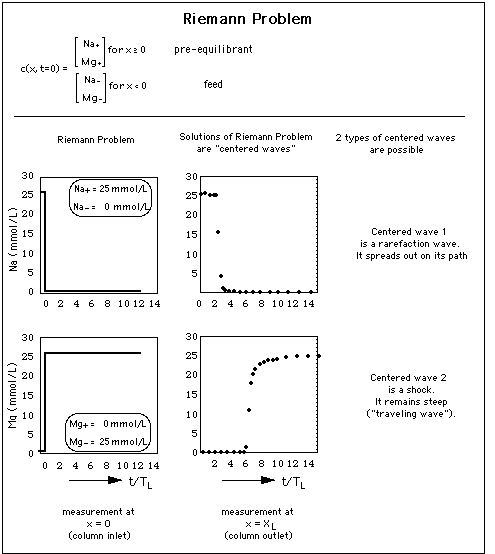
3.5.1 Definition: Riemann Problem
Concentration profiles forming after a single abrupt change of the chemical composition of the water influx ("feed") into a porous medium are called "solutions of the Riemann Problem" or "centered waves".
Initial and boundary condition of the Riemann problem
3.5.2 Assumption: Interacting "centered waves"
It is assumed that every concentration profile in a stream tube can be represented as an interaction of centered waves.3.5.3 Theorem: Centered waves
As many centered waves emerge from the abrupt concentration change (eq. 11) as there are chemical components in the system. Every centered wave- has its own fixed velocity ξj (with j = 1, ... No) = (1/Rj) q/Φ, i.e. the speed of the pore water q/Φ divided by the wave's specific retardation,
- is characterized by its own concentration vector c(ξj),
- is either a rarefaction wave or a shock (example).
4. The Jacobian Matrix, Eigenvectors and Wave Patterns
4.1 Theorem: Jacobian of the System
The matrix of the derivatives of the adsorbed concentrations with respect to the soluble concentrations (eq. 6), the Jacobian of the system, contains all information about the possible centered waves.4.2 Definition: Street Map of the System
Concentration profiles c(ξj) of the chemical components across rarefaction waves are plotted in concentration space (instead of in space-time). The grid composed of such lines is typical of the chemical interactions in the system ("street map of the system", example).4.3 Theorem: Eigenvectors of the Jacobian
The Jacobian has as many eigenvectors as the system has chemical components (or -equivalently- centered waves).- The Jacobian can be evaluated at each point in concentration space. At each point in concentration space the eigenvectors of the Jacobian are tangential to the lines of the street map.
- Vice versa, the street map of the system can be constructed from the eigenvectors of the Jacobian.
- In this way, chromatographic models are more powerful than numerical models: They automatically reveal the -chemical model dependent- thresholds in concentration space that separate areas in which the system behaves in an inherently different way due to system nonlinearities (see for example Fig. 5 in J. Gruber, "Waves in a Two-Component System: The Oxide Surface as a Variable Charge Adsorbent"),
5 Examples of Wave Patterns
Fig. 1 shows the construction of two waves in concentration space (upper right diagram) from their representation in space-time (upper left and lower right diagrams).5.1 Two-Component System with Little Competition
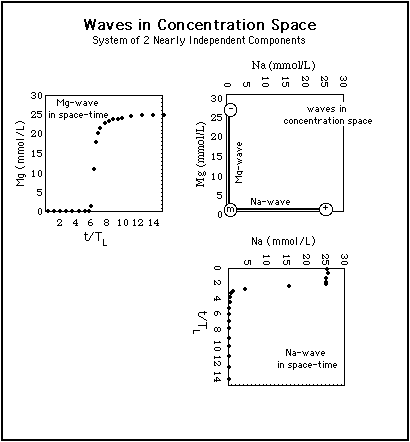
Fig. 1: Construction of waves in concentration space (central diagram) from their representation in space-time. The waves are the same as in Fig. 4. Abszissa in concentration space: Na-concentration, ordinate in concentration space: Mg-concentration. The Na-wave (rarefaction wave) arrives before the Mg-wave (shock).
Because Na and Mg ions compete very little with each other for adsorption sites, the waves are roughly parallel to the coordinate axes in concentration space.
5.2 Two-Component System with Marked Competition
Here is an example of two components (OH- and OAc-) competing strongly with each other for adsorption sites. Adsorption is via ion exchange, thus the adsorption isotherm is a 2-component isotherm of the same type as in the system of Figs. 1 and 4, i.e. as given in eq. 10. Therefore, the waves are straight lines as they are in Fig. 1, but because of the competition both concentrations vary together. Thus, the waves are no longer parallel to the coordinate axes.5.3 Three-Component System with Competition
When Cl ions are added to the solution of OH and OAc ions and concentration space becomes 3-dimensional, the resulting waves clearly show the presence of concentration thresholds separating regions of concentration space with similar wave structures. The wave structure changes across those thresholds (see Fig. 4 and Fig. 5 of that publication).5.4 Formation of Secondary Repositories
When chemical interactions are taken into account the way it has been described here (i.e. not simply by applying the linear 1-component Kd-model), it is obvious that during migration the concentration of chemical components will not necessarily decrease continuously.Here are two examples:
-
Precipitation/adsorption:
The solute runs into a "trap" for some chemical component A, i.e. the solute migrates into an area in which component A precipitates (or adsorbes to a larger degree than outside that region). -
Remobilization:
Consider the following situation: In some area the chemical component A under consideration has been immobilized either by precipitation or adsorption. Let us call this area "deposit 1 of A". Subsequently, a solute enters deposit 1 and redissolves component A. The solute thus becomes richer in A. In order to be able to dissolve deposit 1 of A, the solute has to carry high concentrations of chemical components that- form soluble complexes with A, thus "dissolving" the precipitate of A or
- compete with A for adsorption sites, thus "desorbing" A.
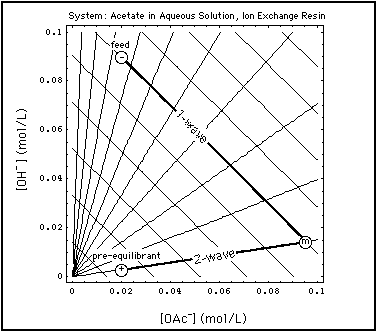
Fig. 2: Grid of centered waves in aqueous acetate system in equilibrium with an ion exchange resin ("street map of the system" is Fig. 2 in "Verification of Concentration Waves)". A specific Riemann step (-, +) is chosen, and the two waves emerging from that step are emphasized. The state m between the waves is elevated in OAc due to remobilization of previously adsorbed acetate. Abscissa: concentration of OAc in solution (mol/L), ordinate: concentration of OH in solution (mol/L).
Fig. 2 shows such a remobilization process in the aqueous acetate solution in equilibrium with an ion exchange resin. A specific Riemann Problem concentration step has been superimposed on the wave grid (street map of the system):
- The coordinates of the point + are the concentrations of the pre-equilibrant:
- OAc concentration = 0.02 mol/L
- OH concentration = 0.09 mol/L
- the coordinates of point - give the composition of the feed:
- OAc concentration = 0.02 mol/L
- OH concentration = 0.003 mol/L
- OAc concentration at m = 0.095 mol/L
- OH concentration = 0.015 mol/L
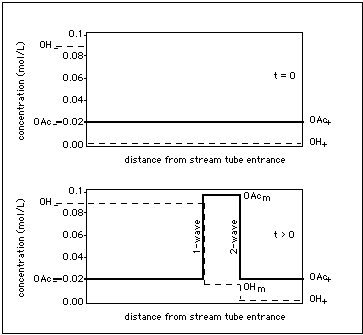
Fig. 3: Centered waves (heavy lines in Fig. 2) emerging from an initial concentration step at the column entrance. System is the same as in Fig. 2, only the representation has been switched to concentration vs. space-time. Abscissa: distance from column entrance (measured in e.g. cm), ordinate: concentration of OAc and of OH in solution (measured in e.g. mol/L). Upper part of Figure: initial concentration step(at t = 0), lower part of Figure: centered 1- and 2-wave with intermediate state m elevated in OAc. The state between the waves is elevated in OAc because previously adsorbed acetate has been remobilized.
Fig. 3 is the space-time representation of the two centered waves in Fig. 2 into which the initial concentration step develops.
6 Conclusions: Open Questions
Grid topology of multicomponent systems for- ion exchange, of e.g. alkali- and earth alkali ions, on surfaces with constant charge (clay minerals),
- complex formation of metal cations on surfaces with variable charge (metal oxides, organic surfaces)
- Position of thresholds beyond which
- the multicomponent system degenerates in a
- linear 1-component system,
- non-linear 1-component system,
- non-linear 2-component system with tentency to accumulate components
- the waves remain unchanged when initial and boundary conditions change in a certain way, and shocks and rarefaction waves are identical.
- Typical transport properties and limitations of the above adsorption models 1, 2 and 3 and the boundaries (concentration thresholds) of their regions of occurrence in concentration space.
- Proposals for experiments to find these thresholds.
- Transport calculations use data (e.g. adsorption parameters) extracted from batch experiments. Our present day experiments have been performed in a rather limited part of concentration space. It seems necessary to examine to what extent those data can be used to perfom transport calculations not only for that part of concentration space but also for more or less adjacent parts of it (see Fig. 7 in J. Gruber, 1994).
- Significance and usefulness of 2- and 3-component systems in explaining basic features of multicomponent transport.
- Development of solutions for multicomponent adsorption isotherms that cannot be represented in closed analytical form, as are the above 1- and 2-component isotherms (1, 2 and 3).
- Behavior and influence of some organic components.
7 References
Amir, L. and Kern, M. A global method for coupling transport with chemistry in heterogeneous porous media, Comput Geosci 14:465Ð481, 2010 (in cache). Aris, R. and N.R. Amundson, Mathematical Methods in Chemical Engineering, Prentice Hall, Englewood Cliffs, New Jersey, NJ 07632, 1973.Bear, J., Hydraulics of Groundwater, McGraw Hill Book Company, New York, 1979.
Merkel, B.J. and B. Planer-Friedrich, Groundwater geochemistry: a practical guide to modeling of natural and contaminated aquatic systems, D.K. Nordstrom (ed.), Springer, 2008.
Cederberg, G.A.; Street, R.L.; Leckie, J.O. A Groundwater Mass Trans port and Equilibrium Chemistry Model for Multicomponent Systems. Water Resour. Res. , 21, 1095-1104, 1985.
van Duijn, C.J. and P. Knabner, Solute transport in porous media with equilibrium and non-equilibrium multiple-site adsorption: travelling waves, J. reine angew. Math., 415, 1-49, 1991.
Dzombak, D.A. and F.M.M. Morel, Surface Complexation Modeling: Hydrous Ferric Oxide, John Wiley, 1990
Gruber, J. and A.A. Moghissi: Methodology for hazard assessment of environmental tritium, in: Internat. Conf. Behaviour of Tritium in the Environemnt, San Francisco, CA, U.S.A., October 17 - 21, 1978.
Gruber, J., High-level radioactive waste from fusion reactors, Environ. Sci. Tech. 17, 425 - 431, 1983. 1997 version
Gruber, J., Contaminant Accumulation During Transport Through Porous Media, Los Alamos National Laboratory, 1987
Gruber, J., Destabilization of waste plumes, in: Waste Management '87, Tucson, AZ, U.S.A., 1. - 5. March, 1987.
Gruber, J., Natural geochemical isolation of neutron-activated waste: scenarios and equilibrium models, Nuclear and Chemical Waste Management, 8, 13 - 32, 1988.
Gruber, J., Contaminant Accumulation During Transport Through Porous Media, Water Resourc. Res., 26, 99 - 107, 1990.
Gruber, J., Waves in a Two-Component System: The Oxide Surface as a Variable Charge Adsorbent, Ind. Eng. Chem. Res., 34, 8, 1994. Abstract
Gruber, J., Advective Transport of Interacting Solutes: The Chromatographic Model, Springer, Heidelberg, 1994a. Abstract
Gruber, J., Transport in wandernden Fronten, in: Umweltverhalten von Sedimenten, Abschlußbericht, BMFT-Verbundprojekt 02WT90143, 1994b. Abstract
Gruber, J., Advective transport of interacting solutes: the chromatographic model, Chapter 11 in: U. Förstner and W. Calmano (eds.), "Sediments and Toxic Substances", Environmental Sciences Series, Springer, Heidelberg, 1996.
Gruber, J., Concentration waves: chromatographic theory and experimental verification
Gruber, J. und R. Klein, Remobilisierende Wellen in Strompfaden bei chemischem Gleichgewicht: Anreicherung im Rahmen der Vielkomponenten-Chromatographie, 1997.
Helfferich, F. and G. Klein, Multicomponent Chromatography - Theory of Interference, Marcel Dekker, New York, 1970.
Lichtner, P.C., Continuum model for simultaneous chemical reactions and mass transport in hydrothermal systems, Geochim. Cosmochim. Acta, 49, 779-800, 1985.
Liu, T.-P., Hyperbolic conservation laws with relaxation, Commun. Math. Phys. 108, 153-175 , 1987.
Ortoleva, P. et al., Redox front propagation and banding modalitites, Physica, 19D, 334-354, 1986.
Ortoleva, P., E. Merino, G. Moore, and J. Chadam, Geochemical self-organization I: Reaction-transport feedbacks and modeling approach, Am. J. Sci., 287, 979-1007, 1987.
Ortoleva, P. "NONLINEAR PHENOMENA AT GEOLOGICAL REACTION FRONTS WITH ENERGY APPLICATIONS", Report Prepared by Peter Orto;eva, Geo-Chemical Research Assoc., 1105 Brooks Dr., Bloomington, IN 47401, DOE/ER/13802--2, DE93 008375, Final Report, DOE Grant #DE-FG02-87ERI3802-A000, for the Basic Energy Sciences Program, US Department of Energy, 1993 (in cache).
Ortoleva, P., principal investigator, Self-Organized Mega-Structures in Sedimentary Basins", Department of Energy/Basic Energy Sciences, Contract No. DE-FG02-91ER14175, Final Report, November 2000 - October 2003 (in cache).
Rhee, H.-K., R. Aris and N.R. Amundson, On the theory of multicomponent chromatography, Philos. Trans. Roy. Soc. London, A267, 419 - 455, 1970.
Rhee, H.-K., R. Aris and N.R. Amundson, First-Order Partial Differential Equations: Volume II, Theory and Application of Hyperbolic Systems of Quasilinear Equations, Prentice Hall, Englewood Cliffs, New Jersey, NJ 07632, 1989.
Runkel, R.L., Bencala, K.E., Broshears, R.E., Chapra, S.C., Reactive Solute Transport in Streams: I. Development of an Equilibrium-based Model, U.S. Geological Survey, University of Colorado, June 18, 1997
Schweich, D., J. Villermaux, M. Sardin, An introduction to the non-lin ear theory of adsorptive reactors, AIChE Journal, 26, 3, 477-486, 1980Tondeur, D., Unifying concepts in non-linear unsteady processes, Part I: Solitary travelling waves, Chem. Eng. Process., 21, 167-178, 1987.
Tondeur, D., Unifying concepts in non-linear unsteady processes, Part I: Solitary travelling waves, Chem. Eng. Process., 21, 167-178, 1987.
van der Zee, S.E.A.T.M., Analytical traveling wave solution for transport with nonlinear nonequilibrium adsorption, Water Resour. Res., 26, 2563-2577, 1990.
8 APPENDIX
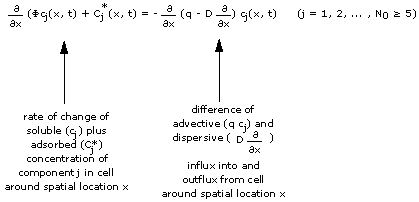
Consider a column filled with an adsorbing porous medium and water ("pore water"). Both the water and the adsorbing medium contain chemical components (like Na or Mg) in addition to some background components Bg. We have a total of N0 chemical components in the column.
Consider further that everywhere in the column each chemical component has its own concentration, and that this "initial concentration spectrum" is the same throughout the column and does not change with time.
Consider now water with a new concentration spectrum ("feed") being continuously fed into the column entrance (x = 0) while the same amount of water with the initial concentration spectrum leaves the column exit. This abrupt change of the chemical composition of the water propagates through the column: One notices that the change splits into a number of changes separated by areas of constant concentration. Changes and constant states migrate through the column. The migrating changes will be called "waves" and the constant concentrations between the waves will be called "constant states".
This process is usually calculated by numerically solving the equations describing the transport of the chemical components: For every initial and feed concentration spectrum the computer comes up with a set of waves and constant states. Because the chemical interactions with the porous medium depend non-linearly on the component concentrations, one principally cannot inter- or extrapolate between computed results.
Another way of calculating waves and constant states is solving the transport equations analytically. This way we get one complete solution for all initial and feed concentrations. The solution is a graphical map of all waves and constant states that the chemical system can generate. In "Multicomponent Chromatography" Helfferich (Helfferich & Klein, 1970) calls it the "street map of the system". In mathematics (Hyperbolic Systems of Conservation Laws, Lax 1957, 1973) it is called a "hodograph".
This paper will explain waves using the latter method, i.e. using analytical solutions of the transport process.
If the distribution coefficient Kd is independent from the solute concentration, then
and this simplifies the expression for the retardation of the contaminant (retardation with respect to the water, the solvent of the components):
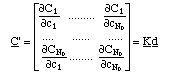
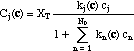
The concentration of any species j on the adsorption sites ("adsorbed concentrations", Cj) is a function of the concentration of all species:
C1(c1, c2, ...., cNo)
The derivatives of adsorbed concentrations with respect to the soluble concentrations can be expressed in matrix form (the equivalent of eq. 3)
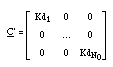
The Kd matrix is called Jacobian of the system.
The retardation is expressed by the matrix R, which is diagonal, too, and composed of the retardations of each independent component (the equivalent of eq. 4)
Solution:
where component j = 1 is Na, and j = 2 is Mg. Bg is the constant background ion concentration, consisting of any number of ions.
Cj(c) = XT kj cj or
Kd(cj <<1/ki, i = 1, 2) = XT kj.
The retardation of the component in the column is Rj > 1 (as given in eq. 4), i.e. the solute j travels with a speed smaller than the speed of pure water.
Cj(c) = XT or
Kd(cj >>1/kj) = 0.
The retardation of component j is Rj = 1 (see eq. 4), i.e. at those concentrations the solute j travels with nearly maximum speed (i.e. with nearly the speed of pure water).
This means: a single abrupt change of the concentraton of the incoming water at x = 0 develops in space-time
into N0 centered waves, i.e. waves emerging from x = 0, each wave having its own, fixed velocity ξj. In multicomponent chromatography this is called "coherence".
Fig. 4: Concentration waves result from a sudden concentration jump at the entrance of a column filled with a porous medium. In other words: the column entrance is the origin of 2 waves, the waves being "centered" about x = 0. There is very little competition between Na and Mg for adsorption sites, thus in concentration space the waves are almost parallel to the coordinate axes. y-axis: concentration (units mmol per liter) measured at column inlet x = 0 and exit x = XL as a function of time t.
The abszissa expresses time t as multiples of TL, the time necessary for pure (ion free) water to travel from the column entrance to the column exit.
The concentration of adsorption sites on the porous medium covered with (more loosely bound) background ions
is larger than the concentration of adsorbed Na and Mg ions, thus there are plenty of adsorption sites available for Na and Mg. Therefore the influence of the Na concentration drop at time t = 3 TL and the one of the Mg concentration rise at time t = 6 TL is not visible.
8.1 1-component system
The adsorbed concentration C is given
as the following function of the soluble concentration c:
(eq. 2)
C(c) = Kd(c) c ("adsorption isotherm")
![]()
8.2 System with N0 Components
C2(c1, c2, ...., cNo)
....
CNo(c1, c2, ...., cNo)
8.2.1 Non-Interacting Components
In the case of independent components, i.e. when Cj = Cj(cj) (similar to the example presented in Fig. 4), the Jacobian is obviously diagonal:
8.2.2 Competing Components
The components compete for adsorption sites as quantified by the multicomponent isotherms below. Specific examples:
8.2.2.1 Example of Competitive Adsorption
In the experiment shown in Fig. 4 adsorption
(eq. 12)
![]()
If -as is the case in the experiment of Fig. 4- the background components bind poorly to the adsorption sites and if there are plenty of adsorption sites occupied with background ions, Na and Mg ions have an ample choice of adsorbing sites, i.e. they can choose from any of XT sites. Thus they compete to a rather limited extent with each other.
8.2.2.2 Transport Properties of Competitive Adsorption
The form of the wave depends on the adsorption properties of the porous medium as specified by the adsorption isotherm eq. 12.
8.3.2 Inherent Assumptions when Solving System with Multicomponent Isotherm
8.3.2.1 Mathematical Model
c(x, t) = c(ξj)
8.3.2.2 Chemical Model
The adsorption processes can be simplified in various ways (see also Gruber und Klein):
(eq. 10)
8.4 Examples of Centered Waves
Centered waves are shown in Fig. 4.
The left side of Fig. 4. shows the concentration jump as a function of time at the column
entrance. The right side shows the concentration waves that originate from the concentration jump at the column entrance.
8.4.1 Rarefaction Wave
Thus, when a wave has a higher concentrations at its front than at its tail, the front concentrations travel faster than the low concentrations at its end, and the wave spreads out as it travels through the column. It it therefore called "rarefaction wave" (see upper part of Fig. 2).
8.4.2 Shock
The reverse situation is interesting:
When the solute with high concentration is located behind the solute with low concentration, it "bumps" into the solute with low concentration. The concentration step does not spread out as it travels through the column. This type of solution to the Riemann problem is called "shock", and it is visualized in the lower part of Fig. 2. The wavefront spreads only due to hydrodynamic dispersion or molecular diffusion as described for a 1-component system with dispersion in sections 12 A 1 and 12 A 2 in J. Gruber, Advective Transport of Interacting Solutes: The Chromatographic Model. A shock that is broadened by dispersion is called "traveling wave" (Liu, 1987).
Location
(URL) of this page
Physics Home
Version: 7 July 2015
Joachim Gruber